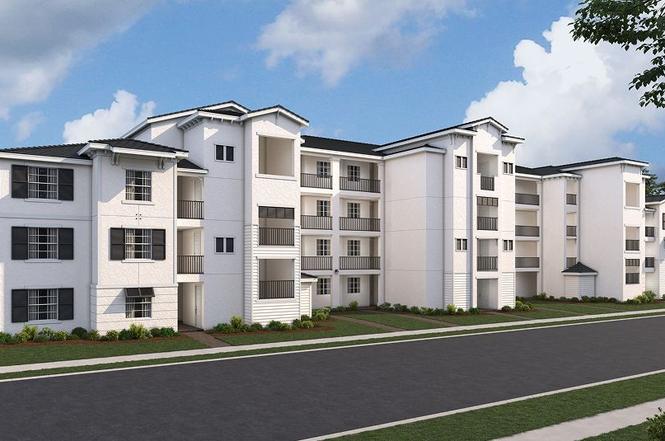
15285 Green Acres Ave #435 · North Fort Myers, FL
Flood risk No data
- FEMA flood zone
- —
- Chance of flooding over 30 yrs
- —
- Est. flood insurance / yr
- —
Fire risk No data
- Est. fire insurance / yr
- —
Heat risk No data
- Hot days now (above threshold)
- —
- Hot days in 30 yrs
- —
Wind risk No data
- Chance of severe wind over 30 yrs
- —
Air-quality risk No data
- Unhealthy air days now
- —
- Unhealthy air days in 30 yrs
- —
Risk factors via First Street. Map © Google.
Why this score? — see what drove the D+ grade
The composite is a weighted blend of 9 inputs, each scored 0–100. Each bar is that input's sub-score; the figure is the points it added to the 100-point composite (weight × sub-score).
- Cash flow +15.3/30.0
- ARV discount +6.8/15.0
- DSCR +4.7/10.0
- Schools +4.6/10.0
- 1% rule +4.2/10.0
- Livability +3.7/5.0
- Rent growth +3.5/5.0
- Condition / age +2.5/5.0
- Appreciation +2.4/10.0
$222,798
🖨 Deal sheet (PDF) 📄 Offer letter ✓ Due diligence
Listing remarks
This cozy single-story condo features a split floorplan with an open layout among the kitchen, dining room and living room, with sliding doors that extend to the lanai for outdoor activities. Next to the lanai is the luxe owner's suite, while a secondary bedroom is near the foyer-offering privacy for everyone.
Key facts
- Secondary bedroom
- Split floorplan
- Luxe owner's suite
Tags
Property features AI
Finance
- Financial info: List price $222,798
Exterior
- Home design: Spec home, Arbor plan
- Construction: 1,120 living area
- Exterior features: Located at 15285 Green Acres Ave #435, Punta Gorda, FL 33982
Interior
- Bedrooms: 2 bedrooms
- Bathrooms: 2 full bathrooms
- Interior features: Open living area
Neighborhood map
What this means for you Summary
Snapshot
- This is a 2-bed/2.0-bath townhouse listed at $223k.
Deal economics
- At list price, monthly cash flow is $80 ($955/yr) — positive.
- The deal already cash-flows at list — no discount required.
- To meet the 1% rule (rent ≥ 1% of price), the offer needs to be $205k (8.0% below list).
- Recommended offer: $196k (12.0% below list) — sets the bar for market timing.
- Cap rate 6.7% vs local median 3.6% in North Fort Myers — top-decile yield for the area; either an underpriced asset or a hidden risk that comps aren't pricing in. Stress-test before assuming the spread holds.
Location & tenants
- Location reads 74/100 on livability (#269 in FL, #4,409 nationally) — a middle-class / working-renter tenant base. Strengths: cost of living A+, housing A+, health & safety A+; Watch: employment C-, amenities F, commute F.
- Charlotte (suburban): math 54% / reading 54% proficiency, ranked #22 of 73 in FL (top 30%) — acceptable for families but not a draw, mixed tenant base, ~2y average lease.
- Market conditions: Rents rising fast (+4.1%/yr); 1037 active listings in the ZIP; 40 comparable units currently listed for rent nearby; rentals at typical pace (median 22d on market — plan ~3-4 weeks tenant-placement turnaround); 4,585 units permitted in Charlotte County in 2024 (703 in 5+ unit buildings).
- This rent runs 34% of the median local income ($72k/yr) — at the standard rent-burdened threshold; future hikes will face affordability resistance.
Forward outlook
- Local home prices are declining (-3.0%/yr); year-one equity from $2k of loan paydown is wiped out by about $7k of value loss. Plan a longer hold.
- Charlotte County population projected at +24% by 2050 — long-run rental-demand tailwind backs the buy-and-hold thesis.
Negotiation context
- It's been on market 326 days — a 12% lower offer ($196k) is reasonable based on typical stale-listing flexibility.
Questions for the listing agent
- It's been on market 326 days. Have you received any prior offers? Is the seller open to a 12% concession, seller financing, or rate buy-down credit?
- Why hasn't it sold? Are there any deal-killer items the seller is aware of (foundation, flood, title, zoning, code violations)?
- Is there a deadline driving the sale (1031 exchange, divorce, estate, relocation)? That informs how much negotiation room exists.
- The area grade is low — what's the realistic commute time and amenity access for the typical tenant pool here? Any planned neighborhood developments (good or bad) we should know about?
- What's the average days-on-market for RENTAL listings here right now (not sales)? A rising rental-DOM trend means longer vacancies and softer asking-rent achievability than the comps imply.
- What's the recent tenant-quality profile in this submarket — average credit score on applications, eviction rate, late-payment / NSF rate, and stable-employment percentage? A property-management company in the area should have these aggregated.
- How much new for-sale + rental construction is in the pipeline within 1–3 miles? Heavy new supply typically softens prices + rents 12–24 months out; constrained supply supports both.
Investment metrics
- 1% rule
- 0.92% ✗
- Cap rate
- 6.72%
- Cash-on-cash
- 1.53%
- DSCR
- 1.07
- GRM
- 9.1
CMA / ARV
- ARV (on-the-fly)
- $219,520
- Comps found
- 2
Show comp detail 2 sales within ~0.75 mi
| Address | Dist | Beds/Ba | Sqft | Sold | Price | $/sf | Match |
|---|---|---|---|---|---|---|---|
| 15405 Green Acres Ave #2343 | 0.18mi | 2/2.0 | 1,120 (0%) | 3mo | $219,000 | $196 | 89 |
| 15285 Green Acres Ave #412 | 0.23mi | 2/2.0 | 1,154 (+3%) | 10mo | $220,000 | $191 | 76 |
Match score weights: distance 35% · size 25% · config 20% · recency 20%. Top-matched comps best support the ARV.
Projected returns pro-forma
-3.0% appreciation · 4.13% rent growth · sell at horizon
- IRR
- -12.6%
- Equity multiple
- 0.54×
- Total profit
- $-28,648
- Equity at exit
- $33,220
- IRR
- -1.9%
- Equity multiple
- 0.87×
- Total profit
- $-8,400
- Equity at exit
- $19,263
Cash invested: $62,383 (down + closing). Projections, not guarantees.
Landlord ↔ Tenant lean methodology
- Overall (STATE)
- 87 Strongly Landlord-Friendly
- State Florida
- 87 Strongly Landlord-Friendly · R+3
- County
- — inherits STATE
- City
- — inherits STATE
ZIP-level market 33982
- Home prices YoY
- -1.2%
- Rents YoY
- 4.1%
- Active inventory
- 1037
- Price-to-rent
- 9.1×
Monthly cashflow live
- Estimated rent
- $2,050 medium interval (Pro) →
- Mortgage (P&I)
- −$1,168
- Tax est. 1.5%
- −$278 /mo · $3,342/yr
- Insurance
- −$93
- HOA
- −$0
- Vacancy / Maint / Mgmt
- −$430
- Net cashflow
- $80
Break-even live
Sensitivity live
| Price | -10% $234 | -5% $157 | +0% $80 | +5% $3 | +10% $-74 |
|---|---|---|---|---|---|
| Rent | -10% $-82 | -5% $-1 | +0% $80 | +5% $161 | +10% $241 |
| Rate | -1.0pp $192 | -0.5pp $136 | base $80 | +0.5pp $22 | +1.0pp $-37 |
UW: 25.0% down · 7.5% · 30yr · 1.5% tax · 5.0% vac · 8.0% maint · 8.0% mgmt
Financing live
Cash to close
- Down payment
- $55,700
- Closing costs
- $6,684
- Reserves months
- —
- Total cash needed
- —
Loan-product check · same deal, 3 products live
Conventional
25% down · 7.5% · 30yr
- Down + closing
- —
- Monthly P&I
- —
- Monthly cashflow
- —
- DSCR
- —
- Eligible?
- —
Personal DTI + credit; lowest rate.
DSCR
20% down · 8.5% · 30yr
- Down + closing
- —
- Monthly P&I
- —
- Monthly cashflow
- —
- DSCR
- —
- Eligible?
- —
No personal income docs; deal must DSCR.
Hard money
10% down · 12.0% · 12mo
- Down + closing
- —
- Monthly P&I
- —
- Monthly cashflow
- —
- DSCR
- —
- Eligible?
- —
Short-term bridge; refi at stabilization.
Rent comps 40 comps
| Address | Beds | Baths | Sqft | Rent | $/sqft | DOM | Units | Dist |
|---|---|---|---|---|---|---|---|---|
| 15345 Green Acres Ave Unit 2117 Punta Gorda, FL | 2.0 | 2.0 | 1154 | $6,000 | $5.20 | 21d | 1 | 0.02mi |
| 15375 Green Acres Ave #2211 Punta Gorda, FL | 3.0 | 2.0 | 1301 | $2,295 | $1.76 | 21d | 1 | 0.02mi |
| 15285 Green Acres Ave Unit 425 Punta Gorda, FL | 2.0 | 2.0 | 1120 | $4,950 | $4.42 | 21d | 1 | 0.02mi |
| 15285 Green Acres Ave Unit 425 Punta Gorda, FL | 2.0 | 2.0 | 1120 | $4,950 | $4.42 | 14d | 1 | 0.02mi |
| 15345 Green Acres Ave #2111 Punta Gorda, FL | 3.0 | 2.0 | 1301 | $4,795 | $3.69 | 21d | 1 | 0.03mi |
| 15345 Green Acres Ave #2116 Punta Gorda, FL | 2.0 | 2.0 | 1154 | $1,900 | $1.65 | 21d | 1 | 0.03mi |
| 15285 Green Acres AVE #415 Punta Gorda, FL | 2.0 | 2.0 | 1120 | $1,800 | $1.61 | 21d | 1 | 0.04mi |
| 15275 Green Acres Ave #337 Punta Gorda, FL | 2.0 | 2.0 | 1154 | $1,900 | $1.65 | 21d | 1 | 0.07mi |
| 15275 Green Acres Ave #324 Punta Gorda, FL | 2.0 | 2.0 | 1120 | $1,600 | $1.43 | 21d | 1 | 0.07mi |
| 15275 Green Acres Ave #338 Punta Gorda, FL | 3.0 | 2.0 | 1301 | $4,795 | $3.69 | 21d | 1 | 0.07mi |
| 15275 Green Acres Ave #344 Punta Gorda, FL | 2.0 | 2.0 | 1120 | $5,500 | $4.91 | 21d | 1 | 0.07mi |
| 15275 Green Acres Ave #323 Punta Gorda, FL | 2.0 | 2.0 | 1154 | $5,000 | $4.33 | 21d | 1 | 0.07mi |
| 15275 Green Acres Ave #335 Punta Gorda, FL | 2.0 | 2.0 | 1120 | $4,000 | $3.57 | 21d | 1 | 0.07mi |
| 15375 Green Acres Ave #2243 , FL | 2.0 | 2.0 | 1120 | $4,500 | $4.02 | 14d | 1 | 0.16mi |
| 15405 Green Acres Ave #2327 , FL | 2.0 | 2.0 | 1154 | $4,500 | $3.90 | 14d | 1 | 0.16mi |
| 15405 Green Acres Ave Unit 2322 Punta Gorda, FL | 2.0 | 2.0 | 1150 | $4,000 | $3.48 | 21d | 1 | 0.16mi |
| 15405 Green Acres Ave #2341 Punta Gorda, FL | 2.0 | 2.0 | 1154 | $5,500 | $4.77 | 21d | 1 | 0.16mi |
| 15405 Green Acres Ave #2331 Punta Gorda, FL | 3.0 | 2.0 | 1301 | $5,500 | $4.23 | 21d | 1 | 0.16mi |
| 15285 Green Acres AVE #414 Punta Gorda, FL | 2.0 | 2.0 | 1120 | $6,000 | $5.36 | 21d | 1 | 0.22mi |
| 15195 Pinehurst Ln Unit 925 Punta Gorda, FL | 2.0 | 2.0 | 1366 | $6,000 | $4.39 | 21d | 1 | 0.39mi |
| 15195 Pinehurst Ln Unit 917 Punta Gorda, FL | 2.0 | 2.0 | 1355 | $5,500 | $4.06 | 21d | 1 | 0.39mi |
| 15175 Bluffton Ln Unit 724 Punta Gorda, FL | 2.0 | 2.0 | 1366 | $3,000 | $2.20 | 21d | 1 | 0.49mi |
| 15175 Pinehurst Ln Unit 724 Punta Gorda, FL | 2.0 | 2.0 | 1366 | $5,000 | $3.66 | 21d | 1 | 0.49mi |
| 14923 Anchorage Rd Punta Gorda, FL | 3.0 | 2.0 | 1417 | $2,200 | $1.55 | 21d | 1 | 0.56mi |
| 15960 Grassland Ln #2727 Punta Gorda, FL | 2.0 | 2.0 | 1422 | $6,000 | $4.22 | 21d | 1 | 1.03mi |
| 15960 Grassland Ln #2714 Punta Gorda, FL | 2.0 | 2.0 | 1366 | $2,800 | $2.05 | 21d | 1 | 1.03mi |
| 16000 Grassland Ln #3127 Punta Gorda, FL | 2.0 | 2.0 | 1355 | $6,000 | $4.43 | 21d | 1 | 1.05mi |
| 15930 Grassland Ln #2412 Punta Gorda, FL | 2.0 | 2.0 | 1355 | $6,600 | $4.87 | 21d | 1 | 1.08mi |
| 43985 Boardwalk Loop #2138 Punta Gorda, FL | 3.0 | 2.0 | 1301 | $1,975 | $1.52 | 21d | 1 | 1.22mi |
| 43985 Boardwalk Loop #2141 Punta Gorda, FL | 2.0 | 2.0 | 1198 | $6,000 | $5.01 | 21d | 1 | 1.22mi |
| 43977 Boardwalk Loop #2315 Punta Gorda, FL | 2.0 | 2.0 | 1120 | $4,500 | $4.02 | 21d | 1 | 1.24mi |
| 43031 Greenway Blvd #1014 Punta Gorda, FL | 2.0 | 2.0 | 1366 | $6,000 | $4.39 | 21d | 1 | 1.26mi |
| 43021 Greenway Blvd #1115 Punta Gorda, FL | 2.0 | 2.0 | 1355 | $2,600 | $1.92 | 21d | 1 | 1.26mi |
| 43989 Boardwalk Loop #2028 Punta Gorda, FL | 3.0 | 2.0 | 1301 | $5,500 | $4.23 | 21d | 1 | 1.27mi |
| 43989 Boardwalk Loop #2032 Punta Gorda, FL | 2.0 | 2.0 | 1154 | $6,000 | $5.20 | 21d | 1 | 1.27mi |
| 43989 Boardwalk Loop #2024 Punta Gorda, FL | 2.0 | 2.0 | 1120 | $5,400 | $4.82 | 21d | 1 | 1.27mi |
| 43989 Boardwalk Loop #2041 Punta Gorda, FL | 2.0 | 2.0 | 1154 | $1,850 | $1.60 | 21d | 1 | 1.27mi |
| 43989 Boardwalk Loop #2042 Punta Gorda, FL | 2.0 | 2.0 | 1120 | $5,000 | $4.46 | 21d | 1 | 1.27mi |
| 43051 Greenway Blvd #822 Punta Gorda, FL | 2.0 | 2.0 | 1355 | $7,500 | $5.54 | 21d | 1 | 1.27mi |
| 44458 Diamond Trl Punta Gorda, FL | 3.0 | 2.0 | 1484 | $2,500 | $1.68 | 21d | 1 | 1.28mi |
Listing history 14 events
-
2026-06-18days on market $222,798 Active 326 DOM
-
2026-06-17days on market $222,798 Active 325 DOM
-
2026-06-16days on market $222,798 Active 324 DOM
-
2026-06-15days on market $222,798 Active 323 DOM
-
2026-06-14days on market $222,798 Active 321 DOM
-
2026-06-13days on market $222,798 Active 320 DOM
-
2026-06-10days on market $222,798 Active 318 DOM
-
2026-06-09days on market $222,798 Active 317 DOM
-
2026-06-08days on market $222,798 Active 316 DOM
-
2026-06-05days on market $222,798 Active 312 DOM
-
2026-06-02days on market $222,798 Active 310 DOM
-
2026-06-01days on market $222,798 Active 309 DOM
-
2026-05-31days on market $222,798 Active 308 DOM
-
2026-05-30days on market $222,798 Active 307 DOM
ⓘ Source: listings_history table (triggers on properties + properties_extension) + one-shot
backfill from property_details.listing_events for pre-trigger history.
Nearby sold comps map
Loading sold comps map…
Walkable amenities ~0.75 mi
Loading nearby amenities…
Taxation est. · year 1
- Rental income
- $24,597
- − Mortgage interest
- −$12,480
- − Property taxes
- −$3,342
- − Insurance
- −$1,114
- − Repairs & maintenance
- −$1,968
- − Management
- −$1,968
- − Depreciation
- −$6,481
- Taxable loss
- −$2,756
- Est. tax savings @ 24.0%
- +$662
- After-tax cash flow
- $1,616/yr
For passive investors: Depreciation is non-cash, so a rental often shows a tax loss while cash-flowing — sheltering income. Rental losses are passive: they offset passive income freely, and up to $25,000/yr can offset ordinary (W-2) income if you actively participate and your MAGI is under $100k (phasing out to $0 by $150k); unused losses carry forward. On sale, claimed depreciation is recaptured at up to 25%, and gains may owe capital-gains tax (a 1031 exchange can defer both). Figures are a year-1 estimate at your 24.0% rate — not tax advice; consult a CPA.
Schools (NCES district)
- District
- Charlotte
- NCES district ID
- 1200240
- Math proficiency
- 54% ▼ -6.00%
- Reading proficiency
- 54% ▼ -1.00%
- Median HH income
- $44,864
- Composite
- 45.62/100
- National rank
- #2586
- State rank
- #22 of 73 in FL
Livability — North Fort Myers
- Score
- 74/100
- State rank
- #269
- US rank
- #4409
Category grades
Schools grade is shown separately in the Schools card above.
Census & demographics
- County
- Charlotte County · 196,994 people
- City population
- 57,035
- Metro
- Punta Gorda, FL
- Population (ZIP)
- 13,006
- Household income
- $72,443
- Rent vs Own
- Severe rent burden
- 43.0
Population outlook (Charlotte County) Hauer SSP2
- Today (2025)
- 198,646 people
- By 2030
- 210,507 · +6.0%
- By 2040
- 230,857 · +16.2%
- By 2050
- 247,148 · +24.4%
- By 2075
- 281,777 · +41.8%
- By 2100
- 293,609 · +47.8%
Race, ethnicity, and origin ACS 2023
- Neighborhood character
- Predominantly White (81%)
- Race & ethnicity
- White 81% Two or more races 8% Hispanic / Latino 7% Black 7%
- Hispanic origin (detail)
- Puerto Rican 2% Cuban 3%
- Common ancestry
- Lithuanian 3% Iranian 3% Slovak 3%
- Foreign-born
- 6% · Canada, Jamaica
- Languages at home
- 93% English-only · Spanish 5% German/W. Germanic 1% Arabic 1%
Political lean MEDSL · Charlotte
- 2024 margin
- Solid R (+34.0) · D 32.7% · R 66.7%
- 2008→2024 swing
- -26.7pp toward R · 2008: -7.2pp · 2024: -34.0pp
- All cycles
- 2024: R+34.0 2020: R+26.6 2016: R+27.8 2012: R+14.3 2008: R+7.2
Not yet ingested
- Civics
- —
Market trends
- HPI YoY
- ▼ -5.25%
- Current HPI
- 448.5895
- Rent YoY
- ▲ 4.13%
- Metro
- Punta Gorda, FL
- State GDP YoY
- ▲ 3.28%
- F500 in state
- 36
Industry mix (Fortune 500 HQ in FL)
| Industry | F500 HQs | Revenue |
|---|---|---|
| Industrial Technology | 2 | $29B |
|
||
| Insurance | 2 | $17B |
|
||
| Retail | 1 | $60B |
|
||
| Technology Distribution | 1 | $58B |
|
||
| Homebuilding | 1 | $35B |
|
||
| Technology Manufacturing | 1 | $35B |
|
||
Cash-flow waterfall
monthlySold comps — $/sqft
last 12 mo · ≤1 miLoading sold comps…