 🏷️ Likely Rental
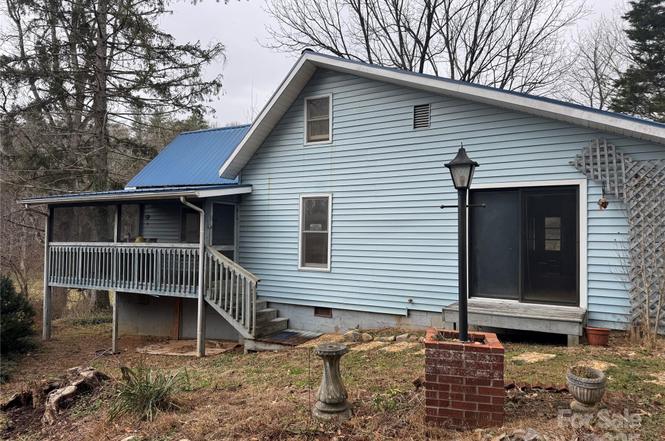
201 Tinsley Rd · Brevard, NC
Flood risk 1/10 · Minimal
- FEMA flood zone
- X (unshaded)
- Chance of flooding over 30 yrs
- 0.0%
- Est. flood insurance / yr
- $507 – $1,088
Fire risk 2/10 · Minimal
- Est. fire insurance / yr
- $906 – $1,684
Heat risk 3/10 · Minor
- Hot days now (above 97°F)
- 7 days/yr
- Hot days in 30 yrs
- 20 days/yr
Wind risk 2/10 · Minimal
- Chance of severe wind over 30 yrs
- —
Air-quality risk 3/10 · Minor
- Unhealthy air days now
- 3 days/yr
- Unhealthy air days in 30 yrs
- 3 days/yr
Risk factors via First Street. Map © Google.
Why this score? — see what drove the B- grade
The composite is a weighted blend of 9 inputs, each scored 0–100. Each bar is that input's sub-score; the figure is the points it added to the 100-point composite (weight × sub-score).
- Cash flow +25.2/30.0
- ARV discount +15.0/15.0
- DSCR +8.3/10.0
- 1% rule +5.3/10.0
- Schools +4.0/10.0
- Livability +3.2/5.0
- Rent growth +2.5/5.0
- Condition / age +2.5/5.0
- Appreciation +0.0/10.0
$250,000
🖨 Deal sheet 📄 Offer letter ✓ Due diligence
Listing remarks
Older home within minutes to downtown Brevard, This home is in a quiet area overlooking pasture land across the road. The home is going to require some work on the foundation. It has multiple types from piers to block, but has a paved driveway and metal roof. Perfect place for a flipper or someone looking for a renter to fixup.
Key facts
- Metal roof
- Paved driveway
- 1 acre lot
Tags
Property features AI
Finance
- Other: Property zoned SFR; No other structures on the lot; Approximately 1 acre lot; Elevation ~1500 ft
- Financial info: No investor/multi-unit income or expense details provided
- HOA & community: No HOA dues; No community features
Exterior
- Parking: Driveway
- Security: Two or more access exits
- Utilities: City water; Septic system installed; Electricity connected
- Home design: Single-family residence; Site-built construction; One-story home; Faces unspecified direction
- Construction: Vinyl exterior; Metal roof; Built on site; Crawl space foundation
- Exterior features: Enclosed front porch; Front porch; Level and sloped lot; Asphalt/paved public road access
Interior
- Kitchen: Electric oven; Electric range; Microwave
- Bedrooms: 4 bedrooms on the main level
- Flooring: Carpet; Linoleum; Vinyl
- Bathrooms: 2 full bathrooms on the main level
- Heating & cooling: Forced air heating; Oil-fired heating; No cooling (N/A)
- Interior features: Attic with pull-down stairs; Crawl space and other basement/foundation access
- Laundry & utility: Dedicated laundry room; Washer; Dryer
Neighborhood map
What this means for you Summary
Snapshot
- This is a 4-bed/2.0-bath single-family listed at $250k.
Deal economics
- At list price, monthly cash flow is $557 ($7k/yr) — positive.
- The deal already cash-flows at list — no discount required.
- Meets the 1% rule at list price ($3k rent vs $250k).
- Recommended offer: $220k (12.0% below list) — sets the bar for market timing.
- Cap rate 9.0% vs local median 2.1% in Brevard — top-decile yield for the area; either an underpriced asset or a hidden risk that comps aren't pricing in. Stress-test before assuming the spread holds.
Location & tenants
- Location reads 64/100 on livability (#353 in NC) — a middle-class / working-renter tenant base. Strengths: cost of living A+, health & safety A+, crime B; Watch: schools D+, amenities F, commute F.
- Transylvania County Schools (town): math 44% / reading 50% proficiency, ranked #79 of 178 in NC (top 44%) — families likely to look elsewhere, expect single-tenant / working-renter base with shorter leases.
- Market conditions: 351 active listings in the ZIP; 217 units permitted in Transylvania County in 2024 (10 in 5+ unit buildings).
- At $2,583/mo this rent would consume 49% of the median local household income ($63k/yr) (locally 852% of renters already pay >50% of income on rent) — very limited rent-growth headroom before tenants either downsize or default.
Forward outlook
- Local home prices are declining (-3.0%/yr); year-one equity from $2k of loan paydown is wiped out by about $8k of value loss. Plan a longer hold.
- Transylvania County population projected to shrink 7% by 2050 — rents likely to lag national; underwrite the cash flow, not the appreciation.
Negotiation context
- It's been on market 190 days — a 12% lower offer ($220k) is reasonable based on typical stale-listing flexibility.
Risks & watch-outs
- Watch-outs: built in 1950 — expect roof / HVAC / electrical / plumbing capex.
Questions for the listing agent
- It's been on market 190 days. Have you received any prior offers? Is the seller open to a 12% concession, seller financing, or rate buy-down credit?
- Built in 1950 — when were the roof, HVAC, electrical panel, plumbing, and water heater last replaced?
- Why hasn't it sold? Are there any deal-killer items the seller is aware of (foundation, flood, title, zoning, code violations)?
- Is there a deadline driving the sale (1031 exchange, divorce, estate, relocation)? That informs how much negotiation room exists.
- Schools are D-rated, which usually means shorter tenancies and higher turnover. Who's the typical renter profile here, and what's been the actual vacancy rate?
- What's the average days-on-market for RENTAL listings here right now (not sales)? A rising rental-DOM trend means longer vacancies and softer asking-rent achievability than the comps imply.
- What's the recent tenant-quality profile in this submarket — average credit score on applications, eviction rate, late-payment / NSF rate, and stable-employment percentage? A property-management company in the area should have these aggregated.
- How much new for-sale + rental construction is in the pipeline within 1–3 miles? Heavy new supply typically softens prices + rents 12–24 months out; constrained supply supports both.
Investment metrics
- 1% rule
- 1.03% ✓
- Cap rate
- 8.97%
- Cash-on-cash
- 9.55%
- DSCR
- 1.43
- GRM
- 8.1
CMA / ARV
- ARV (on-the-fly)
- $446,160
- Comps found
- 9
Show comp detail 9 sales within ~0.75 mi
| Address | Dist | Beds/Ba | Sqft | Sold | Price | $/sf | Match |
|---|---|---|---|---|---|---|---|
| 515 Fisher Rd | 0.21mi | 3/2.0 (-1) | 1,378 (-4%) | 19mo | $504,000 | $366 | 63 |
| 333 Fisher Rd | 0.32mi | 3/1.0 (-1) | 1,462 (+2%) | 12mo | $405,000 | $277 | 62 |
| 95 Eastabrook Ave | 0.50mi | 3/2.0 (-1) | 1,354 (-5%) | 5mo | $390,000 | $288 | 59 |
| 43 Montview Cir | 0.43mi | 3/2.0 (-1) | 1,342 (-6%) | 14mo | $419,000 | $312 | 53 |
| 129 Resada Dr | 0.28mi | 3/2.0 (-1) | 1,284 (-10%) | 15mo | $422,800 | $329 | 52 |
| 85 Eastabrook Ave | 0.50mi | 3/2.0 (-1) | 1,354 (-5%) | 13mo | $380,000 | $281 | 52 |
| 158 Fisher Rd | 0.44mi | 3/2.0 (-1) | 1,620 (+13%) | 10mo | $495,000 | $306 | 44 |
| 477 Probart St | 0.56mi | 3/3.0 (-1) | 1,585 (+11%) | 3mo | $570,000 | $360 | 44 |
| 609 Probart St | 0.59mi | 3/1.5 (-1) | 1,215 (-15%) | 7mo | $467,000 | $384 | 35 |
Match score weights: distance 35% · size 25% · config 20% · recency 20%. Top-matched comps best support the ARV.
Projected returns pro-forma
-3.0% appreciation · 3.0% rent growth · sell at horizon
- IRR
- -1.9%
- Equity multiple
- 0.93×
- Total profit
- $-5,133
- Equity at exit
- $37,276
- IRR
- 7.7%
- Equity multiple
- 1.58×
- Total profit
- $40,776
- Equity at exit
- $21,615
Cash invested: $70,000 (down + closing). Projections, not guarantees.
Landlord ↔ Tenant lean methodology
- Overall (STATE)
- 85 Strongly Landlord-Friendly
- State North Carolina
- 85 Strongly Landlord-Friendly · R+3
- County
- — inherits STATE
- City
- — inherits STATE
ZIP-level market 28712
- Active inventory
- 351
- Price-to-rent
- 8.1×
Monthly cashflow live
- Estimated rent
- $2,583 medium interval (Pro) →
- Mortgage (P&I)
- −$1,311
- Tax from tax record
- −$68 /mo · $817/yr
- Insurance
- −$104
- HOA
- −$0
- Vacancy / Maint / Mgmt
- −$542
- Net cashflow
- $557
Break-even live
UW: 25.0% down · 7.5% · 30yr · 1.5% tax · 5.0% vac · 8.0% maint · 8.0% mgmt
Financing live
Cash to close
- Down payment
- $62,500
- Closing costs
- $7,500
- Reserves months
- —
- Total cash needed
- —
Loan-product check · same deal, 3 products live
Conventional
25% down · 7.5% · 30yr
- Down + closing
- —
- Monthly P&I
- —
- Monthly cashflow
- —
- DSCR
- —
- Eligible?
- —
Personal DTI + credit; lowest rate.
DSCR
20% down · 8.5% · 30yr
- Down + closing
- —
- Monthly P&I
- —
- Monthly cashflow
- —
- DSCR
- —
- Eligible?
- —
No personal income docs; deal must DSCR.
Hard money
10% down · 12.0% · 12mo
- Down + closing
- —
- Monthly P&I
- —
- Monthly cashflow
- —
- DSCR
- —
- Eligible?
- —
Short-term bridge; refi at stabilization.
Listing history 16 events
-
2026-06-18days on market $250,000 Active 190 DOM
-
2026-06-17days on market $250,000 Active 189 DOM
-
2026-06-16days on market $250,000 Active 188 DOM
-
2026-06-15days on market $250,000 Active 187 DOM
-
2026-06-14days on market $250,000 Active 185 DOM
-
2026-06-10days on market $250,000 Active 182 DOM
-
2026-06-09days on market $250,000 Active 181 DOM
-
2026-06-08days on market $250,000 Active 180 DOM
-
2026-06-07days on market $250,000 Active 179 DOM
-
2026-06-05days on market $250,000 Active 176 DOM
-
2026-06-03days on market $250,000 Active 175 DOM
-
2026-06-02days on market $250,000 Active 174 DOM
-
2026-06-01days on market $250,000 Active 173 DOM
-
2026-05-31days on market $250,000 Active 172 DOM
-
2026-05-30days on market $250,000 Active 171 DOM
-
2025-12-10$250,000 Active
ⓘ Source: listings_history table (triggers on properties + properties_extension) + one-shot
backfill from property_details.listing_events for pre-trigger history.
Tax reassessment forecast NC · Resets to sale price
- Current annual tax
- $817 · $68/mo
- Projected year-2 tax
- $2,050 · $171/mo
- Expected delta
- +$1,233/yr (+$103/mo · 150.8%)
ⓘ Screening estimate from a state-policy table — verify with the county assessor before closing.
Climate risk First Street
- Flood 1/10 Low FEMA zone X (unshaded) · 0% chance over 30 yrs
- Wildfire 2/10 Low
- Heat 3/10 Moderate 7 d/yr ≥97°F today · 20 d/yr by 30 yrs out
- Wind 2/10 Low
- Air quality 3/10 Moderate 3 unhealthy d/yr today · 3 by 30 yrs out
Nearby sold comps map
Loading sold comps map…
Walkable amenities ~0.75 mi
Loading nearby amenities…
Taxation est. · year 1
- Rental income
- $30,995
- − Mortgage interest
- −$14,004
- − Property taxes
- −$817
- − Insurance
- −$1,250
- − Repairs & maintenance
- −$2,480
- − Management
- −$2,480
- − Depreciation
- −$7,273
- Taxable income
- $2,692
- Est. tax owed @ 24.0%
- −$646
- After-tax cash flow
- $6,040/yr
For passive investors: Depreciation is non-cash, so a rental often shows a tax loss while cash-flowing — sheltering income. Rental losses are passive: they offset passive income freely, and up to $25,000/yr can offset ordinary (W-2) income if you actively participate and your MAGI is under $100k (phasing out to $0 by $150k); unused losses carry forward. On sale, claimed depreciation is recaptured at up to 25%, and gains may owe capital-gains tax (a 1031 exchange can defer both). Figures are a year-1 estimate at your 24.0% rate — not tax advice; consult a CPA.
Schools (NCES district)
- District
- Transylvania County Schools
- NCES district ID
- 3704530
- Math proficiency
- 44% ▼ -1.00%
- Reading proficiency
- 50% ▼ -1.00%
- Median HH income
- $42,365
- Composite
- 39.55/100
- National rank
- #3938
- State rank
- #79 of 178 in NC
Livability — Brevard
- Score
- 64/100
- State rank
- #353
- US rank
- #13958
Category grades
Schools grade is shown separately in the Schools card above.
Census & demographics
- County
- Transylvania County · 19,977 people
- City population
- 19,977
- Metro
- Brevard, NC
- Population (ZIP)
- 19,977
- Household income
- $63,045
- Rent vs Own
- Severe rent burden
- 852.0
Population outlook (Transylvania County) Hauer SSP2
- Today (2025)
- 33,142 people
- By 2030
- 32,987 · -0.5%
- By 2040
- 32,159 · -3.0%
- By 2050
- 30,937 · -6.7%
- By 2075
- 27,778 · -16.2%
- By 2100
- 24,136 · -27.2%
Race, ethnicity, and origin ACS 2023
- Neighborhood character
- Predominantly White (89%)
- Race & ethnicity
- White 89% Black 5% Two or more races 5% Hispanic / Latino 3%
- Common ancestry
- Slovak 5% Serbian 4% Lithuanian 3%
- Foreign-born
- 2% · Canada
- Languages at home
- 99% English-only · Spanish 1%
Political lean MEDSL · Transylvania
- 2024 margin
- R (+12.2) · D 43.3% · R 55.5% · Other 1.2%
- 2008→2024 swing
- +0.4pp no change · 2008: -12.6pp · 2024: -12.2pp
- All cycles
- 2024: R+12.2 2020: R+15.7 2016: R+22.5 2012: R+16.9 2008: R+12.6
Not yet ingested
- Civics
- —
Market trends
- HPI YoY
- ▼ -197.94%
- Current HPI
- 217.8358
- Rent YoY
- —
- Metro
- Brevard, NC
- State GDP YoY
- ▲ 3.28%
- F500 in state
- 26
Industry mix (Fortune 500 HQ in NC)
| Industry | F500 HQs | Revenue |
|---|---|---|
| Financial Services | 2 | $213B |
|
||
| Retail | 2 | $95B |
|
||
| Industrial Conglomerate | 1 | $38B |
|
||
| Metals / Steel | 1 | $35B |
|
||
| Utilities | 1 | $30B |
|
||
| Industrial Machinery | 1 | $19B |
|
||
Price history
1 event — show timeline
- 2025-12-10 Listed $250,000 CANOPYMLS as Distributed by MLS Grid
Property tax history
+6.3%/yrLatest (2025): $817 · -2.0% YoY. Source: county tax records.
Cash-flow waterfall
monthlySold comps — $/sqft
last 12 mo · ≤1 miLoading sold comps…