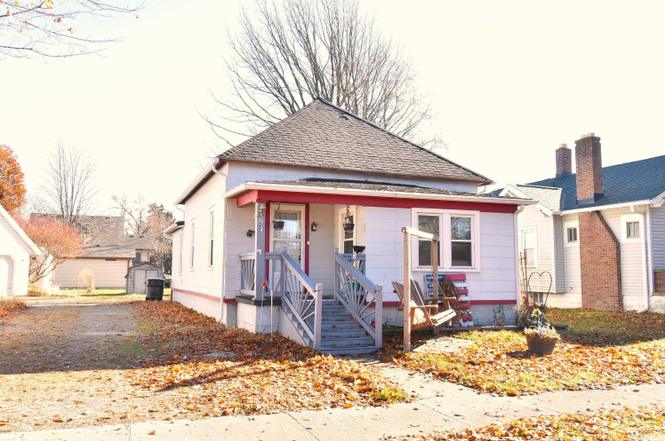
307 N Madison Ave · Fowler, IN
Flood risk 6/10 · Moderate
- FEMA flood zone
- X (unshaded)
- Chance of flooding over 30 yrs
- 0.72%
- Est. flood insurance / yr
- $473 – $860
Fire risk 1/10 · Minimal
- Est. fire insurance / yr
- $717 – $1,331
Heat risk 3/10 · Minor
- Hot days now (above 101°F)
- 7 days/yr
- Hot days in 30 yrs
- 17 days/yr
Wind risk 2/10 · Minimal
- Chance of severe wind over 30 yrs
- 0.0%
Air-quality risk 2/10 · Minimal
- Unhealthy air days now
- 1 days/yr
- Unhealthy air days in 30 yrs
- 2 days/yr
Risk factors via First Street. Map © Google.
Why this score? — see what drove the C grade
The composite is a weighted blend of 9 inputs, each scored 0–100. Each bar is that input's sub-score; the figure is the points it added to the 100-point composite (weight × sub-score).
- Cash flow +18.7/30.0
- ARV discount +15.0/15.0
- DSCR +5.9/10.0
- 1% rule +3.9/10.0
- Schools +3.5/10.0
- Livability +3.5/5.0
- Appreciation +2.8/10.0
- Rent growth +2.5/5.0
- Condition / age +2.5/5.0
$87,500
🖨 Deal sheet 📄 Offer letter ✓ Due diligence
Listing remarks
From one room to the next, this home gives it's owner a fantastic layout, a little bit of charm from front to back, and outdoor spaces to extend your living & entertaining areas. Lots of tasteful updates can be noticed as you tour the home. Situated in a great neighborhood this charming ranch is just down the street from the growing business district that Fowler has to offer. The great room can be configured to your preference from one great living space to splitting it up into a dining, living, and even an office space! It's up to you. We invite you to come check it out and see for yourself all the property has to offer. This home is selling As-Is and welcomes inspections.
Key facts
- Tasteful updates
- Fantastic layout
- Great room
Tags
Property features AI
Exterior
- Parking: Off-street parking (gravel)
- Security: Smoke detector(s)
- Utilities: Public water; Public sewer
- Home design: Single-family residence (site-built); Single story; Entry level and facing direction not specified
- Construction: Asbestos exterior materials; Block foundation; Asphalt and metal roof; Built area above grade: 914 (unit not stated); Basement: partial crawl space with sump pump
- Exterior features: Covered porch; Patio; Shed(s); Level lot
Interior
- Kitchen: Refrigerator; Electric range
- Bedrooms: 7 total rooms (bedroom count not specified)
- Flooring: Carpet
- Bathrooms: 1 full bathroom (main level)
- Heating & cooling: Central air; Ceiling fan(s); Natural gas forced air heating
- Interior features: Ceiling fans; Laminate countertops; 1 fireplace (no special features listed)
- Laundry & utility: Washer hookup (main level); Electric dryer hookup (main level); Water softener (owned); Gas water heater; Water heater
Neighborhood map
What this means for you Summary
Snapshot
- This is a 2-bed/1.0-bath single-family listed at $88k.
Deal economics
- At list price, monthly cash flow is $86 ($1k/yr) — positive.
- The deal already cash-flows at list — no discount required.
- To meet the 1% rule (rent ≥ 1% of price), the offer needs to be $78k (10.9% below list).
- Recommended offer: $77k (12.0% below list) — sets the bar for market timing.
- Cap rate 7.5% vs local median 2.7% in Fowler — top-decile yield for the area; either an underpriced asset or a hidden risk that comps aren't pricing in. Stress-test before assuming the spread holds.
Location & tenants
- Location reads 69/100 on livability (#205 in IN) — a middle-class / working-renter tenant base. Strengths: crime A+, cost of living A+, housing A+; Watch: employment D+, amenities F, commute F.
- Benton Community School Corporation (rural): math 38% / reading 43% proficiency, ranked #134 of 301 in IN (top 44%) — families likely to look elsewhere, expect single-tenant / working-renter base with shorter leases.
- Zoned schools: Prairie Crossing Elementary School (math 46% / reading 37%, grade F, #478 of 994 statewide, top 49%, 561 students, 65% FRL); Benton Central Jr-Sr High School (math 31% / reading 53%, grade F, #197 of 369 statewide, top 57%, 790 students, 48% FRL) — zoned schools average 57% FRL vs 38% district-wide (18 pts higher); higher-poverty schools than district average — tighter screening recommended.
- Market conditions: 32 active listings in the ZIP.
Forward outlook
- Local home prices are declining (-3.0%/yr); year-one equity from $605 of loan paydown is wiped out by about $3k of value loss. Plan a longer hold.
- Benton County population projected at -13% by 2050 — secular population decline; favor cash flow + early exit over multi-decade hold.
Negotiation context
- It's been on market 173 days — a 12% lower offer ($77k) is reasonable based on typical stale-listing flexibility.
- 2 sale attempts with the ask held roughly flat each time — persistent listings suggest the price (not the market) is what's stuck; bring a comps-based counter.
Risks & watch-outs
- Watch-outs: built in 1938 — expect roof / HVAC / electrical / plumbing capex.
- Climate carrying-cost: major flood risk — expect insurance premiums to compound above CPI over the hold.
Questions for the listing agent
- It's been on market 173 days. Have you received any prior offers? Is the seller open to a 12% concession, seller financing, or rate buy-down credit?
- Built in 1938 — when were the roof, HVAC, electrical panel, plumbing, and water heater last replaced?
- Why hasn't it sold? Are there any deal-killer items the seller is aware of (foundation, flood, title, zoning, code violations)?
- Is there a deadline driving the sale (1031 exchange, divorce, estate, relocation)? That informs how much negotiation room exists.
- Schools are F-rated, which usually means shorter tenancies and higher turnover. Who's the typical renter profile here, and what's been the actual vacancy rate?
- What's the average days-on-market for RENTAL listings here right now (not sales)? A rising rental-DOM trend means longer vacancies and softer asking-rent achievability than the comps imply.
- What's the recent tenant-quality profile in this submarket — average credit score on applications, eviction rate, late-payment / NSF rate, and stable-employment percentage? A property-management company in the area should have these aggregated.
- How much new for-sale + rental construction is in the pipeline within 1–3 miles? Heavy new supply typically softens prices + rents 12–24 months out; constrained supply supports both.
Investment metrics
- 1% rule
- 0.89% ✗
- Cap rate
- 7.48%
- Cash-on-cash
- 4.23%
- DSCR
- 1.19
- GRM
- 9.4
CMA / ARV
- ARV (on-the-fly)
- $125,218
- Comps found
- 10
Show comp detail 10 sales within ~0.75 mi
| Address | Dist | Beds/Ba | Sqft | Sold | Price | $/sf | Match |
|---|---|---|---|---|---|---|---|
| 307 N Madison Ave | 0.00mi | 2/1.0 | 914 (0%) | 0mo | $87,500 | $96 | 100 |
| 202 N Van Buren Ave | 0.09mi | 2/1.0 | 912 (-0%) | 2mo | $55,000 | $60 | 94 |
| 304 N Madison Ave | 0.03mi | 2/1.0 | 888 (-3%) | 22mo | $115,000 | $130 | 76 |
| 206 S Van Buren Ave | 0.30mi | 2/1.0 | 1,008 (+10%) | 6mo | $75,000 | $74 | 64 |
| 203 E Elm St | 0.24mi | 2/1.0 | 864 (-6%) | 20mo | $118,000 | $137 | 63 |
| 503 E 8th St | 0.39mi | 2/1.0 | 800 (-12%) | 1mo | $120,000 | $150 | 60 |
| 606 E Main St | 0.25mi | 3/1.5 (+1) | 1,032 (+13%) | 8mo | $168,500 | $163 | 53 |
| 806 E 7th St | 0.48mi | 2/1.0 | 975 (+7%) | 24mo | $148,000 | $152 | 47 |
| 1108 E 6th St | 0.63mi | 2/1.0 | 825 (-10%) | 23mo | $93,000 | $113 | 35 |
| 202 N Park Ave | 0.62mi | 3/1.0 (+1) | 1,000 (+9%) | 20mo | $140,000 | $140 | 34 |
Match score weights: distance 35% · size 25% · config 20% · recency 20%. Top-matched comps best support the ARV.
Projected returns pro-forma
-3.0% appreciation · 3.0% rent growth · sell at horizon
- IRR
- -9.7%
- Equity multiple
- 0.64×
- Total profit
- $-8,715
- Equity at exit
- $13,047
- IRR
- -0.4%
- Equity multiple
- 0.97×
- Total profit
- $-650
- Equity at exit
- $7,565
Cash invested: $24,500 (down + closing). Projections, not guarantees.
Landlord ↔ Tenant lean methodology
- Overall (STATE)
- 90 Strongly Landlord-Friendly
- State Indiana
- 90 Strongly Landlord-Friendly · R+11
- County
- — inherits STATE
- City
- — inherits STATE
ZIP-level market 47944
- Home prices YoY
- -1.3%
- Active inventory
- 32
- Price-to-rent
- 9.4×
Monthly cashflow live
- Estimated rent
- $779 medium interval (Pro) →
- Mortgage (P&I)
- −$459
- Tax from tax record
- −$34 /mo · $408/yr
- Insurance
- −$36
- HOA
- −$0
- Vacancy / Maint / Mgmt
- −$164
- Net cashflow
- $86
Break-even live
UW: 25.0% down · 7.5% · 30yr · 1.5% tax · 5.0% vac · 8.0% maint · 8.0% mgmt
Financing live
Cash to close
- Down payment
- $21,875
- Closing costs
- $2,625
- Reserves months
- —
- Total cash needed
- —
Loan-product check · same deal, 3 products live
Conventional
25% down · 7.5% · 30yr
- Down + closing
- —
- Monthly P&I
- —
- Monthly cashflow
- —
- DSCR
- —
- Eligible?
- —
Personal DTI + credit; lowest rate.
DSCR
20% down · 8.5% · 30yr
- Down + closing
- —
- Monthly P&I
- —
- Monthly cashflow
- —
- DSCR
- —
- Eligible?
- —
No personal income docs; deal must DSCR.
Hard money
10% down · 12.0% · 12mo
- Down + closing
- —
- Monthly P&I
- —
- Monthly cashflow
- —
- DSCR
- —
- Eligible?
- —
Short-term bridge; refi at stabilization.
Listing history 9 events
-
2026-05-19status Pending
-
2026-04-23historical Active Under Contract
-
2026-04-02price $87,500
-
2025-11-27$89,900 Active
-
2025-11-10price $90,900
-
2025-10-05price $94,900
-
2025-08-25price $99,900
-
2025-07-28price $105,000
-
2025-06-17$110,000 Active
ⓘ Source: listings_history table (triggers on properties + properties_extension) + one-shot
backfill from property_details.listing_events for pre-trigger history.
Tax reassessment forecast IN · Partial reset (capped growth)
- Current annual tax
- $408 · $34/mo
- Projected year-2 tax
- $576 · $48/mo
- Expected delta
- +$168/yr (+$14/mo · 41.0%)
ⓘ Screening estimate from a state-policy table — verify with the county assessor before closing.
Climate risk First Street
- Flood 6/10 Major FEMA zone X (unshaded) · 72% chance over 30 yrs
- Wildfire 1/10 Low
- Heat 3/10 Moderate 7 d/yr ≥101°F today · 17 d/yr by 30 yrs out
- Wind 2/10 Low 0% chance of damaging wind over 30 yrs
- Air quality 2/10 Low 1 unhealthy d/yr today · 2 by 30 yrs out
Nearby sold comps map
Loading sold comps map…
Walkable amenities ~0.75 mi
Loading nearby amenities…
Taxation est. · year 1
- Rental income
- $9,352
- − Mortgage interest
- −$4,901
- − Property taxes
- −$408
- − Insurance
- −$438
- − Repairs & maintenance
- −$748
- − Management
- −$748
- − Depreciation
- −$2,545
- Taxable loss
- −$437
- Est. tax savings @ 24.0%
- +$105
- After-tax cash flow
- $1,141/yr
For passive investors: Depreciation is non-cash, so a rental often shows a tax loss while cash-flowing — sheltering income. Rental losses are passive: they offset passive income freely, and up to $25,000/yr can offset ordinary (W-2) income if you actively participate and your MAGI is under $100k (phasing out to $0 by $150k); unused losses carry forward. On sale, claimed depreciation is recaptured at up to 25%, and gains may owe capital-gains tax (a 1031 exchange can defer both). Figures are a year-1 estimate at your 24.0% rate — not tax advice; consult a CPA.
Schools (NCES district)
- District
- Benton Community School Corporation
- NCES district ID
- 1800480
- Math proficiency
- 38% ▼ -7.00%
- Reading proficiency
- 43% ▼ -7.00%
- Median HH income
- $50,073
- Composite
- 34.9/100
- National rank
- #5076
- State rank
- #134 of 301 in IN
Livability — Fowler
- Score
- 69/100
- State rank
- #205
- US rank
- #9047
Category grades
Schools grade is shown separately in the Schools card above.
Census & demographics
- Census place
- Fowler, IN
- Population (ZIP)
- 3,492
Population outlook (Benton County) Hauer SSP2
- Today (2025)
- 8,404 people
- By 2030
- 8,234 · -2.0%
- By 2040
- 7,832 · -6.8%
- By 2050
- 7,337 · -12.7%
- By 2075
- 6,436 · -23.4%
- By 2100
- 5,139 · -38.9%
Race, ethnicity, and origin ACS 2023
- Neighborhood character
- Predominantly White (96%)
- Race & ethnicity
- White 96% Hispanic / Latino 3% Two or more races 3%
- Common ancestry
- Lithuanian 4% Iranian 2% Romanian 1%
- Foreign-born
- 0%
- Languages at home
- 98% English-only · Spanish 2%
Political lean MEDSL · Benton
- 2024 margin
- Solid R (+47.1) · D 25.5% · R 72.7% · Other 1.8%
- 2008→2024 swing
- -30.9pp toward R · 2008: -16.3pp · 2024: -47.1pp
- All cycles
- 2024: R+47.1 2020: R+48.6 2016: R+47.0 2012: R+32.7 2008: R+16.3
Not yet ingested
- Civics
- —
Market trends
- HPI YoY
- ▼ -4.35%
- Current HPI
- 325.4116
- Rent YoY
- —
- Metro
- —
- State GDP YoY
- ▲ 2.90%
- F500 in state
- 18
Industry mix (Fortune 500 HQ in IN)
| Industry | F500 HQs | Revenue |
|---|---|---|
| Industrial Machinery | 2 | $37B |
|
||
| Healthcare | 1 | $177B |
|
||
| Pharmaceuticals | 1 | $45B |
|
||
| Metals / Steel | 1 | $18B |
|
||
| Agriculture | 1 | $17B |
|
||
| Packaging | 1 | $12B |
|
||
Price history
-20.5% since first listed9 events — show timeline
- 2026-05-19 Pending — IRMLS
- 2026-04-23 Contingent — IRMLS
- 2026-04-02 Price Changed $87,500 IRMLS
- 2025-11-27 Listed $89,900 IRMLS
- 2025-11-10 Price Changed $90,900 IRMLS
- 2025-10-05 Price Changed $94,900 IRMLS
- 2025-08-25 Price Changed $99,900 IRMLS
- 2025-07-28 Price Changed $105,000 IRMLS
- 2025-06-17 Listed $110,000 IRMLS
Property tax history
+10.6%/yrLatest (2020): $408 · +8.2% YoY. Source: county tax records.
Cash-flow waterfall
monthlySold comps — $/sqft
last 12 mo · ≤1 miLoading sold comps…