8327 SW 79th Cir · On Top of the World, FL
Flood risk 4/10 · Minor
- FEMA flood zone
- X (unshaded)
- Chance of flooding over 30 yrs
- 0.24%
- Est. flood insurance / yr
- $507 – $1,088
Fire risk 4/10 · Minor
- Est. fire insurance / yr
- $947 – $1,759
Heat risk 9/10 · Severe
- Hot days now (above 107°F)
- 7 days/yr
- Hot days in 30 yrs
- 23 days/yr
Wind risk 9/10 · Severe
- Chance of severe wind over 30 yrs
- 99.0%
Air-quality risk 3/10 · Minor
- Unhealthy air days now
- 3 days/yr
- Unhealthy air days in 30 yrs
- 3 days/yr
Risk factors via First Street. Map © Google.
Why this score? — see what drove the D- grade
The composite is a weighted blend of 9 inputs, each scored 0–100. Each bar is that input's sub-score; the figure is the points it added to the 100-point composite (weight × sub-score).
- ARV discount +15.0/15.0
- Cash flow +8.1/30.0
- Schools +3.6/10.0
- 1% rule +3.2/10.0
- Livability +2.5/5.0
- Condition / age +2.5/5.0
- DSCR +2.2/10.0
- Rent growth +1.9/5.0
- Appreciation +0.0/10.0
$239,875
🖨 Deal sheet 📄 Offer letter ✓ Due diligence
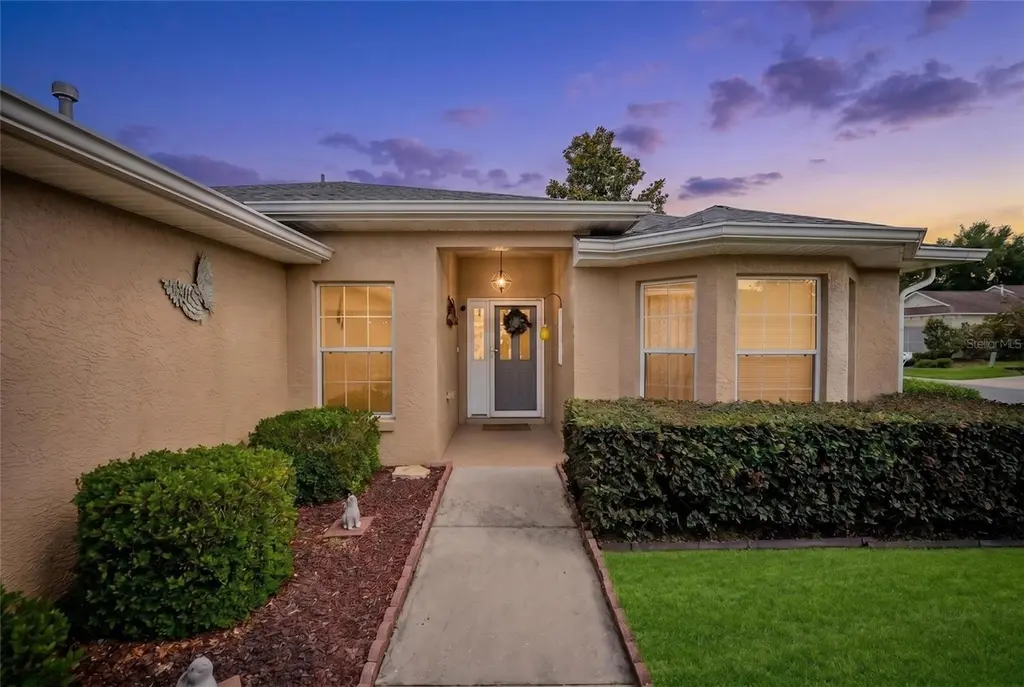
Listing remarks
This move-in-ready Verbena model is located in the desirable 55+ Indigo East Phase 1 community within On Top of the World. This well-maintained 3-bedroom, 2-bathroom home features an open floor plan designed for both comfortable living and effortless entertaining. The spacious Great Room showcases durable vinyl flooring and opens seamlessly to a screened-in lanai, overlooking a private backyard perfect for relaxing. The primary suite serves as a private retreat with elegant tray ceilings, dual sinks with granite countertops, a walk-in shower, and a luxurious jet tub. The functional eat-in kitchen is equipped with quartz countertops, ample cabinetry, and a convenient breakfast bar. A split f
Key facts
- Quartz countertops
- Private backyard
- Screened-in lanai
Tags
Property features AI
Finance
- Other: Homestead exempt; Lot size approximately 0.2 acres (about 809 m²)
- Financial info: Lease restrictions apply
- HOA & community: Homeowners association required; monthly fee $241.33; Association approval required; Association name: Lori Sands; Senior community; Pets allowed
Exterior
- Parking: Attached 2-car garage
- Utilities: Public water; Public sewer; Electricity connected; Natural gas connected; Water connected; Sewer connected; Cable available; Phone available; Underground utilities
- Home design: Single-family residence (PUD); One story; Northwest facing; Entry level: One
- Construction: Block and stucco construction; Shingle roof; Slab foundation; Built as builder model 'Verbena'
- Exterior features: Irrigation equipment; Asphalt road access; Lot dimensions 79 x 111
Interior
- Kitchen: Dishwasher; Microwave; Range; Refrigerator
- Bedrooms: 3 bedrooms
- Flooring: Ceramic tile
- Bathrooms: 2 full bathrooms
- Heating & cooling: Natural gas heating; Central air conditioning
- Interior features: Cathedral ceilings; Ceiling fans; High ceilings; Kitchen/family room combo; Open floorplan; Solid surface counters; Tray ceilings; Walk-in closets; Window treatments
- Laundry & utility: Washer hookup; Gas dryer hookup; Laundry room; Gas water heater
Neighborhood map
What this means for you Summary
Snapshot
- This is a 3-bed/2.0-bath single-family listed at $240k.
Deal economics
- At list price, monthly cash flow is $-231 ($-3k/yr) — negative.
- To cash-flow at today's rent, offer at most $199k (17.0% below list).
- To meet the 1% rule (rent ≥ 1% of price), the offer needs to be $198k (17.6% below list).
- Recommended offer: $198k (17.6% below list) — sets the bar for 1% rule.
- Cap rate 5.1% vs local median 2.9% in On Top of the World — top-decile yield for the area; either an underpriced asset or a hidden risk that comps aren't pricing in. Stress-test before assuming the spread holds.
Location & tenants
- Location reads: area grade D — affects rentability + tenant quality, not the cash-flow math above.
- Marion (rural): math 42% / reading 43% proficiency, ranked #61 of 73 in FL (top 84%) — families likely to look elsewhere, expect single-tenant / working-renter base with shorter leases; 61% free/reduced lunch — lower-income household profile, screen leases tightly.
- Zoned schools: West Port High School (math 34% / reading 52%, grade F, #255 of 667 statewide, top 39%, 2,906 students, 52% FRL).
- Market conditions: Rents soft (-2.6%/yr); 852 active listings in the ZIP; 24 comparable units currently listed for rent nearby; rentals at typical pace (median 21d on market — plan ~3-4 weeks tenant-placement turnaround); 7,071 units permitted in Marion County in 2024 (534 in 5+ unit buildings).
- This rent runs 36% of the median local income ($66k/yr) — at the standard rent-burdened threshold; future hikes will face affordability resistance.
Forward outlook
- Local home prices are declining (-3.0%/yr); year-one equity from $2k of loan paydown is wiped out by about $7k of value loss. Plan a longer hold.
- Marion County population projected at +13% by 2050 — modest demand growth; plan on rents tracking national, not racing it.
Negotiation context
- It's been on market 40 days — a 3% lower offer ($233k) is reasonable based on typical stale-listing flexibility.
- 5 sale attempts since 10y ago with the ask held roughly flat each time — persistent listings suggest the price (not the market) is what's stuck; bring a comps-based counter.
- Current owner paid $125k; list at $240k implies a 92% gain — meaningful room to come down on a strong offer.
Risks & watch-outs
- Climate carrying-cost: severe wind risk, 99% chance of damaging wind over 30y; extreme-heat days projected 7→23/yr by 2055 (HVAC capex compounding) — expect insurance premiums to compound above CPI over the hold.
Questions for the listing agent
- What do current leases actually rent for vs. the listed asking? Can we see a recent rent roll and the last 12 months of T-12 income?
- It's been on market 40 days. Have you received any prior offers? Is the seller open to a 18% concession, seller financing, or rate buy-down credit?
- What does the HOA fee cover, when was the last increase, and are there any pending special assessments or reserve-fund shortfalls?
- Is there a deadline driving the sale (1031 exchange, divorce, estate, relocation)? That informs how much negotiation room exists.
- The area grade is low — what's the realistic commute time and amenity access for the typical tenant pool here? Any planned neighborhood developments (good or bad) we should know about?
- What's the average days-on-market for RENTAL listings here right now (not sales)? A rising rental-DOM trend means longer vacancies and softer asking-rent achievability than the comps imply.
- What's the recent tenant-quality profile in this submarket — average credit score on applications, eviction rate, late-payment / NSF rate, and stable-employment percentage? A property-management company in the area should have these aggregated.
- How much new for-sale + rental construction is in the pipeline within 1–3 miles? Heavy new supply typically softens prices + rents 12–24 months out; constrained supply supports both.
Investment metrics
- 1% rule
- 0.82% ✗
- Cap rate
- 5.14%
- Cash-on-cash
- -4.13%
- DSCR
- 0.82
- GRM
- 10.1
CMA / ARV
- ARV (median comp)
- $307,644
- List price
- $239,875
- Delta
- -22.03%
- Verdict
- UNDERPRICED
- Comps
- 20 within 1.0 mi
Show comp detail 12 sales within ~0.75 mi
| Address | Dist | Beds/Ba | Sqft | Sold | Price | $/sf | Match |
|---|---|---|---|---|---|---|---|
| 8045 SW 78th Terrace Rd | 0.30mi | 3/2.0 | 1,573 (-0%) | 1mo | $260,000 | $165 | 85 |
| 8101 SW 78th Terrace Rd | 0.32mi | 3/2.0 | 1,576 (0%) | 9mo | $210,000 | $133 | 78 |
| 7796 SW 80th Place Rd | 0.34mi | 3/2.0 | 1,499 (-5%) | 1mo | $242,000 | $161 | 75 |
| 8319 SW 82nd Cir | 0.21mi | 3/2.0 | 1,717 (+9%) | 7mo | $305,000 | $178 | 70 |
| 7838 SW 80th Place Rd | 0.34mi | 2/2.0 (-1) | 1,499 (-5%) | 6mo | $250,000 | $167 | 66 |
| 7776 SW 80th Place Rd | 0.34mi | 2/2.0 (-1) | 1,499 (-5%) | 10mo | $263,000 | $175 | 63 |
| 8405 SW 82nd Loop | 0.38mi | 2/2.0 (-1) | 1,564 (-1%) | 16mo | $286,000 | $183 | 63 |
| 8822 SW 82nd Court Rd | 0.53mi | 3/2.0 | 1,701 (+8%) | 2mo | $300,000 | $176 | 61 |
| 7765 SW 86th Loop | 0.40mi | 2/2.0 (-1) | 1,466 (-7%) | 10mo | $234,432 | $160 | 56 |
| 8615 SW 82nd Ter | 0.42mi | 3/2.0 | 1,723 (+9%) | 13mo | $269,900 | $157 | 54 |
| 7585 SW 79th Pl | 0.61mi | 3/2.0 | 1,498 (-5%) | 12mo | $285,000 | $190 | 53 |
| 8446 SW 86th Ter | 0.64mi | 3/2.0 | 1,734 (+10%) | 7mo | $240,000 | $138 | 47 |
Match score weights: distance 35% · size 25% · config 20% · recency 20%. Top-matched comps best support the ARV.
Projected returns pro-forma
-3.0% appreciation · 0.0% rent growth · sell at horizon
- IRR
- -26.9%
- Equity multiple
- 0.12×
- Total profit
- $-59,272
- Equity at exit
- $35,766
- IRR
- -41.7%
- Equity multiple
- -0.38×
- Total profit
- $-92,495
- Equity at exit
- $20,740
Cash invested: $67,165 (down + closing). Projections, not guarantees.
Landlord ↔ Tenant lean methodology
- Overall (STATE)
- 87 Strongly Landlord-Friendly
- State Florida
- 87 Strongly Landlord-Friendly · R+3
- County
- — inherits STATE
- City
- — inherits STATE
ZIP-level market 34476
- Rents YoY
- -2.6%
- Active inventory
- 852
- Price-to-rent
- 10.1×
Monthly cashflow live
- Estimated rent
- $1,976 high interval (Pro) →
- Mortgage (P&I)
- −$1,258
- Tax from tax record
- −$193 /mo · $2,321/yr
- Insurance
- −$100
- HOA
- −$241
- Vacancy / Maint / Mgmt
- −$415
- Net cashflow
- $-231
Break-even live
UW: 25.0% down · 7.5% · 30yr · 1.5% tax · 5.0% vac · 8.0% maint · 8.0% mgmt
Financing live
Cash to close
- Down payment
- $59,969
- Closing costs
- $7,196
- Reserves months
- —
- Total cash needed
- —
Loan-product check · same deal, 3 products live
Conventional
25% down · 7.5% · 30yr
- Down + closing
- —
- Monthly P&I
- —
- Monthly cashflow
- —
- DSCR
- —
- Eligible?
- —
Personal DTI + credit; lowest rate.
DSCR
20% down · 8.5% · 30yr
- Down + closing
- —
- Monthly P&I
- —
- Monthly cashflow
- —
- DSCR
- —
- Eligible?
- —
No personal income docs; deal must DSCR.
Hard money
10% down · 12.0% · 12mo
- Down + closing
- —
- Monthly P&I
- —
- Monthly cashflow
- —
- DSCR
- —
- Eligible?
- —
Short-term bridge; refi at stabilization.
Rent comps 24 comps
| Address | Beds | Baths | Sqft | Rent | $/sqft | DOM | Units | Dist |
|---|---|---|---|---|---|---|---|---|
| 7928 SW 80th Place Rd Ocala, FL | 3.0 | 2.0 | 1576 | $1,900 | $1.21 | 21d | 1 | 0.30mi |
| 8701 SW 83rd Cir Ocala, FL | 3.0 | 2.0 | 1726 | $2,200 | $1.27 | 13d | 1 | 0.36mi |
| 7754 SW 86th Loop Ocala, FL | 2.0 | 2.0 | 1460 | $1,800 | $1.23 | 21d | 1 | 0.44mi |
| 8714 SW 83rd Loop Ocala, FL | 2.0 | 2.0 | 1658 | $1,900 | $1.15 | 13d | 1 | 0.60mi |
| 8431 SW 90th Ln Ocala, FL | 2.0 | 2.0 | 1366 | $1,395 | $1.02 | 21d | 1 | 0.84mi |
| 8430 SW 90th Ln Unit D Ocala, FL | 2.0 | 2.0 | 1454 | $1,600 | $1.10 | 21d | 1 | 0.87mi |
| 9257 SW 82nd Ter Unit H Ocala, FL | 2.0 | 2.0 | 1748 | $1,600 | $0.92 | 21d | 1 | 0.95mi |
| 8710 SW 71st Ave Ocala, FL | 1.0–3.0 | 1.0–2.5 | 1312 | $2,270 | $1.73 | 13d | 27 | 0.99mi |
| 9013 SW 79th Ln Ocala, FL | 2.0 | 2.0 | 2118 | $2,500 | $1.18 | 21d | 1 | 1.06mi |
| 7978 SW 90th Ter Ocala, FL | 2.0 | 2.0 | 1226 | $1,875 | $1.53 | 13d | 1 | 1.14mi |
| 8666 SW 92nd Ln Unit F Ocala, FL | 2.0 | 2.0 | 1748 | $2,000 | $1.14 | 21d | 1 | 1.17mi |
| 7274 SW 89th Ave Ocala, FL | 2.0 | 2.0 | 1467 | $2,200 | $1.50 | 13d | 1 | 1.22mi |
| 8665 SW 94th St Unit C Ocala, FL | 2.0 | 2.0 | 1589 | $1,600 | $1.01 | 21d | 1 | 1.23mi |
| 9013 SW 91st Cir Ocala, FL | 2.0 | 2.0 | 1494 | $1,900 | $1.27 | 13d | 1 | 1.33mi |
| 8680 SW 94th Ln Unit G Ocala, FL | 3.0 | 2.0 | 1409 | $1,550 | $1.10 | 21d | 1 | 1.35mi |
| 8250 SW 67th Ave Ocala, FL | 3.0 | 2.5 | 1505 | $1,635 | $1.09 | 21d | 1 | 1.36mi |
| 9122 SW 70th Loop Ocala, FL | 2.0 | 2.0 | 1443 | $2,500 | $1.73 | 21d | 1 | 1.36mi |
| 6534 SW 82nd Loop Ocala, FL | 3.0 | 2.5 | 1450 | $1,900 | $1.31 | 13d | 1 | 1.37mi |
| 7235 SW 91st Ct Ocala, FL | 2.0 | 2.0 | 1163 | $2,200 | $1.89 | 13d | 1 | 1.38mi |
| 6676 SW 81st Loop Ocala, FL | 3.0 | 2.5 | 1458 | $1,710 | $1.17 | 13d | 1 | 1.43mi |
| 6582 SW 81st Loop Ocala, FL | 3.0 | 2.5 | 1505 | $1,700 | $1.13 | 13d | 1 | 1.44mi |
| 6644 SW 84th St Ocala, FL | 3.0 | 2.0 | 1485 | $950 | $0.64 | 21d | 1 | 1.44mi |
| 7195 SW 92nd St Ocala, FL | 3.0 | 2.5 | 1220 | $1,750 | $1.43 | 21d | 1 | 1.47mi |
| 6609 SW 81st Loop Ocala, FL | 3.0 | 2.5 | 1458 | $1,750 | $1.20 | 13d | 1 | 1.50mi |
HOA detail
- Monthly dues
- $241 · $2,892/yr
Listing history 29 events
-
2026-06-18days on market $239,875 Active 40 DOM
-
2026-06-17days on market $239,875 Active 39 DOM
-
2026-06-16days on market $239,875 Active 38 DOM
-
2026-06-15days on market $239,875 Active 37 DOM
-
2026-06-14days on market $239,875 Active 35 DOM
-
2026-06-13days on market $239,875 Active 34 DOM
-
2026-06-10days on market $239,875 Active 32 DOM
-
2026-06-09days on market $239,875 Active 31 DOM
-
2026-06-08days on market $239,875 Active 30 DOM
-
2026-06-07days on market $239,875 Active 29 DOM
-
2026-06-03days on market $239,875 Active 25 DOM
-
2026-06-02days on market $239,875 Active 24 DOM
-
2026-06-01days on market $239,875 Active 23 DOM
-
2026-05-31days on market $239,875 Active 22 DOM
-
2026-05-30days on market $239,875 Active 21 DOM
-
2026-05-09$239,875 Active 1270-char remark
-
2025-12-31historical
-
2025-04-21status Active
-
2025-04-18status Pending
-
2025-04-10price $274,000
-
2025-03-01price $284,900
-
2025-01-24price $299,500
-
2024-12-09$310,000 Active
-
2024-10-16historical
-
2024-08-02price $299,000
-
2024-04-18$309,000 Active
-
2017-03-09soldstatus $125,000
-
2017-02-28soldstatus $125,000
-
2016-09-02$139,950
ⓘ Source: listings_history table (triggers on properties + properties_extension) + one-shot
backfill from property_details.listing_events for pre-trigger history.
Tax reassessment forecast FL · Resets to sale price
- Current annual tax
- $2,321 · $193/mo
- Projected year-2 tax
- $2,321 · $193/mo
- Expected delta
- $0/yr ($0/mo · 0.0%)
ⓘ Screening estimate from a state-policy table — verify with the county assessor before closing.
Climate risk First Street
- Flood 4/10 Moderate FEMA zone X (unshaded) · 24% chance over 30 yrs
- Wildfire 4/10 Moderate
- Heat 9/10 Extreme 7 d/yr ≥107°F today · 23 d/yr by 30 yrs out
- Wind 9/10 Extreme 99% chance of damaging wind over 30 yrs
- Air quality 3/10 Moderate 3 unhealthy d/yr today · 3 by 30 yrs out
Nearby sold comps map
Loading sold comps map…
Walkable amenities ~0.75 mi
Loading nearby amenities…
Taxation est. · year 1
- Rental income
- $23,713
- − Mortgage interest
- −$13,437
- − Property taxes
- −$2,321
- − Insurance
- −$1,199
- − Repairs & maintenance
- −$1,897
- − Management
- −$1,897
- − HOA
- −$2,892
- − Depreciation
- −$6,978
- Taxable loss
- −$6,908
- Est. tax savings @ 24.0%
- +$1,658
- After-tax cash flow
- $-1,116/yr
For passive investors: Depreciation is non-cash, so a rental often shows a tax loss while cash-flowing — sheltering income. Rental losses are passive: they offset passive income freely, and up to $25,000/yr can offset ordinary (W-2) income if you actively participate and your MAGI is under $100k (phasing out to $0 by $150k); unused losses carry forward. On sale, claimed depreciation is recaptured at up to 25%, and gains may owe capital-gains tax (a 1031 exchange can defer both). Figures are a year-1 estimate at your 24.0% rate — not tax advice; consult a CPA.
Schools (NCES district)
- District
- Marion
- NCES district ID
- 1201260
- Math proficiency
- 42% ▼ -7.00%
- Reading proficiency
- 43% ▼ -4.00%
- Median HH income
- $40,015
- Composite
- 35.61/100
- National rank
- #4890
- State rank
- #61 of 73 in FL
Livability — On Top of the World
No livability data for this city. (Only ~50 U.S. cities are tracked.)
Census & demographics
- Census place
- On Top of the World, FL
- County
- Marion County · 315,796 people
- City population
- 25,668
- Metro
- Ocala, FL
- Population (ZIP)
- 28,997
- Household income
- $65,860
- Rent vs Own
- Severe rent burden
- 204.0
Population outlook (Marion County) Hauer SSP2
- Today (2025)
- 365,905 people
- By 2030
- 376,768 · +3.0%
- By 2040
- 396,555 · +8.4%
- By 2050
- 412,723 · +12.8%
- By 2075
- 446,090 · +21.9%
- By 2100
- 436,193 · +19.2%
Race, ethnicity, and origin ACS 2023
- Neighborhood character
- Diverse neighborhood (Simpson 0.55)
- Race & ethnicity
- White 63% Hispanic / Latino 18% Black 13% Two or more races 10% Asian 1%
- Hispanic origin (detail)
- Mexican 3% Puerto Rican 8% Cuban 3%
- Common ancestry
- Romanian 3% Slovak 3% Lithuanian 3%
- Foreign-born
- 15% · Canada, Jamaica, Dominican Republic
- Languages at home
- 83% English-only · Spanish 14% Other Indo-European 1% German/W. Germanic 1%
Political lean MEDSL · Marion
- 2024 margin
- Solid R (+31.6) · D 33.8% · R 65.5%
- 2008→2024 swing
- -20.0pp toward R · 2008: -11.6pp · 2024: -31.6pp
- All cycles
- 2024: R+31.6 2020: R+25.9 2016: R+26.2 2012: R+16.2 2008: R+11.6
Not yet ingested
- Civics
- —
Market trends
- HPI YoY
- ▼ -105.22%
- Current HPI
- 189.0869
- Rent YoY
- ▼ -2.57%
- Metro
- Ocala, FL
- State GDP YoY
- ▲ 3.28%
- F500 in state
- 36
Industry mix (Fortune 500 HQ in FL)
| Industry | F500 HQs | Revenue |
|---|---|---|
| Industrial Technology | 2 | $29B |
|
||
| Insurance | 2 | $17B |
|
||
| Retail | 1 | $60B |
|
||
| Technology Distribution | 1 | $58B |
|
||
| Homebuilding | 1 | $35B |
|
||
| Technology Manufacturing | 1 | $35B |
|
||
Price history
+71.4% since first listed14 events — show timeline
- 2026-05-09 Listed $239,875 Stellar MLS as Distributed by MLS Grid
- 2025-12-31 Listing Removed — Stellar MLS as Distributed by MLS Grid
- 2025-04-21 Relisted — Stellar MLS as Distributed by MLS Grid
- 2025-04-18 Pending — Stellar MLS as Distributed by MLS Grid
- 2025-04-10 Price Changed $274,000 Stellar MLS as Distributed by MLS Grid
- 2025-03-01 Price Changed $284,900 Stellar MLS as Distributed by MLS Grid
- 2025-01-24 Price Changed $299,500 Stellar MLS as Distributed by MLS Grid
- 2024-12-09 Listed $310,000 Stellar MLS as Distributed by MLS Grid
- 2024-10-16 Listing Removed — Stellar MLS as Distributed by MLS Grid
- 2024-08-02 Price Changed $299,000 Stellar MLS as Distributed by MLS Grid
- 2024-04-18 Listed $309,000 Stellar MLS as Distributed by MLS Grid
- 2017-03-09 Sold (Public Records) $125,000 Public Records
- 2017-02-28 Sold (MLS) $125,000 Stellar MLS as Distributed by MLS Grid
- 2016-09-02 Listed $139,950 Stellar MLS as Distributed by MLS Grid
Property tax history
-1.1%/yrLatest (2025): $2,321 · +14.3% YoY. Source: county tax records.
Cash-flow waterfall
monthlySold comps — $/sqft
last 12 mo · ≤1 miLoading sold comps…