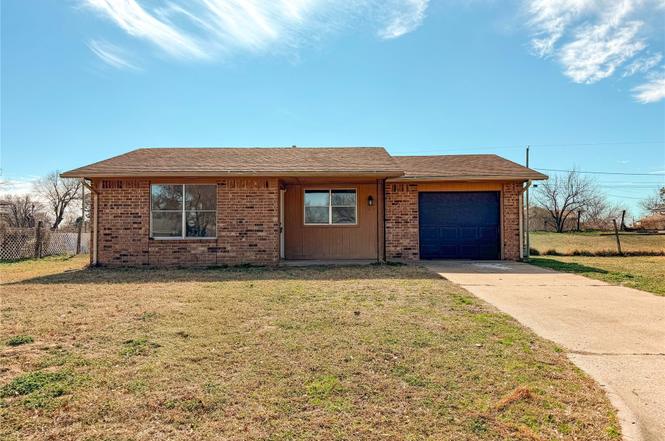
422 E 24th St · Okmulgee, OK
Flood risk 1/10 · Minimal
- FEMA flood zone
- X (unshaded)
- Chance of flooding over 30 yrs
- 0.0%
- Est. flood insurance / yr
- $507 – $1,088
Fire risk 7/10 · Major
- Est. fire insurance / yr
- $2,463 – $4,575
Heat risk 6/10 · Moderate
- Hot days now (above 111°F)
- 7 days/yr
- Hot days in 30 yrs
- 19 days/yr
Wind risk 2/10 · Minimal
- Chance of severe wind over 30 yrs
- 4.0%
Air-quality risk 2/10 · Minimal
- Unhealthy air days now
- 1 days/yr
- Unhealthy air days in 30 yrs
- 2 days/yr
Risk factors via First Street. Map © Google.
Why this score? — see what drove the D+ grade
The composite is a weighted blend of 9 inputs, each scored 0–100. Each bar is that input's sub-score; the figure is the points it added to the 100-point composite (weight × sub-score).
- Cash flow +20.3/30.0
- ARV discount +7.5/15.0
- DSCR +6.4/10.0
- 1% rule +4.3/10.0
- Livability +3.1/5.0
- Rent growth +2.5/5.0
- Condition / age +2.5/5.0
- Schools +0.4/10.0
- Appreciation +0.2/10.0
$114,500
🖨 Deal sheet (PDF) 📄 Offer letter ✓ Due diligence
Listing remarks
Lovely, remodeled move-in-ready home in a quiet neighborhood next to a cul-de-sac! This home offers 3 bedrooms, 1 Full bathroom, a large living room, a separate dining area, a new kitchen with brand-new cabinets and countertops, an inside laundry area, and a 1-car attached garage! New paint, new vinyl flooring, and new light fixtures throughout the home! This home is absolutely perfect for a first-time homebuyer or someone looking to downsize!
Key facts
- 6,400 sq ft lot
- Garage
- Built 1988
Property features AI
Finance
- HOA & community: Gutters noted as a community feature
Exterior
- Parking: Attached garage (1 car)
- Security: No safety shelter
- Utilities: Electricity available; Natural gas available; High-speed internet available; Public water; Public sewer
- Home design: Single-story home; Faces north; Slab foundation
- Construction: Brick and wood siding with wood frame construction; Asphalt/fiberglass roof; Built per public records
- Exterior features: Concrete driveway; Rain gutters; Covered porch
Interior
- Kitchen: Eat-in kitchen; Microwave
- Bedrooms: Master bedroom on the first floor; Two additional bedrooms on the first floor
- Flooring: Vinyl flooring
- Bathrooms: One full bathroom (hall bath with bathtub) on the first floor
- Heating & cooling: Central heating (gas); Central air conditioning
- Interior features: Aluminum-framed windows; Laminate countertops; Electric oven connection; Gas range connection
- Laundry & utility: Inside utility room on the first floor; Washer hookup; Electric dryer hookup; Gas water heater
Neighborhood map
What this means for you Summary
Snapshot
- This is a 3-bed/1.0-bath single-family listed at $114k.
Deal economics
- At list price, monthly cash flow is $146 ($2k/yr) — positive.
- The deal already cash-flows at list — no discount required.
- To meet the 1% rule (rent ≥ 1% of price), the offer needs to be $107k (6.6% below list).
- Recommended offer: $107k (6.6% below list) — sets the bar for 1% rule.
Location & tenants
- Location reads 61/100 on livability (#300 in OK) — a middle-class / working-renter tenant base. Strengths: cost of living A+, housing A+, health & safety A+; Watch: schools F, crime F, amenities F.
- Okmulgee (town): math 3% / reading 7% proficiency, ranked #264 of 270 in OK (top 98%) — low school quality limits family demand, transient renter base, plan for 1-2y turnover; 73% free/reduced lunch — lower-income household profile, screen leases tightly.
- Market conditions: 147 active listings in the ZIP; 4 comparable units currently listed for rent nearby; rentals at typical pace (median 25d on market — plan ~3-4 weeks tenant-placement turnaround); 12 units permitted in Okmulgee County in 2024 (0 in 5+ unit buildings).
Forward outlook
- Local home prices are declining (-3.0%/yr); year-one equity from $792 of loan paydown is wiped out by about $3k of value loss. Plan a longer hold.
- Okmulgee County population projected at -13% by 2050 — secular population decline; favor cash flow + early exit over multi-decade hold.
Negotiation context
- It's been on market 55 days — a 3% lower offer ($111k) is reasonable based on typical stale-listing flexibility.
Risks & watch-outs
- Climate carrying-cost: major wildfire risk; extreme-heat days projected 7→19/yr by 2055 (HVAC capex compounding) — expect insurance premiums to compound above CPI over the hold.
Questions for the listing agent
- It's been on market 55 days. Have you received any prior offers? Is the seller open to a 7% concession, seller financing, or rate buy-down credit?
- Is there a deadline driving the sale (1031 exchange, divorce, estate, relocation)? That informs how much negotiation room exists.
- Schools are F-rated, which usually means shorter tenancies and higher turnover. Who's the typical renter profile here, and what's been the actual vacancy rate?
- Crime grade is F in this area — have there been break-ins, vandalism, or insurance claims at this property in the last 3 years? What carrier currently insures it and at what premium?
- The area grade is low — what's the realistic commute time and amenity access for the typical tenant pool here? Any planned neighborhood developments (good or bad) we should know about?
- What's the average days-on-market for RENTAL listings here right now (not sales)? A rising rental-DOM trend means longer vacancies and softer asking-rent achievability than the comps imply.
- What's the recent tenant-quality profile in this submarket — average credit score on applications, eviction rate, late-payment / NSF rate, and stable-employment percentage? A property-management company in the area should have these aggregated.
- How much new for-sale + rental construction is in the pipeline within 1–3 miles? Heavy new supply typically softens prices + rents 12–24 months out; constrained supply supports both.
Investment metrics
- 1% rule
- 0.93% ✗
- Cap rate
- 7.82%
- Cash-on-cash
- 5.47%
- DSCR
- 1.24
- GRM
- 8.9
CMA / ARV
- ARV (on-the-fly)
- $51,408
- Comps found
- 8
Show comp detail 8 sales within ~0.75 mi
| Address | Dist | Beds/Ba | Sqft | Sold | Price | $/sf | Match |
|---|---|---|---|---|---|---|---|
| 1500 S Creek Ave | 0.25mi | 3/1.0 | 988 (-2%) | 22mo | $136,000 | $138 | 66 |
| 503 E 20th St | 0.31mi | 2/1.0 (-1) | 952 (-6%) | 14mo | $72,000 | $76 | 60 |
| 1601 S Creek Ave | 0.22mi | 3/2.0 | 1,080 (+7%) | 20mo | $148,000 | $137 | 57 |
| 905 S Creek Ave | 0.64mi | 2/1.0 (-1) | 1,020 (+1%) | 10mo | $30,000 | $29 | 55 |
| 409 E 20th St | 0.31mi | 3/1.0 | 1,112 (+10%) | 18mo | $45,000 | $40 | 54 |
| 504 Emerson Dr | 0.47mi | 2/1.0 (-1) | 936 (-7%) | 15mo | $30,000 | $32 | 49 |
| 407 E 20th St | 0.32mi | 2/1.0 (-1) | 888 (-12%) | 18mo | $45,000 | $51 | 46 |
| 706 E 13th St | 0.73mi | 2/1.0 (-1) | 1,088 (+8%) | 15mo | $37,500 | $34 | 35 |
Match score weights: distance 35% · size 25% · config 20% · recency 20%. Top-matched comps best support the ARV.
Projected returns pro-forma
-3.0% appreciation · 3.0% rent growth · sell at horizon
- IRR
- -7.9%
- Equity multiple
- 0.71×
- Total profit
- $-9,290
- Equity at exit
- $17,072
- IRR
- 1.6%
- Equity multiple
- 1.12×
- Total profit
- $3,727
- Equity at exit
- $9,900
Cash invested: $32,060 (down + closing). Projections, not guarantees.
Landlord ↔ Tenant lean methodology
- Overall (STATE)
- 83 Strongly Landlord-Friendly
- State Oklahoma
- 83 Strongly Landlord-Friendly · R+20
- County
- — inherits STATE
- City
- — inherits STATE
ZIP-level market 74447
- Home prices YoY
- -3.6%
- Active inventory
- 147
- Price-to-rent
- 8.9×
Monthly cashflow live
- Estimated rent
- $1,069 medium interval (Pro) →
- Mortgage (P&I)
- −$600
- Tax from tax record
- −$50 /mo · $606/yr
- Insurance
- −$48
- HOA
- −$0
- Vacancy / Maint / Mgmt
- −$225
- Net cashflow
- $146
Break-even live
Sensitivity live
| Price | -10% $211 | -5% $179 | +0% $146 | +5% $114 | +10% $81 |
|---|---|---|---|---|---|
| Rent | -10% $62 | -5% $104 | +0% $146 | +5% $188 | +10% $231 |
| Rate | -1.0pp $204 | -0.5pp $175 | base $146 | +0.5pp $116 | +1.0pp $86 |
UW: 25.0% down · 7.5% · 30yr · 1.5% tax · 5.0% vac · 8.0% maint · 8.0% mgmt
Financing live
Cash to close
- Down payment
- $28,625
- Closing costs
- $3,435
- Reserves months
- —
- Total cash needed
- —
Loan-product check · same deal, 3 products live
Conventional
25% down · 7.5% · 30yr
- Down + closing
- —
- Monthly P&I
- —
- Monthly cashflow
- —
- DSCR
- —
- Eligible?
- —
Personal DTI + credit; lowest rate.
DSCR
20% down · 8.5% · 30yr
- Down + closing
- —
- Monthly P&I
- —
- Monthly cashflow
- —
- DSCR
- —
- Eligible?
- —
No personal income docs; deal must DSCR.
Hard money
10% down · 12.0% · 12mo
- Down + closing
- —
- Monthly P&I
- —
- Monthly cashflow
- —
- DSCR
- —
- Eligible?
- —
Short-term bridge; refi at stabilization.
Rent comps 4 comps
| Address | Beds | Baths | Sqft | Rent | $/sqft | DOM | Units | Dist |
|---|---|---|---|---|---|---|---|---|
| 324 E 6th St Unit 214 Okmulgee, OK | 2.0 | 1.0 | 891 | $1,200 | $1.35 | 24d | 1 | 1.17mi |
| 324 E 6th St Unit 204 Okmulgee, OK | 2.0 | 1.0 | 770 | $1,150 | $1.49 | 24d | 1 | 1.17mi |
| 324 E 6th St Unit 116 Okmulgee, OK | 2.0 | 1.0 | 776 | $1,060 | $1.37 | 24d | 1 | 1.17mi |
| 1104 W 8th St Okmulgee, OK | 2.0 | 1.0 | 1084 | $850 | $0.78 | 4d | 1 | 1.40mi |
Listing history 6 events
-
2026-04-15status Pending
-
2026-04-09price $114,500
-
2026-04-03price $119,500
-
2026-03-18price $124,500
-
2026-03-05price $129,500
-
2026-02-18$135,000 Active
ⓘ Source: listings_history table (triggers on properties + properties_extension) + one-shot
backfill from property_details.listing_events for pre-trigger history.
Tax reassessment forecast OK · Resets to sale price
- Current annual tax
- $606 · $50/mo
- Projected year-2 tax
- $1,030 · $86/mo
- Expected delta
- +$424/yr (+$35/mo · 70.0%)
ⓘ Screening estimate from a state-policy table — verify with the county assessor before closing.
Climate risk First Street
- Flood 1/10 Low FEMA zone X (unshaded) · 0% chance over 30 yrs
- Wildfire 7/10 Severe
- Heat 6/10 Major 7 d/yr ≥111°F today · 19 d/yr by 30 yrs out
- Wind 2/10 Low 4% chance of damaging wind over 30 yrs
- Air quality 2/10 Low 1 unhealthy d/yr today · 2 by 30 yrs out
Nearby sold comps map
Loading sold comps map…
Walkable amenities ~0.75 mi
Loading nearby amenities…
Taxation est. · year 1
- Rental income
- $12,832
- − Mortgage interest
- −$6,414
- − Property taxes
- −$606
- − Insurance
- −$572
- − Repairs & maintenance
- −$1,027
- − Management
- −$1,027
- − Depreciation
- −$3,331
- Taxable loss
- −$145
- Est. tax savings @ 24.0%
- +$35
- After-tax cash flow
- $1,788/yr
For passive investors: Depreciation is non-cash, so a rental often shows a tax loss while cash-flowing — sheltering income. Rental losses are passive: they offset passive income freely, and up to $25,000/yr can offset ordinary (W-2) income if you actively participate and your MAGI is under $100k (phasing out to $0 by $150k); unused losses carry forward. On sale, claimed depreciation is recaptured at up to 25%, and gains may owe capital-gains tax (a 1031 exchange can defer both). Figures are a year-1 estimate at your 24.0% rate — not tax advice; consult a CPA.
Schools (NCES district)
- District
- Okmulgee
- NCES district ID
- 4022800
- Math proficiency
- 3% ▼ -5.00%
- Reading proficiency
- 7% ▼ -8.00%
- Median HH income
- $31,078
- Composite
- 3.66/100
- National rank
- #10069
- State rank
- #264 of 270 in OK
Livability — Okmulgee
- Score
- 61/100
- State rank
- #300
- US rank
- #17773
Category grades
Schools grade is shown separately in the Schools card above.
Census & demographics
- Census place
- Okmulgee, OK
- Population (ZIP)
- 15,500
Population outlook (Okmulgee County) Hauer SSP2
- Today (2025)
- 37,543 people
- By 2030
- 36,528 · -2.7%
- By 2040
- 34,430 · -8.3%
- By 2050
- 32,498 · -13.4%
- By 2075
- 28,814 · -23.3%
- By 2100
- 25,193 · -32.9%
Race, ethnicity, and origin ACS 2023
- Neighborhood character
- Diverse neighborhood (Simpson 0.69)
- Race & ethnicity
- White 54% Native American 15% Two or more races 15% Black 13% Hispanic / Latino 4%
- Common ancestry
- Slovak 2% Italian 1% Romanian 1%
- Foreign-born
- 1%
- Languages at home
- 97% English-only · Spanish 1%
Political lean MEDSL · Okmulgee
- 2024 margin
- Solid R (+42.7) · D 27.7% · R 70.4% · Other 1.9%
- 2008→2024 swing
- -25.7pp toward R · 2008: -17.0pp · 2024: -42.7pp
- All cycles
- 2024: R+42.7 2020: R+37.1 2016: R+32.7 2012: R+17.5 2008: R+17.0
Not yet ingested
- Civics
- —
Market trends
- HPI YoY
- ▼ -9.69%
- Current HPI
- 257.2856
- Rent YoY
- —
- Metro
- —
- State GDP YoY
- ▲ 1.55%
- F500 in state
- 6
Industry mix (Fortune 500 HQ in OK)
| Industry | F500 HQs | Revenue |
|---|---|---|
| Energy | 3 | $48B |
|
||
Price history
-15.2% since first listed6 events — show timeline
- 2026-04-15 Pending — MLS Technology, Inc.
- 2026-04-09 Price Changed $114,500 MLS Technology, Inc.
- 2026-04-03 Price Changed $119,500 MLS Technology, Inc.
- 2026-03-18 Price Changed $124,500 MLS Technology, Inc.
- 2026-03-05 Price Changed $129,500 MLS Technology, Inc.
- 2026-02-18 Listed $135,000 MLS Technology, Inc.
Property tax history
+1.2%/yrLatest (2025): $606 · +2.0% YoY. Source: county tax records.
Cash-flow waterfall
monthlySold comps — $/sqft
last 12 mo · ≤1 miLoading sold comps…