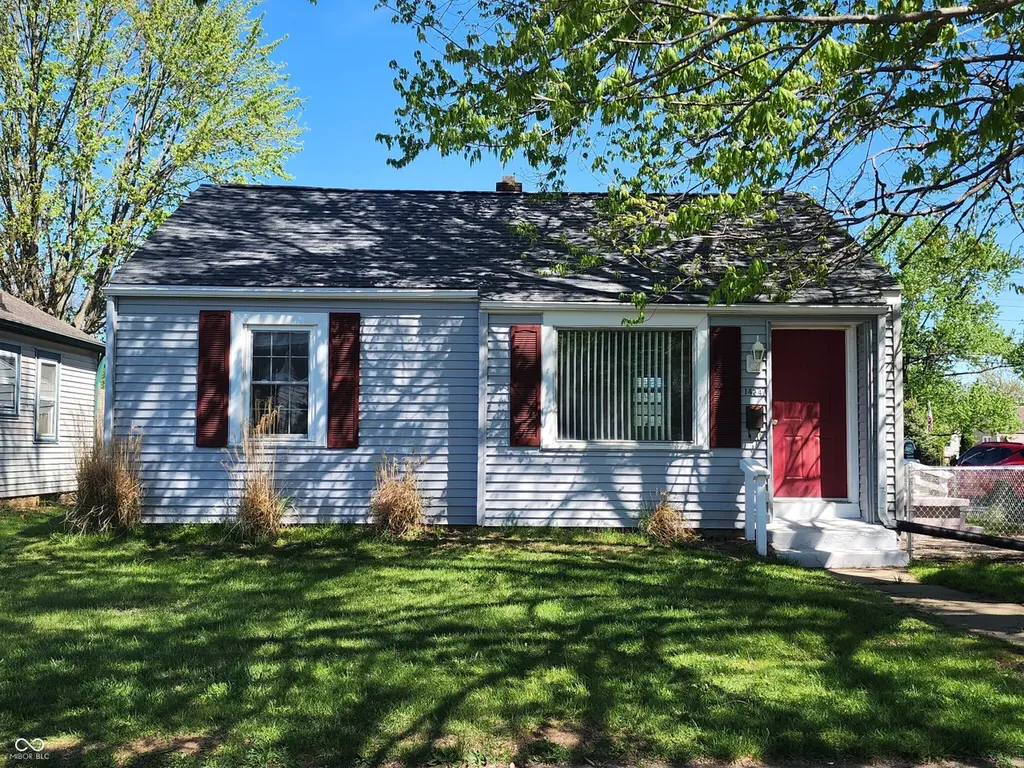
1434 E 31st St · Anderson, IN
Flood risk 1/10 · Minimal
- FEMA flood zone
- X (unshaded)
- Chance of flooding over 30 yrs
- 0.0%
- Est. flood insurance / yr
- $473 – $860
Fire risk 1/10 · Minimal
- Est. fire insurance / yr
- $717 – $1,331
Heat risk 3/10 · Minor
- Hot days now (above 100°F)
- 7 days/yr
- Hot days in 30 yrs
- 18 days/yr
Wind risk 2/10 · Minimal
- Chance of severe wind over 30 yrs
- 0.0%
Air-quality risk 3/10 · Minor
- Unhealthy air days now
- 2 days/yr
- Unhealthy air days in 30 yrs
- 3 days/yr
Risk factors via First Street. Map © Google.
Why this score? — see what drove the F grade
The composite is a weighted blend of 9 inputs, each scored 0–100. Each bar is that input's sub-score; the figure is the points it added to the 100-point composite (weight × sub-score).
- Cash flow +8.2/30.0
- Rent growth +4.5/5.0
- Livability +3.0/5.0
- Condition / age +2.5/5.0
- DSCR +2.2/10.0
- 1% rule +2.1/10.0
- Schools +1.6/10.0
- ARV discount +0.0/15.0
- Appreciation +0.0/10.0
$109,900
🖨 Deal sheet 📄 Offer letter ✓ Due diligence
Listing remarks MLS
2 BEDROOM, 1 BATH BUNGALOW. FULL BASEMENT WITH LAUNDRY, FULLY FENCED IN. THIS IS A FANNIE MAE HOMEPATH PROPERTY. PURCHASE THIS PROPERTY FOR AS LITTLE AS 3% DOWN! THIS PROPERTY IS APPROVED FOR HOMEPATH MORTGAGE FINANCING. PROPERTY TO BE SOLD "AS-IS". ALL OFFERS SUBJECT TO CORP/INVESTOR APPROVAL AND CONTINGENT OF SIGNED SELLERS ADDENDUMS. INFORMATION DEEMED ACCURATE BUT NOT GUARANTEED.
Key facts
- Recent updates
- Full basement
- Fenced-in backyard
Tags
Property features AI
Finance
- Other: Property on approximately 0.11 acre (< 1/4 acre); Approximately 1,462 total building area with finished basement space
Exterior
- Parking: Detached 2-car garage (approx. 400 sq ft)
- Utilities: Public water; Municipal sewer
- Home design: Single-family residence; One level
- Construction: Vinyl siding; Block foundation
- Exterior features: Chain link full fence
Interior
- Kitchen: Gas oven; Range hood; Refrigerator
- Bedrooms: 2 bedrooms on the main level; 2 total bedrooms
- Bathrooms: 1 full bathroom (main level)
- Heating & cooling: Forced air heating (natural gas); No central air
- Interior features: Breakfast bar; Eat-in kitchen; Partially finished basement
- Laundry & utility: Laundry located in the basement; Electric water heater
Neighborhood map
What this means for you Summary
Snapshot
- This is a 2-bed/1.0-bath single-family listed at $110k.
Deal economics
- At list price, monthly cash flow is $-103 ($-1k/yr) — negative.
- To cash-flow at today's rent, offer at most $92k (16.5% below list).
- To meet the 1% rule (rent ≥ 1% of price), the offer needs to be $78k (29.1% below list).
- Recommended offer: $78k (29.1% below list) — sets the bar for 1% rule.
Location & tenants
- Location reads 60/100 on livability (#521 in IN) — a middle-class / working-renter tenant base. Strengths: cost of living A+, housing A+; Watch: schools F, crime D-, amenities F.
- Anderson Community School Corporation (urban): math 15% / reading 23% proficiency, ranked #280 of 301 in IN (top 93%) — low school quality limits family demand, transient renter base, plan for 1-2y turnover; 70% free/reduced lunch — lower-income household profile, screen leases tightly.
- Market conditions: Rents rising fast (+7.9%/yr); 185 active listings in the ZIP; 11 comparable units currently listed for rent nearby; rentals lingering (median 44d on market — plan ~5-8 weeks vacancy on turnover, expect pricing pressure); 55% of comp listings sitting > 30 days — soft ceiling on asking rent; lower-income renter base — watch delinquency; 184 units permitted in Madison County in 2024 (0 in 5+ unit buildings).
Forward outlook
- Local home prices are declining (-3.0%/yr); year-one equity from $760 of loan paydown is wiped out by about $3k of value loss. Plan a longer hold.
- Madison County population projected at -14% by 2050 — secular population decline; favor cash flow + early exit over multi-decade hold.
Negotiation context
- It's been on market 40 days — a 3% lower offer ($107k) is reasonable based on typical stale-listing flexibility.
- 3 sale attempts since 21y ago; this cycle's ask has dropped $10k (8%) from the opening price — seller is motivated, your offer sets the floor, not the list.
- Current owner paid $15k; list at $110k implies a 633% gain — meaningful room to come down on a strong offer.
Risks & watch-outs
- Watch-outs: built in 1941 — expect roof / HVAC / electrical / plumbing capex.
Questions for the listing agent
- What do current leases actually rent for vs. the listed asking? Can we see a recent rent roll and the last 12 months of T-12 income?
- It's been on market 40 days. Have you received any prior offers? Is the seller open to a 29% concession, seller financing, or rate buy-down credit?
- Built in 1941 — when were the roof, HVAC, electrical panel, plumbing, and water heater last replaced?
- Is there a deadline driving the sale (1031 exchange, divorce, estate, relocation)? That informs how much negotiation room exists.
- Schools are F-rated, which usually means shorter tenancies and higher turnover. Who's the typical renter profile here, and what's been the actual vacancy rate?
- Crime grade is D in this area — have there been break-ins, vandalism, or insurance claims at this property in the last 3 years? What carrier currently insures it and at what premium?
- The area grade is low — what's the realistic commute time and amenity access for the typical tenant pool here? Any planned neighborhood developments (good or bad) we should know about?
- What's the average days-on-market for RENTAL listings here right now (not sales)? A rising rental-DOM trend means longer vacancies and softer asking-rent achievability than the comps imply.
- What's the recent tenant-quality profile in this submarket — average credit score on applications, eviction rate, late-payment / NSF rate, and stable-employment percentage? A property-management company in the area should have these aggregated.
- How much new for-sale + rental construction is in the pipeline within 1–3 miles? Heavy new supply typically softens prices + rents 12–24 months out; constrained supply supports both.
Investment metrics
- 1% rule
- 0.71% ✗
- Cap rate
- 5.17%
- Cash-on-cash
- -4.01%
- DSCR
- 0.82
- GRM
- 11.7
CMA / ARV
- ARV (median comp)
- $94,082
- List price
- $109,900
- Delta
- 16.81%
- Verdict
- OVERPRICED
- Comps
- 20 within 1.0 mi
Show comp detail 5 sales within ~0.75 mi
| Address | Dist | Beds/Ba | Sqft | Sold | Price | $/sf | Match |
|---|---|---|---|---|---|---|---|
| 1423 E 30th St | 0.03mi | 2/1.0 | 769 (+5%) | 22mo | $90,500 | $118 | 72 |
| 3127 E Lynn St | 0.27mi | 2/1.0 | 814 (+11%) | 11mo | $53,000 | $65 | 60 |
| 3507 Columbus Ave | 0.50mi | 2/1.0 | 832 (+14%) | 4mo | $60,000 | $72 | 50 |
| 1912 E 38th St | 0.65mi | 2/1.0 | 720 (-2%) | 21mo | $56,500 | $78 | 50 |
| 3402 Canaday Dr | 0.69mi | 2/1.0 | 792 (+8%) | 23mo | $125,000 | $158 | 35 |
Match score weights: distance 35% · size 25% · config 20% · recency 20%. Top-matched comps best support the ARV.
Projected returns pro-forma
-3.0% appreciation · 7.88% rent growth · sell at horizon
- IRR
- -18.1%
- Equity multiple
- 0.34×
- Total profit
- $-20,359
- Equity at exit
- $16,386
- IRR
- -3.2%
- Equity multiple
- 0.74×
- Total profit
- $-7,987
- Equity at exit
- $9,502
Cash invested: $30,772 (down + closing). Projections, not guarantees.
Landlord ↔ Tenant lean methodology
- Overall (STATE)
- 90 Strongly Landlord-Friendly
- State Indiana
- 90 Strongly Landlord-Friendly · R+11
- County
- — inherits STATE
- City
- — inherits STATE
ZIP-level market 46016
- Home prices YoY
- -3.5%
- Rents YoY
- 7.9%
- Active inventory
- 185
- Price-to-rent
- 11.7×
Monthly cashflow live
- Estimated rent
- $780 high interval (Pro) →
- Mortgage (P&I)
- −$576
- Tax from tax record
- −$97 /mo · $1,160/yr
- Insurance
- −$46
- HOA
- −$0
- Vacancy / Maint / Mgmt
- −$164
- Net cashflow
- $-103
Break-even live
UW: 25.0% down · 7.5% · 30yr · 1.5% tax · 5.0% vac · 8.0% maint · 8.0% mgmt
Financing live
Cash to close
- Down payment
- $27,475
- Closing costs
- $3,297
- Reserves months
- —
- Total cash needed
- —
Loan-product check · same deal, 3 products live
Conventional
25% down · 7.5% · 30yr
- Down + closing
- —
- Monthly P&I
- —
- Monthly cashflow
- —
- DSCR
- —
- Eligible?
- —
Personal DTI + credit; lowest rate.
DSCR
20% down · 8.5% · 30yr
- Down + closing
- —
- Monthly P&I
- —
- Monthly cashflow
- —
- DSCR
- —
- Eligible?
- —
No personal income docs; deal must DSCR.
Hard money
10% down · 12.0% · 12mo
- Down + closing
- —
- Monthly P&I
- —
- Monthly cashflow
- —
- DSCR
- —
- Eligible?
- —
Short-term bridge; refi at stabilization.
Rent comps 11 comps
| Address | Beds | Baths | Sqft | Rent | $/sqft | DOM | Units | Dist |
|---|---|---|---|---|---|---|---|---|
| 3614 Columbus Ave Anderson, IN | 1.0 | 1.0 | 553 | $725 | $1.31 | 14d | 1 | 0.53mi |
| 2233 E Lynn St Anderson, IN | 1.0 | 1.0 | 700 | $695 | $0.99 | 1d | 1 | 0.67mi |
| 328 E 31st St Anderson, IN | 1.0 | 1.0 | 600 | $750 | $1.25 | 43d | 1 | 0.72mi |
| 702 E 23rd St Anderson, IN | 1.0 | 1.0 | 560 | $595 | $1.06 | 14d | 1 | 0.77mi |
| 2002 Jefferson St Unit 3 Anderson, IN | 1.0 | 2.0 | 725 | $600 | $0.83 | 43d | 1 | 0.94mi |
| 1719 Johnson Ave Anderson, IN | 1.0 | 1.0 | 616 | $824 | $1.34 | 43d | 1 | 1.01mi |
| 1710 Jefferson St Apt 2 Anderson, IN | 2.0 | 1.0 | 550 | $950 | $1.73 | 43d | 1 | 1.08mi |
| 2408 Brown St Apt B Anderson, IN | 1.0 | 1.0 | 500 | $850 | $1.70 | 23d | 1 | 1.23mi |
| 2527 Chase St Anderson, IN | 1.0 | 1.0 | 400 | $650 | $1.62 | 43d | 1 | 1.27mi |
| 1807 Meridian St Apt 4 Anderson, IN | 2.0 | 1.0 | 475 | $725 | $1.53 | 43d | 1 | 1.33mi |
| 221 E 13th St Anderson, IN | 1.0 | 1.0 | 595 | $995 | $1.67 | 14d | 1 | 1.47mi |
Listing history 20 events
-
2026-06-18days on market $109,900 Active 40 DOM
-
2026-06-17days on market $109,900 Active 39 DOM
-
2026-06-16days on market $109,900 Active 38 DOM
-
2026-06-15price $109,900 Active 37 DOM
-
2026-06-15days on market $119,900 Active 37 DOM
-
2026-06-13days on market $119,900 Active 35 DOM
-
2026-06-09days on market $119,900 Active 31 DOM
-
2026-06-08days on market $119,900 Active 30 DOM
-
2026-06-07days on market $119,900 Active 29 DOM
-
2026-06-05days on market $119,900 Active 26 DOM
-
2026-06-03days on market $119,900 Active 25 DOM
-
2026-06-02days on market $119,900 Active 24 DOM
-
2026-06-01days on market $119,900 Active 23 DOM
-
2026-05-31days on market $119,900 Active 22 DOM
-
2026-05-09$119,900 Active 427-char remark
-
2011-01-20historical 398-char remark
Show marketing remark (398 chars)
2 BEDROOM, 1 BATH BUNGALOW. FULL BASEMENT WITH LAUNDRY, FULLY FENCED IN. THIS IS A FANNIE MAE HOMEPATH PROPERTY. PURCHASE THIS PROPERTY FOR AS LITTLE AS 3% DOWN! THIS PROPERTY IS APPROVED FOR HOMEPATH MORTGAGE FINANCING. PROPERTY TO BE SOLD "AS-IS". ALL OFFERS SUBJECT TO CORP/INVESTOR APPROVAL AND CONTINGENT OF SIGNED SELLERS ADDENDUMS. INFORMATION DEEMED ACCURATE BUT NOT GUARANTEED.
-
2011-01-19soldstatus $15,000 398-char remark
Show marketing remark (398 chars)
2 BEDROOM, 1 BATH BUNGALOW. FULL BASEMENT WITH LAUNDRY, FULLY FENCED IN. THIS IS A FANNIE MAE HOMEPATH PROPERTY. PURCHASE THIS PROPERTY FOR AS LITTLE AS 3% DOWN! THIS PROPERTY IS APPROVED FOR HOMEPATH MORTGAGE FINANCING. PROPERTY TO BE SOLD "AS-IS". ALL OFFERS SUBJECT TO CORP/INVESTOR APPROVAL AND CONTINGENT OF SIGNED SELLERS ADDENDUMS. INFORMATION DEEMED ACCURATE BUT NOT GUARANTEED.
-
2010-12-14$12,500 398-char remark
Show marketing remark (398 chars)
2 BEDROOM, 1 BATH BUNGALOW. FULL BASEMENT WITH LAUNDRY, FULLY FENCED IN. THIS IS A FANNIE MAE HOMEPATH PROPERTY. PURCHASE THIS PROPERTY FOR AS LITTLE AS 3% DOWN! THIS PROPERTY IS APPROVED FOR HOMEPATH MORTGAGE FINANCING. PROPERTY TO BE SOLD "AS-IS". ALL OFFERS SUBJECT TO CORP/INVESTOR APPROVAL AND CONTINGENT OF SIGNED SELLERS ADDENDUMS. INFORMATION DEEMED ACCURATE BUT NOT GUARANTEED.
-
2005-07-29soldstatus $53,500
Show marketing remark (236 chars)
STOP PAYING RENT! CUTE 2 BR BUNGALOW IS JUST FOR YOU. ROOF '01, VINYL SIDING '02 * OPEN CONCEPT - GREAT RM/KITCHEN COMBO * EFFICIENT LIVING * BUILT-IN CABINETS IN GREAT ROOM * FULL BASEMENT W/LAUNDRY HOOK-UPS * FULLY FENCED BACK YARD.
-
2005-04-12$54,500
Show marketing remark (236 chars)
STOP PAYING RENT! CUTE 2 BR BUNGALOW IS JUST FOR YOU. ROOF '01, VINYL SIDING '02 * OPEN CONCEPT - GREAT RM/KITCHEN COMBO * EFFICIENT LIVING * BUILT-IN CABINETS IN GREAT ROOM * FULL BASEMENT W/LAUNDRY HOOK-UPS * FULLY FENCED BACK YARD.
ⓘ Source: listings_history table (triggers on properties + properties_extension) + one-shot
backfill from property_details.listing_events for pre-trigger history.
Tax reassessment forecast IN · Partial reset (capped growth)
- Current annual tax
- $1,160 · $97/mo
- Projected year-2 tax
- $1,160 · $97/mo
- Expected delta
- $0/yr ($0/mo · 0.0%)
ⓘ Screening estimate from a state-policy table — verify with the county assessor before closing.
Climate risk First Street
- Flood 1/10 Low FEMA zone X (unshaded) · 0% chance over 30 yrs
- Wildfire 1/10 Low
- Heat 3/10 Moderate 7 d/yr ≥100°F today · 18 d/yr by 30 yrs out
- Wind 2/10 Low 0% chance of damaging wind over 30 yrs
- Air quality 3/10 Moderate 2 unhealthy d/yr today · 3 by 30 yrs out
Nearby sold comps map
Loading sold comps map…
Walkable amenities ~0.75 mi
Loading nearby amenities…
Taxation est. · year 1
- Rental income
- $9,355
- − Mortgage interest
- −$6,156
- − Property taxes
- −$1,160
- − Insurance
- −$550
- − Repairs & maintenance
- −$748
- − Management
- −$748
- − Depreciation
- −$3,197
- Taxable loss
- −$3,204
- Est. tax savings @ 24.0%
- +$769
- After-tax cash flow
- $-466/yr
For passive investors: Depreciation is non-cash, so a rental often shows a tax loss while cash-flowing — sheltering income. Rental losses are passive: they offset passive income freely, and up to $25,000/yr can offset ordinary (W-2) income if you actively participate and your MAGI is under $100k (phasing out to $0 by $150k); unused losses carry forward. On sale, claimed depreciation is recaptured at up to 25%, and gains may owe capital-gains tax (a 1031 exchange can defer both). Figures are a year-1 estimate at your 24.0% rate — not tax advice; consult a CPA.
Schools (NCES district)
- District
- Anderson Community School Corporation
- NCES district ID
- 1800150
- Math proficiency
- 15% ▼ -14.00%
- Reading proficiency
- 23% ▼ -7.00%
- Median HH income
- $38,208
- Composite
- 15.93/100
- National rank
- #9250
- State rank
- #280 of 301 in IN
Livability — Anderson
- Score
- 60/100
- State rank
- #521
- US rank
- #18709
Category grades
Schools grade is shown separately in the Schools card above.
Census & demographics
- Census place
- Anderson, IN
- County
- Madison County · 69,445 people
- City population
- 57,762
- Metro
- Indianapolis-Carmel-Anderson, IN
- Population (ZIP)
- 17,834
- Household income
- $36,029
- Rent vs Own
- Severe rent burden
- 1193.0
Population outlook (Madison County) Hauer SSP2
- Today (2025)
- 125,800 people
- By 2030
- 122,640 · -2.5%
- By 2040
- 115,420 · -8.3%
- By 2050
- 108,148 · -14.0%
- By 2075
- 91,838 · -27.0%
- By 2100
- 75,670 · -39.8%
Race, ethnicity, and origin ACS 2023
- Neighborhood character
- Diverse neighborhood (Simpson 0.58)
- Race & ethnicity
- White 61% Black 18% Hispanic / Latino 13% Two or more races 11% Native American 1%
- Hispanic origin (detail)
- Mexican 10% Puerto Rican 1%
- Common ancestry
- Italian 2% Slovak 1% Iranian 1%
- Foreign-born
- 4% · Canada
- Languages at home
- 86% English-only · Spanish 12%
Political lean MEDSL · Madison
- 2024 margin
- Strong R (+26.9) · D 35.6% · R 62.5% · Other 1.9%
- 2008→2024 swing
- -33.5pp toward R · 2008: 6.5pp · 2024: -26.9pp
- All cycles
- 2024: R+26.9 2020: R+22.6 2016: R+25.7 2012: R+4.5 2008: D+6.5
Not yet ingested
- Civics
- —
Market trends
- HPI YoY
- ▼ -11.12%
- Current HPI
- 302.7437
- Rent YoY
- ▲ 7.88%
- Metro
- Indianapolis-Carmel-Anderson, IN
- State GDP YoY
- ▲ 2.90%
- F500 in state
- 18
Industry mix (Fortune 500 HQ in IN)
| Industry | F500 HQs | Revenue |
|---|---|---|
| Industrial Machinery | 2 | $37B |
|
||
| Healthcare | 1 | $177B |
|
||
| Pharmaceuticals | 1 | $45B |
|
||
| Metals / Steel | 1 | $18B |
|
||
| Agriculture | 1 | $17B |
|
||
| Packaging | 1 | $12B |
|
||
Price history
+101.7% since first listed7 events — show timeline
- 2026-06-15 Price Changed $109,900 MIBOR as Distributed by MLS Grid
- 2026-05-09 Listed $119,900 MIBOR as Distributed by MLS Grid
- 2011-01-20 Listing Removed — MIBOR as Distributed by MLS Grid
- 2011-01-19 Sold (MLS) $15,000 MIBOR as Distributed by MLS Grid
- 2010-12-14 Listed $12,500 MIBOR as Distributed by MLS Grid
- 2005-07-29 Sold (MLS) $53,500 MIBOR as Distributed by MLS Grid
- 2005-04-12 Listed $54,500 MIBOR as Distributed by MLS Grid
Property tax history
+4.6%/yrLatest (2024): $1,160 · +8.7% YoY. Source: county tax records.
Cash-flow waterfall
monthlySold comps — $/sqft
last 12 mo · ≤1 miLoading sold comps…