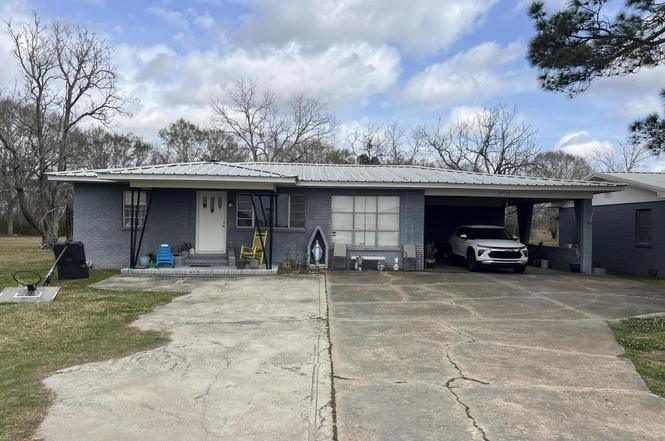
344 Ridge Rd · Lafayette, LA
Flood risk 6/10 · Moderate
- FEMA flood zone
- AE
- Chance of flooding over 30 yrs
- 0.75%
- Est. flood insurance / yr
- $1,737 – $8,500
Fire risk 3/10 · Minor
- Est. fire insurance / yr
- $1,269 – $2,357
Heat risk 8/10 · Major
- Hot days now (above 109°F)
- 7 days/yr
- Hot days in 30 yrs
- 20 days/yr
Wind risk 9/10 · Severe
- Chance of severe wind over 30 yrs
- 99.0%
Air-quality risk 1/10 · Minimal
- Unhealthy air days now
- 0 days/yr
- Unhealthy air days in 30 yrs
- 0 days/yr
Risk factors via First Street. Map © Google.
Why this score? — see what drove the B+ grade
The composite is a weighted blend of 9 inputs, each scored 0–100. Each bar is that input's sub-score; the figure is the points it added to the 100-point composite (weight × sub-score).
- Cash flow +30.0/30.0
- ARV discount +15.0/15.0
- DSCR +10.0/10.0
- 1% rule +8.7/10.0
- Schools +3.6/10.0
- Rent growth +3.5/5.0
- Livability +3.5/5.0
- Condition / age +2.5/5.0
- Appreciation +0.0/10.0
$135,000
🖨 Deal sheet 📄 Offer letter ✓ Due diligence
Listing remarks
Tucked into the heart of Lafayette, this charming 3-bedroom, 2-bath home is filled with warmth, character, and decades of cherished memories. From the moment you step inside, you can feel the stories held within its walls, family gatherings in the living room, holiday meals shared in the dining space, and quiet mornings filled with sunlight streaming through familiar windows. Thoughtfully and partially updated over the years, the home blends classic character with modern touches. Some rooms reflect fresh improvements, while others retain their original charm, offering the perfect opportunity to add your own style and vision. Each bedroom provides comfortable space and natural light, and the
Key facts
- 0.45 acre lot
- 2 parking spots
- Listed 25 days
Neighborhood map
What this means for you Summary
Snapshot
- This is a 3-bed/2.0-bath single-family listed at $135k.
Deal economics
- At list price, monthly cash flow is $186 ($2k/yr) — positive.
- The deal already cash-flows at list — no discount required.
- Meets the 1% rule at list price ($2k rent vs $135k).
- Recommended offer: $133k (1.5% below list) — sets the bar for market timing.
- Cap rate 11.7% vs local median 4.7% in Lafayette — top-decile yield for the area; either an underpriced asset or a hidden risk that comps aren't pricing in. Stress-test before assuming the spread holds.
Location & tenants
- Location reads 70/100 on livability (#63 in LA) — a middle-class / working-renter tenant base. Strengths: cost of living A+, housing A+, health & safety A+; Watch: amenities C-, employment C-, crime F.
- Lafayette Parish (urban): math 38% / reading 46% proficiency, ranked #19 of 98 in LA (top 19%) — families likely to look elsewhere, expect single-tenant / working-renter base with shorter leases.
- Zoned schools: Prairie Elementary School (math 45% / reading 55%, grade D+, #125 of 646 statewide, top 20%, 606 students, 55% FRL); Edgar Martin Middle School (math 40% / reading 53%, grade D+, #41 of 218 statewide, top 19%, 490 students, 59% FRL); Acadiana High School (math 31% / reading 29%, grade F, #125 of 265 statewide, top 47%, 1,813 students, 56% FRL) — zoned schools at 57% FRL track the district average.
- Market conditions: Rents rising fast (+4.1%/yr); 404 active listings in the ZIP; 20 comparable units currently listed for rent nearby; rentals at typical pace (median 21d on market — plan ~3-4 weeks tenant-placement turnaround); 1,585 units permitted in Lafayette Parish in 2024 (10 in 5+ unit buildings).
- This rent runs 39% of the median local income ($57k/yr) — at the standard rent-burdened threshold; future hikes will face affordability resistance.
Forward outlook
- Local home prices are declining (-3.0%/yr); year-one equity from $933 of loan paydown is wiped out by about $4k of value loss. Plan a longer hold.
- Lafayette County population projected at +34% by 2050 — long-run rental-demand tailwind backs the buy-and-hold thesis.
Negotiation context
- It's been on market 25 days — a 2% lower offer ($133k) is reasonable based on typical stale-listing flexibility.
- Current owner paid $88k; list at $135k implies a 53% gain — meaningful room to come down on a strong offer.
Risks & watch-outs
- Watch-outs: flood insurance adds $427/mo.
- Climate carrying-cost: in FEMA flood zone AE (mandatory federal flood insurance); severe wind risk, 99% chance of damaging wind over 30y; extreme-heat days projected 7→20/yr by 2055 (HVAC capex compounding) — expect insurance premiums to compound above CPI over the hold.
Questions for the listing agent
- What's the actual annual flood-insurance premium (NFIP or private), and is the property in a SFHA with mandatory coverage?
- Is there a deadline driving the sale (1031 exchange, divorce, estate, relocation)? That informs how much negotiation room exists.
- Schools are B-rated — typically a magnet for longer-tenancy family renters. What's the average tenant stay here, and is there a school-zone premium baked into asking?
- Crime grade is F in this area — have there been break-ins, vandalism, or insurance claims at this property in the last 3 years? What carrier currently insures it and at what premium?
- What's the average days-on-market for RENTAL listings here right now (not sales)? A rising rental-DOM trend means longer vacancies and softer asking-rent achievability than the comps imply.
- What's the recent tenant-quality profile in this submarket — average credit score on applications, eviction rate, late-payment / NSF rate, and stable-employment percentage? A property-management company in the area should have these aggregated.
- How much new for-sale + rental construction is in the pipeline within 1–3 miles? Heavy new supply typically softens prices + rents 12–24 months out; constrained supply supports both.
Investment metrics
- 1% rule
- 1.37% ✓
- Cap rate
- 11.74%
- Cash-on-cash
- 19.45%
- DSCR
- 1.87
- GRM
- 6.1
CMA / ARV
- ARV (on-the-fly)
- $237,432
- Comps found
- 12
Show comp detail 12 sales within ~0.75 mi
| Address | Dist | Beds/Ba | Sqft | Sold | Price | $/sf | Match |
|---|---|---|---|---|---|---|---|
| 344 Ridge Rd | 0.00mi | 3/2.0 | 1,522 (0%) | 1mo | $160,000 | $105 | 99 |
| 114 Betrillo Ct | 0.47mi | 3/2.0 | 1,613 (+6%) | 2mo | $251,119 | $156 | 67 |
| 135 Segovia Way | 0.31mi | 3/2.0 | 1,356 (-11%) | 1mo | $220,000 | $162 | 67 |
| 205 Brattle Ct | 0.69mi | 3/2.0 | 1,463 (-4%) | 0mo | $237,365 | $162 | 61 |
| 301 Wakely Ct | 0.61mi | 4/2.0 (+1) | 1,568 (+3%) | 2mo | $256,985 | $164 | 60 |
| 118 Brattle Ct | 0.63mi | 3/2.0 | 1,613 (+6%) | 1mo | $250,957 | $156 | 59 |
| 122 Segovia Way | 0.38mi | 3/2.0 | 1,735 (+14%) | 0mo | $253,000 | $146 | 58 |
| 106 Braddish Ct | 0.57mi | 3/2.0 | 1,659 (+9%) | 2mo | $256,996 | $155 | 57 |
| 108 Brattle Ct | 0.72mi | 3/2.0 | 1,613 (+6%) | 1mo | $250,997 | $156 | 55 |
| 203 Brattle Ct | 0.69mi | 3/2.0 | 1,629 (+7%) | 2mo | $250,916 | $154 | 55 |
| 113 Wakely Ct | 0.75mi | 3/2.0 | 1,356 (-11%) | 1mo | $227,077 | $167 | 46 |
| 220 Vagabond Way | 0.48mi | 4/2.5 (+1) | 1,738 (+14%) | 2mo | $256,800 | $148 | 45 |
Match score weights: distance 35% · size 25% · config 20% · recency 20%. Top-matched comps best support the ARV.
Projected returns pro-forma
-3.0% appreciation · 4.12% rent growth · sell at horizon
- IRR
- -5.4%
- Equity multiple
- 0.80×
- Total profit
- $-7,663
- Equity at exit
- $20,129
- IRR
- 6.1%
- Equity multiple
- 1.49×
- Total profit
- $18,432
- Equity at exit
- $11,672
Cash invested: $37,800 (down + closing). Projections, not guarantees.
Landlord ↔ Tenant lean methodology
- Overall (STATE)
- 90 Strongly Landlord-Friendly
- State Louisiana
- 90 Strongly Landlord-Friendly · R+12
- County
- — inherits STATE
- City
- — inherits STATE
ZIP-level market 70506
- Home prices YoY
- -34.8%
- Rents YoY
- 4.1%
- Active inventory
- 404
- Price-to-rent
- 6.1×
Monthly cashflow live
- Estimated rent
- $1,851 high interval (Pro) →
- Mortgage (P&I)
- −$708
- Tax from tax record
- −$86 /mo · $1,027/yr
- Insurance
- −$56
- Flood insurance flood zone
- −$427 /mo · $5,118/yr
- HOA
- −$0
- Vacancy / Maint / Mgmt
- −$389
- Net cashflow
- $186
Break-even live
UW: 25.0% down · 7.5% · 30yr · 1.5% tax · 5.0% vac · 8.0% maint · 8.0% mgmt
Financing live
Cash to close
- Down payment
- $33,750
- Closing costs
- $4,050
- Reserves months
- —
- Total cash needed
- —
Loan-product check · same deal, 3 products live
Conventional
25% down · 7.5% · 30yr
- Down + closing
- —
- Monthly P&I
- —
- Monthly cashflow
- —
- DSCR
- —
- Eligible?
- —
Personal DTI + credit; lowest rate.
DSCR
20% down · 8.5% · 30yr
- Down + closing
- —
- Monthly P&I
- —
- Monthly cashflow
- —
- DSCR
- —
- Eligible?
- —
No personal income docs; deal must DSCR.
Hard money
10% down · 12.0% · 12mo
- Down + closing
- —
- Monthly P&I
- —
- Monthly cashflow
- —
- DSCR
- —
- Eligible?
- —
Short-term bridge; refi at stabilization.
Rent comps 20 comps
| Address | Beds | Baths | Sqft | Rent | $/sqft | DOM | Units | Dist |
|---|---|---|---|---|---|---|---|---|
| 343 Ridge Rd Lafayette, LA | 2.0–3.0 | 2.0 | 1113 | $1,995 | $1.79 | 13d | 34 | 0.28mi |
| 118 Millie Park Lafayette, LA | 3.0 | 2.0 | 1200 | $1,750 | $1.46 | 21d | 1 | 0.57mi |
| 106 Braddish Ct Lafayette, LA | 3.0 | 2.0 | 1659 | $1,900 | $1.15 | 21d | 1 | 0.60mi |
| 221 Wakely CT Lafayette, LA | 3.0 | 2.0 | 1659 | $1,975 | $1.19 | 13d | 1 | 0.70mi |
| 1630 Rue du Belier Lafayette, LA | 1.0–3.0 | 1.0–2.0 | 1060 | $1,600 | $1.51 | 13d | 25 | 0.91mi |
| 6000 Johnston St Lafayette, LA | 1.0–3.0 | 1.0–2.0 | 1093 | $1,740 | $1.59 | 13d | 20 | 0.95mi |
| 300 Highland Dr Lafayette, LA | 4.0 | 2.0 | 2200 | $1,900 | $0.86 | 43d | 1 | 1.05mi |
| 108 Appleoak Ave Unit B Lafayette, LA | 2.0 | 2.5 | 1348 | $1,495 | $1.11 | 43d | 1 | 1.08mi |
| 104 Marblehead Ave Lafayette, LA | 2.0–3.0 | 2.0–2.5 | 1448 | $2,668 | $1.84 | 13d | 126 | 1.11mi |
| 304 Tall Meadows Ln Lafayette, LA | 3.0 | 2.0 | 1689 | $1,850 | $1.10 | 43d | 1 | 1.15mi |
| 327 Guidry Rd Lafayette, LA | 2.0 | 2.0 | 1060 | $1,350 | $1.27 | 21d | 1 | 1.17mi |
| 303 Tall Meadows Ln Lafayette, LA | 3.0 | 2.0 | 1522 | $2,000 | $1.31 | 21d | 1 | 1.18mi |
| 105 Alpine Meadows Ln Lafayette, LA | 3.0 | 2.0 | 1629 | $1,945 | $1.19 | 21d | 1 | 1.19mi |
| 110 Pilsbury Ln Lafayette, LA | 2.0 | 2.0 | 1150 | $1,595 | $1.39 | 21d | 1 | 1.24mi |
| 123 Highland Dr Lafayette, LA | 3.0 | 2.0 | 1550 | $1,700 | $1.10 | 21d | 1 | 1.25mi |
| 1100 Robley Dr Lafayette, LA | 1.0–3.0 | 1.0–2.0 | 1057 | $1,802 | $1.70 | 13d | 17 | 1.29mi |
| 307 Grassy Meadows Ln Lafayette, LA | 3.0 | 2.0 | 1603 | $2,200 | $1.37 | 21d | 1 | 1.29mi |
| 106 Maple Dr Lafayette, LA | 3.0 | 2.0 | 1800 | $2,100 | $1.17 | 13d | 1 | 1.32mi |
| 1200 Robley Dr Lafayette, LA | 1.0–3.0 | 1.0–2.0 | 965 | $1,674 | $1.73 | 13d | 18 | 1.33mi |
| 201 Castle Row Lafayette, LA | 3.0 | 2.0 | 1595 | $1,800 | $1.13 | 13d | 1 | 1.38mi |
Listing history 3 events
-
2026-03-25status Pending
-
2026-02-27$135,000 Active
-
2011-11-21soldstatus $88,500
ⓘ Source: listings_history table (triggers on properties + properties_extension) + one-shot
backfill from property_details.listing_events for pre-trigger history.
Tax reassessment forecast LA · Resets to sale price
- Current annual tax
- $1,027 · $86/mo
- Projected year-2 tax
- $1,027 · $86/mo
- Expected delta
- $0/yr ($0/mo · 0.0%)
ⓘ Screening estimate from a state-policy table — verify with the county assessor before closing.
Climate risk First Street
- Flood 6/10 Major FEMA zone AE · 75% chance over 30 yrs
- Wildfire 3/10 Moderate
- Heat 8/10 Severe 7 d/yr ≥109°F today · 20 d/yr by 30 yrs out
- Wind 9/10 Extreme 99% chance of damaging wind over 30 yrs
- Air quality 1/10 Low 0 unhealthy d/yr today · 0 by 30 yrs out
Nearby sold comps map
Loading sold comps map…
Walkable amenities ~0.75 mi
Loading nearby amenities…
Taxation est. · year 1
- Rental income
- $22,217
- − Mortgage interest
- −$7,562
- − Property taxes
- −$1,027
- − Insurance
- −$5,794
- − Repairs & maintenance
- −$1,777
- − Management
- −$1,777
- − Depreciation
- −$3,927
- Taxable income
- $352
- Est. tax owed @ 24.0%
- −$85
- After-tax cash flow
- $2,151/yr
For passive investors: Depreciation is non-cash, so a rental often shows a tax loss while cash-flowing — sheltering income. Rental losses are passive: they offset passive income freely, and up to $25,000/yr can offset ordinary (W-2) income if you actively participate and your MAGI is under $100k (phasing out to $0 by $150k); unused losses carry forward. On sale, claimed depreciation is recaptured at up to 25%, and gains may owe capital-gains tax (a 1031 exchange can defer both). Figures are a year-1 estimate at your 24.0% rate — not tax advice; consult a CPA.
Schools (NCES district)
- District
- Lafayette Parish
- NCES district ID
- 2200870
- Math proficiency
- 38% ▼ -32.00%
- Reading proficiency
- 46% ▼ -24.00%
- Median HH income
- $50,238
- Composite
- 36.15/100
- National rank
- #4741
- State rank
- #19 of 98 in LA
Livability — Lafayette
- Score
- 70/100
- State rank
- #63
- US rank
- #8133
Category grades
Schools grade is shown separately in the Schools card above.
Census & demographics
- County
- Lafayette Parish · 207,544 people
- City population
- 158,114
- Metro
- Lafayette, LA
- Population (ZIP)
- 42,318
- Household income
- $57,379
- Rent vs Own
- Severe rent burden
- 2095.0
Population outlook (Lafayette County) Hauer SSP2
- Today (2025)
- 280,930 people
- By 2030
- 301,092 · +7.2%
- By 2040
- 339,456 · +20.8%
- By 2050
- 375,156 · +33.5%
- By 2075
- 451,672 · +60.8%
- By 2100
- 497,203 · +77.0%
Race, ethnicity, and origin ACS 2023
- Neighborhood character
- Diverse neighborhood (Simpson 0.58)
- Race & ethnicity
- White 60% Black 20% Hispanic / Latino 13% Two or more races 13% Asian 3%
- Hispanic origin (detail)
- Mexican 4%
- Common ancestry
- Lithuanian 18% Armenian 1% Slovak 1%
- Foreign-born
- 12% · Canada, Vietnam
- Languages at home
- 83% English-only · Spanish 9% French/Haitian/Cajun 3% Vietnamese 1%
Political lean MEDSL · Lafayette
- 2024 margin
- Solid R (+31.4) · D 33.5% · R 64.8% · Other 1.7%
- 2008→2024 swing
- -0.1pp no change · 2008: -31.3pp · 2024: -31.4pp
- All cycles
- 2024: R+31.4 2020: R+28.7 2016: R+33.6 2012: R+33.7 2008: R+31.3
Not yet ingested
- Civics
- —
Market trends
- HPI YoY
- ▼ -75.28%
- Current HPI
- 140.8445
- Rent YoY
- ▲ 4.12%
- Metro
- Lafayette, LA
- State GDP YoY
- ▲ 3.29%
- F500 in state
- 10
Industry mix (Fortune 500 HQ in LA)
| Industry | F500 HQs | Revenue |
|---|---|---|
| Telecommunications | 2 | $23B |
|
||
| Utilities | 1 | $12B |
|
||
| Wholesale / Distribution | 1 | $5B |
|
||
| Advertising | 1 | $2B |
|
||
Price history
+52.5% since first listed3 events — show timeline
- 2026-03-25 Pending — AcadianaMLS
- 2026-02-27 Listed $135,000 AcadianaMLS
- 2011-11-21 Sold (Public Records) $88,500 Public Records
Property tax history
+2.1%/yrLatest (2025): $1,027 · -1.3% YoY. Source: county tax records.
Cash-flow waterfall
monthlySold comps — $/sqft
last 12 mo · ≤1 miLoading sold comps…