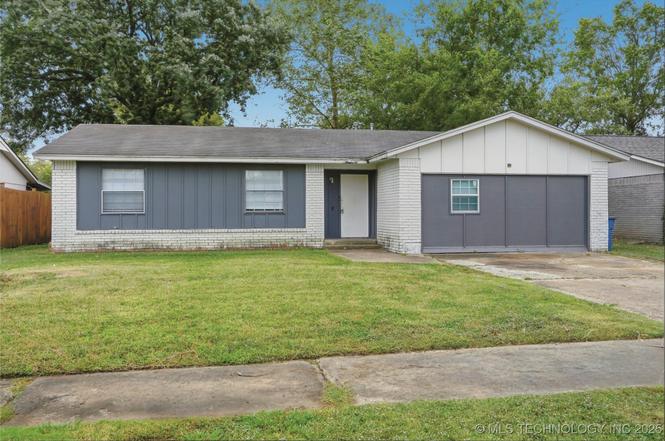
11502 E 37th St · Tulsa, OK
Flood risk 1/10 · Minimal
- FEMA flood zone
- X (unshaded)
- Chance of flooding over 30 yrs
- 0.0%
- Est. flood insurance / yr
- $473 – $860
Fire risk 1/10 · Minimal
- Est. fire insurance / yr
- $2,463 – $4,575
Heat risk 7/10 · Major
- Hot days now (above 110°F)
- 7 days/yr
- Hot days in 30 yrs
- 18 days/yr
Wind risk 2/10 · Minimal
- Chance of severe wind over 30 yrs
- 4.0%
Air-quality risk 2/10 · Minimal
- Unhealthy air days now
- 1 days/yr
- Unhealthy air days in 30 yrs
- 1 days/yr
Risk factors via First Street. Map © Google.
Why this score? — see what drove the C grade
The composite is a weighted blend of 9 inputs, each scored 0–100. Each bar is that input's sub-score; the figure is the points it added to the 100-point composite (weight × sub-score).
- Cash flow +24.8/30.0
- DSCR +8.0/10.0
- ARV discount +7.5/15.0
- 1% rule +6.4/10.0
- Livability +3.8/5.0
- Rent growth +2.6/5.0
- Condition / age +2.5/5.0
- Schools +1.8/10.0
- Appreciation +0.0/10.0
$132,000
🖨 Deal sheet 📄 Offer letter ✓ Due diligence
Listing remarks
Fantastic investment opportunity in the Union School District! This 4-bedroom, 1-bath home has been a successful rental and is now vacant and ready for its next chapter. Offering solid bones and great potential, it’s ideal for investors or homeowners looking to add value with a few updates. The property features a functional layout, spacious bedrooms, and a large yard perfect for outdoor enjoyment. Whether you’re seeking your next flip, rental addition, or personal home to customize and make your own.
Key facts
- Large yard
- Functional layout
- 7,000 sq ft lot
Tags
Property features AI
Exterior
- Parking: Garage (utility/garage area noted)
- Security: Smoke detector(s); No safety shelter
- Utilities: Public water; Public sewer; Electricity available; Natural gas available; Cable available; Phone available
- Home design: Single-story home; Faces north; Slab foundation
- Construction: Brick and wood frame construction; Asphalt/fiberglass roof; Built (year per public records)
- Exterior features: Patio; Shed(s); Full yard fencing
Interior
- Kitchen: Oven; Range/Stove; Dishwasher
- Bedrooms: Master bedroom with private bath (first level); Two additional bedrooms (first level)
- Flooring: Carpet; Tile; Wood veneer
- Bathrooms: One full bathroom with bathtub (hall, first level); Master bath with half bath configuration (first level)
- Heating & cooling: Gas heating; Gas water heater
- Interior features: Aluminum-framed windows; Gas range connection; Smoke detector(s)
- Laundry & utility: Washer hookup; Utility room in garage (first level)
Neighborhood map
What this means for you Summary
Snapshot
- This is a 4-bed/1.0-bath single-family listed at $132k.
Deal economics
- At list price, monthly cash flow is $279 ($3k/yr) — positive.
- The deal already cash-flows at list — no discount required.
- Meets the 1% rule at list price ($2k rent vs $132k).
- Recommended offer: $116k (12.0% below list) — sets the bar for market timing.
- Cap rate 8.8% vs local median 3.9% in Tulsa — top-decile yield for the area; either an underpriced asset or a hidden risk that comps aren't pricing in. Stress-test before assuming the spread holds.
Location & tenants
- Location reads 75/100 on livability (#13 in OK, #4,058 nationally) — a middle-class / working-renter tenant base. Strengths: amenities A+, commute A+, cost of living A+; Watch: schools F, crime F, employment D-.
- Union (urban): math 20% / reading 20% proficiency, ranked #160 of 270 in OK (top 59%) — low school quality limits family demand, transient renter base, plan for 1-2y turnover.
- Market conditions: Rents flat; 32 active listings in the ZIP; 8 comparable units currently listed for rent nearby; rentals at typical pace (median 24d on market — plan ~3-4 weeks tenant-placement turnaround); 2,818 units permitted in Tulsa County in 2024 (518 in 5+ unit buildings).
- This rent runs 38% of the median local income ($47k/yr) — at the standard rent-burdened threshold; future hikes will face affordability resistance.
Forward outlook
- Local home prices are declining (-3.0%/yr); year-one equity from $913 of loan paydown is wiped out by about $4k of value loss. Plan a longer hold.
- Tulsa County population projected at +30% by 2050 — long-run rental-demand tailwind backs the buy-and-hold thesis.
Negotiation context
- It's been on market 229 days — a 12% lower offer ($116k) is reasonable based on typical stale-listing flexibility.
- 7 sale attempts since 32y ago; this cycle's ask is 11378% above the opening price — seller raised mid-cycle; expect resistance to lowballs.
- Current owner paid $48k; list at $132k implies a 178% gain — meaningful room to come down on a strong offer.
Risks & watch-outs
- Climate carrying-cost: extreme-heat days projected 7→18/yr by 2055 (HVAC capex compounding) — expect insurance premiums to compound above CPI over the hold.
Questions for the listing agent
- It's been on market 229 days. Have you received any prior offers? Is the seller open to a 12% concession, seller financing, or rate buy-down credit?
- Built in 1975 — when were the roof, HVAC, electrical panel, plumbing, and water heater last replaced?
- Why hasn't it sold? Are there any deal-killer items the seller is aware of (foundation, flood, title, zoning, code violations)?
- Is there a deadline driving the sale (1031 exchange, divorce, estate, relocation)? That informs how much negotiation room exists.
- Schools are F-rated, which usually means shorter tenancies and higher turnover. Who's the typical renter profile here, and what's been the actual vacancy rate?
- Crime grade is F in this area — have there been break-ins, vandalism, or insurance claims at this property in the last 3 years? What carrier currently insures it and at what premium?
- What's the average days-on-market for RENTAL listings here right now (not sales)? A rising rental-DOM trend means longer vacancies and softer asking-rent achievability than the comps imply.
- What's the recent tenant-quality profile in this submarket — average credit score on applications, eviction rate, late-payment / NSF rate, and stable-employment percentage? A property-management company in the area should have these aggregated.
- How much new for-sale + rental construction is in the pipeline within 1–3 miles? Heavy new supply typically softens prices + rents 12–24 months out; constrained supply supports both.
Investment metrics
- 1% rule
- 1.14% ✓
- Cap rate
- 8.83%
- Cash-on-cash
- 9.05%
- DSCR
- 1.40
- GRM
- 7.3
CMA / ARV
No comps found within radius.
Projected returns pro-forma
-3.0% appreciation · 0.43% rent growth · sell at horizon
- IRR
- -5.5%
- Equity multiple
- 0.80×
- Total profit
- $-7,397
- Equity at exit
- $19,682
- IRR
- 0.8%
- Equity multiple
- 1.05×
- Total profit
- $1,756
- Equity at exit
- $11,413
Cash invested: $36,960 (down + closing). Projections, not guarantees.
Landlord ↔ Tenant lean methodology
- Overall (STATE)
- 83 Strongly Landlord-Friendly
- State Oklahoma
- 83 Strongly Landlord-Friendly · R+20
- County
- — inherits STATE
- City
- — inherits STATE
ZIP-level market 74146
- Rents YoY
- 0.4%
- Active inventory
- 32
- Price-to-rent
- 7.3×
Monthly cashflow live
- Estimated rent
- $1,501 high interval (Pro) →
- Mortgage (P&I)
- −$692
- Tax from tax record
- −$160 /mo · $1,915/yr
- Insurance
- −$55
- HOA
- −$0
- Vacancy / Maint / Mgmt
- −$315
- Net cashflow
- $279
Break-even live
UW: 25.0% down · 7.5% · 30yr · 1.5% tax · 5.0% vac · 8.0% maint · 8.0% mgmt
Financing live
Cash to close
- Down payment
- $33,000
- Closing costs
- $3,960
- Reserves months
- —
- Total cash needed
- —
Loan-product check · same deal, 3 products live
Conventional
25% down · 7.5% · 30yr
- Down + closing
- —
- Monthly P&I
- —
- Monthly cashflow
- —
- DSCR
- —
- Eligible?
- —
Personal DTI + credit; lowest rate.
DSCR
20% down · 8.5% · 30yr
- Down + closing
- —
- Monthly P&I
- —
- Monthly cashflow
- —
- DSCR
- —
- Eligible?
- —
No personal income docs; deal must DSCR.
Hard money
10% down · 12.0% · 12mo
- Down + closing
- —
- Monthly P&I
- —
- Monthly cashflow
- —
- DSCR
- —
- Eligible?
- —
Short-term bridge; refi at stabilization.
Rent comps 8 comps
| Address | Beds | Baths | Sqft | Rent | $/sqft | DOM | Units | Dist |
|---|---|---|---|---|---|---|---|---|
| 3311 S 126th East Ave Tulsa, OK | 3.0 | 2.0 | 1395 | $1,650 | $1.18 | 23d | 1 | 0.79mi |
| 10149 E 32nd St Tulsa, OK | 3.0 | 1.5 | 1140 | $1,299 | $1.14 | 23d | 1 | 0.94mi |
| 2756 S 114th East Ave Tulsa, OK | 3.0 | 2.0 | 1120 | $1,650 | $1.47 | 23d | 1 | 0.97mi |
| 13102 E 30th St Tulsa, OK | 3.0 | 2.0 | 1190 | $1,395 | $1.17 | 23d | 1 | 1.30mi |
| 13102 E 30th St Tulsa, OK | 3.0 | 2.0 | 1190 | $1,395 | $1.17 | 19d | 1 | 1.30mi |
| 2444 S 121st East Ave Tulsa, OK | 3.0 | 1.5 | 1168 | $1,395 | $1.19 | 23d | 1 | 1.31mi |
| 2319 S 119th East Ave Tulsa, OK | 3.0 | 1.0 | 990 | $1,365 | $1.38 | 23d | 1 | 1.39mi |
| 3208 S 137th East Ave Tulsa, OK | 3.0 | 2.0 | 1367 | $1,578 | $1.15 | 3d | 1 | 1.48mi |
Listing history 34 events
-
2026-06-18days on market $132,000 Active 229 DOM
-
2026-06-17days on market $132,000 Active 228 DOM
-
2026-06-16days on market $132,000 Active 227 DOM
-
2026-06-15days on market $132,000 Active 226 DOM
-
2026-06-13days on market $132,000 Active 224 DOM
-
2026-06-13pricedays on market $132,000 Active 223 DOM
-
2026-06-10days on market $153,000 Active 221 DOM
-
2026-06-09days on market $153,000 Active 220 DOM
-
2026-06-08days on market $153,000 Active 219 DOM
-
2026-06-07days on market $153,000 Active 218 DOM
-
2026-06-05days on market $153,000 Active 215 DOM
-
2026-06-03days on market $153,000 Active 214 DOM
-
2026-06-02days on market $153,000 Active 213 DOM
-
2026-06-01days on market $153,000 Active 212 DOM
-
2026-05-31days on market $153,000 Active 211 DOM
-
2026-05-06historical $1,150
-
2026-03-24price $153,000
-
2026-03-09$1,150
-
2025-11-01$160,000 Active
-
2015-11-24historical
-
2015-10-26price $65,000
-
2015-10-01price $76,000
-
2015-09-02price $80,000
-
2015-08-13$87,000 Active
-
2011-08-27historical
-
2011-02-28$78,300
-
2005-01-20historical
-
2004-10-20$79,900
-
2004-09-03soldstatus $47,500
-
2004-08-27soldstatus $47,500
-
2004-08-05historical
-
2004-03-24$53,900
-
1995-05-08soldstatus $50,000
-
1994-10-26$51,500
ⓘ Source: listings_history table (triggers on properties + properties_extension) + one-shot
backfill from property_details.listing_events for pre-trigger history.
Tax reassessment forecast OK · Resets to sale price
- Current annual tax
- $1,915 · $160/mo
- Projected year-2 tax
- $1,915 · $160/mo
- Expected delta
- $0/yr ($0/mo · 0.0%)
ⓘ Screening estimate from a state-policy table — verify with the county assessor before closing.
Climate risk First Street
- Flood 1/10 Low FEMA zone X (unshaded) · 0% chance over 30 yrs
- Wildfire 1/10 Low
- Heat 7/10 Severe 7 d/yr ≥110°F today · 18 d/yr by 30 yrs out
- Wind 2/10 Low 4% chance of damaging wind over 30 yrs
- Air quality 2/10 Low 1 unhealthy d/yr today · 1 by 30 yrs out
Nearby sold comps map
Loading sold comps map…
Walkable amenities ~0.75 mi
Loading nearby amenities…
Taxation est. · year 1
- Rental income
- $18,009
- − Mortgage interest
- −$7,394
- − Property taxes
- −$1,915
- − Insurance
- −$660
- − Repairs & maintenance
- −$1,441
- − Management
- −$1,441
- − Depreciation
- −$3,840
- Taxable income
- $1,319
- Est. tax owed @ 24.0%
- −$317
- After-tax cash flow
- $3,029/yr
For passive investors: Depreciation is non-cash, so a rental often shows a tax loss while cash-flowing — sheltering income. Rental losses are passive: they offset passive income freely, and up to $25,000/yr can offset ordinary (W-2) income if you actively participate and your MAGI is under $100k (phasing out to $0 by $150k); unused losses carry forward. On sale, claimed depreciation is recaptured at up to 25%, and gains may owe capital-gains tax (a 1031 exchange can defer both). Figures are a year-1 estimate at your 24.0% rate — not tax advice; consult a CPA.
Schools (NCES district)
- District
- Union
- NCES district ID
- 4030600
- Math proficiency
- 20% ▼ -9.00%
- Reading proficiency
- 20% ▼ -9.00%
- Median HH income
- $52,744
- Composite
- 18.18/100
- National rank
- #8962
- State rank
- #160 of 270 in OK
Livability — Tulsa
- Score
- 75/100
- State rank
- #13
- US rank
- #4058
Category grades
Schools grade is shown separately in the Schools card above.
Census & demographics
- Census place
- Tulsa, OK
- County
- Tulsa County · 640,811 people
- City population
- 389,418
- Metro
- Tulsa, OK
- Population (ZIP)
- 16,507
- Household income
- $46,865
- Rent vs Own
- Severe rent burden
- 755.0
Population outlook (Tulsa County) Hauer SSP2
- Today (2025)
- 723,846 people
- By 2030
- 766,033 · +5.8%
- By 2040
- 851,386 · +17.6%
- By 2050
- 938,389 · +29.6%
- By 2075
- 1,166,011 · +61.1%
- By 2100
- 1,350,277 · +86.5%
Race, ethnicity, and origin ACS 2023
- Neighborhood character
- Diverse neighborhood (Simpson 0.65)
- Race & ethnicity
- Hispanic / Latino 53% Two or more races 28% White 24% Black 13% Native American 4% Asian 3%
- Hispanic origin (detail)
- Mexican 40%
- Common ancestry
- Lithuanian 1% Slovak 1%
- Foreign-born
- 29% · Canada, Vietnam, Philippines
- Languages at home
- 47% English-only · Spanish 49% Other Asian/Pacific 1% Vietnamese 1%
Political lean MEDSL · Tulsa
- 2024 margin
- R (+15.2) · D 41.3% · R 56.5% · Other 2.2%
- 2008→2024 swing
- +9.2pp toward D · 2008: -24.5pp · 2024: -15.2pp
- All cycles
- 2024: R+15.2 2020: R+15.6 2016: R+22.9 2012: R+27.4 2008: R+24.5
Not yet ingested
- Civics
- —
Market trends
- HPI YoY
- ▼ -140.33%
- Current HPI
- 214.8226
- Rent YoY
- ▲ 0.43%
- Metro
- Tulsa, OK
- State GDP YoY
- ▲ 1.55%
- F500 in state
- 6
Industry mix (Fortune 500 HQ in OK)
| Industry | F500 HQs | Revenue |
|---|---|---|
| Energy | 3 | $48B |
|
||
Price history
-97.8% since first listed19 events — show timeline
- 2026-05-06 Rental Removed $1,150 APPFOLIO
- 2026-03-24 Price Changed $153,000 MLS Technology, Inc.
- 2026-03-09 Listed for Rent $1,150 APPFOLIO
- 2025-11-01 Listed $160,000 MLS Technology, Inc.
- 2015-11-24 Listing Removed — MLS Technology, Inc.
- 2015-10-26 Price Changed $65,000 MLS Technology, Inc.
- 2015-10-01 Price Changed $76,000 MLS Technology, Inc.
- 2015-09-02 Price Changed $80,000 MLS Technology, Inc.
- 2015-08-13 Listed $87,000 MLS Technology, Inc.
- 2011-08-27 Listing Removed — MLS Technology, Inc.
- 2011-02-28 Listed $78,300 MLS Technology, Inc.
- 2005-01-20 Listing Removed — MLS Technology, Inc.
- 2004-10-20 Listed $79,900 MLS Technology, Inc.
- 2004-09-03 Sold (Public Records) $47,500 Public Records
- 2004-08-27 Sold (MLS) $47,500 MLS Technology, Inc.
- 2004-08-05 Listing Removed — MLS Technology, Inc.
- 2004-03-24 Listed $53,900 MLS Technology, Inc.
- 1995-05-08 Sold (Public Records) $50,000 Public Records
- 1994-10-26 Listed $51,500 MLS Technology, Inc.
Property tax history
+6.2%/yrLatest (2025): $1,915 · +9.4% YoY. Source: county tax records.
Cash-flow waterfall
monthlySold comps — $/sqft
last 12 mo · ≤1 miLoading sold comps…