 🏢 Co-op
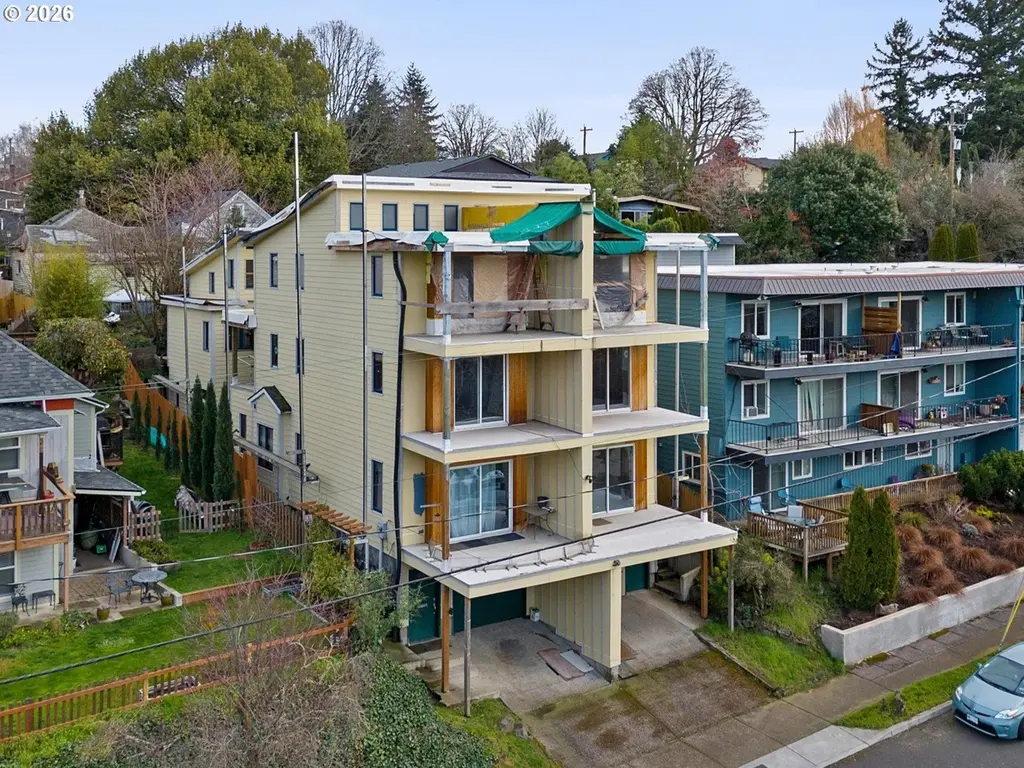
8527 N Edison St · Portland, OR
Flood risk 1/10 · Minimal
- FEMA flood zone
- X (unshaded)
- Chance of flooding over 30 yrs
- 0.0%
- Est. flood insurance / yr
- $473 – $860
Fire risk 1/10 · Minimal
- Est. fire insurance / yr
- $498 – $926
Heat risk 3/10 · Minor
- Hot days now (above 92°F)
- 7 days/yr
- Hot days in 30 yrs
- 14 days/yr
Wind risk 1/10 · Minimal
- Chance of severe wind over 30 yrs
- —
Air-quality risk 9/10 · Severe
- Unhealthy air days now
- 12 days/yr
- Unhealthy air days in 30 yrs
- 12 days/yr
Risk factors via First Street. Map © Google.
Why this score? — see what drove the C- grade
The composite is a weighted blend of 9 inputs, each scored 0–100. Each bar is that input's sub-score; the figure is the points it added to the 100-point composite (weight × sub-score).
- Cash flow +15.1/30.0
- ARV discount +15.0/15.0
- Schools +4.7/10.0
- DSCR +4.6/10.0
- 1% rule +4.2/10.0
- Livability +3.9/5.0
- Condition / age +3.8/5.0
- Rent growth +3.0/5.0
- Appreciation +0.0/10.0
$350,000
🖨 Deal sheet 📄 Offer letter ✓ Due diligence
Listing remarks MLS
Private: SERIOUS INQUIRES ONLY PLEASE. Call LA with questions or to request showing. Seller requests OREF Forms. NOTE: Sales price, and all data provided, is for a SINGLE home (8527 N Edison). Seller is willing to negotiate sale of both; will carry financing for 6 months or consider partnering. There are two separate tax lots (8531 & 8527 N Edison). Each home is 2,177 sq ft + 628 sq ft ADU. Construction is approx. 50% completed and dried-in. The two homes are mirror images and at the same stage of completion. See supplemental Promotional Flyer for more information. Great opportunity to create housing density, affordable housing, and/or creative living space in the heart of St. Johns! Visions include co-housing, cooperative living, low-income or mission-oriented housing, PadSplit, or single-family home with ADU rental income. Originally purchased as a two-level townhome, re-design was drafted by EMA Architects (2017), with eco-conscious quality construction by Birdsmouth. Originally built in 2001, the homes are to-the-stud remodels with ADU structures added in 2019. Eco-touches include Blue "Glo" windows and green roofs. Homes are enclosed and weather protected; needs interior and exterior finishing work + mechanical, electrical and plumbing. Associated with RMLS #789622051.
Key facts
- To-the-stud remodels
- Spectacular views
- Unique property
Tags
Neighborhood map
What this means for you Summary
Snapshot
- This is a 5-bed/5.0-bath townhouse listed at $350k. Condition is rated good.
Deal economics
- At list price, monthly cash flow is $113 ($1k/yr) — positive.
- The deal already cash-flows at list — no discount required.
- To meet the 1% rule (rent ≥ 1% of price), the offer needs to be $320k (8.4% below list).
- Recommended offer: $318k (9.0% below list) — sets the bar for market timing.
- Cap rate 6.7% vs local median 2.2% in Portland — top-decile yield for the area; either an underpriced asset or a hidden risk that comps aren't pricing in. Stress-test before assuming the spread holds.
Location & tenants
- Location reads 77/100 on livability (#72 in OR, #3,256 nationally) — a middle-class / working-renter tenant base. Strengths: amenities A+, commute A+, health & safety A+; Watch: crime F, cost of living F.
- Portland SD 1J (urban): math 46% / reading 58% proficiency, ranked #23 of 183 in OR (top 13%) — acceptable for families but not a draw, mixed tenant base, ~2y average lease.
- Market conditions: Rents rising (+2.1%/yr); 205 active listings in the ZIP; 4 comparable units currently listed for rent nearby; rentals lingering (median 44d on market — plan ~5-8 weeks vacancy on turnover, expect pricing pressure); 50% of comp listings sitting > 30 days — soft ceiling on asking rent; solid renter incomes; 2,041 units permitted in Multnomah County in 2024 (905 in 5+ unit buildings).
- At $3,205/mo this rent would consume 49% of the median local household income ($79k/yr) (locally 1401% of renters already pay >50% of income on rent) — very limited rent-growth headroom before tenants either downsize or default.
Forward outlook
- Local home prices are declining (-3.0%/yr); year-one equity from $2k of loan paydown is wiped out by about $10k of value loss. Plan a longer hold.
- Multnomah County population projected at +33% by 2050 — long-run rental-demand tailwind backs the buy-and-hold thesis.
Negotiation context
- It's been on market 97 days — a 9% lower offer ($318k) is reasonable based on typical stale-listing flexibility.
Questions for the listing agent
- It's been on market 97 days. Have you received any prior offers? Is the seller open to a 9% concession, seller financing, or rate buy-down credit?
- Why hasn't it sold? Are there any deal-killer items the seller is aware of (foundation, flood, title, zoning, code violations)?
- Is there a deadline driving the sale (1031 exchange, divorce, estate, relocation)? That informs how much negotiation room exists.
- Crime grade is F in this area — have there been break-ins, vandalism, or insurance claims at this property in the last 3 years? What carrier currently insures it and at what premium?
- What's the average days-on-market for RENTAL listings here right now (not sales)? A rising rental-DOM trend means longer vacancies and softer asking-rent achievability than the comps imply.
- What's the recent tenant-quality profile in this submarket — average credit score on applications, eviction rate, late-payment / NSF rate, and stable-employment percentage? A property-management company in the area should have these aggregated.
- How much new for-sale + rental construction is in the pipeline within 1–3 miles? Heavy new supply typically softens prices + rents 12–24 months out; constrained supply supports both.
Investment metrics
- 1% rule
- 0.92% ✗
- Cap rate
- 6.68%
- Cash-on-cash
- 1.38%
- DSCR
- 1.06
- GRM
- 9.1
CMA / ARV
- ARV (median comp)
- $449,761
- List price
- $350,000
- Delta
- -22.18%
- Verdict
- UNDERPRICED
- Comps
- 3 within 1.0 mi
Projected returns pro-forma
-3.0% appreciation · 2.11% rent growth · sell at horizon
- IRR
- -15.1%
- Equity multiple
- 0.47×
- Total profit
- $-52,313
- Equity at exit
- $52,186
- IRR
- -8.0%
- Equity multiple
- 0.51×
- Total profit
- $-47,553
- Equity at exit
- $30,262
Cash invested: $98,000 (down + closing). Projections, not guarantees.
Landlord ↔ Tenant lean methodology
- Overall (CITY)
- 0 Strongly Tenant-Friendly
- State Oregon
- 28 Tenant-Leaning · D+6
- County
- — inherits STATE
- City Portland
- 0 Strongly Tenant-Friendly · D+39
ZIP-level market 97203
- Rents YoY
- 2.1%
- Active inventory
- 205
- Price-to-rent
- 9.1×
Monthly cashflow live
- Estimated rent
- $3,205 medium interval (Pro) →
- Mortgage (P&I)
- −$1,835
- Tax est. 1.5%
- −$438 /mo · $5,250/yr
- Insurance
- −$146
- HOA
- −$0
- Vacancy / Maint / Mgmt
- −$673
- Net cashflow
- $113
Break-even live
UW: 25.0% down · 7.5% · 30yr · 1.5% tax · 5.0% vac · 8.0% maint · 8.0% mgmt
Financing live
Cash to close
- Down payment
- $87,500
- Closing costs
- $10,500
- Reserves months
- —
- Total cash needed
- —
Loan-product check · same deal, 3 products live
Conventional
25% down · 7.5% · 30yr
- Down + closing
- —
- Monthly P&I
- —
- Monthly cashflow
- —
- DSCR
- —
- Eligible?
- —
Personal DTI + credit; lowest rate.
DSCR
20% down · 8.5% · 30yr
- Down + closing
- —
- Monthly P&I
- —
- Monthly cashflow
- —
- DSCR
- —
- Eligible?
- —
No personal income docs; deal must DSCR.
Hard money
10% down · 12.0% · 12mo
- Down + closing
- —
- Monthly P&I
- —
- Monthly cashflow
- —
- DSCR
- —
- Eligible?
- —
Short-term bridge; refi at stabilization.
Rent comps 4 comps
| Address | Beds | Baths | Sqft | Rent | $/sqft | DOM | Units | Dist |
|---|---|---|---|---|---|---|---|---|
| 9833 N Lombard St Unit 9833 Portland, OR | 5.0 | 2.0 | 1800 | $2,495 | $1.39 | 44d | 1 | 0.79mi |
| 9841 N Lombard St Portland, OR | 6.0 | 2.0 | 1800 | $3,600 | $2.00 | 44d | 1 | 0.80mi |
| 6144 N Willamette Blvd Portland, OR | 5.0 | 2.5 | 2400 | $3,750 | $1.56 | 20d | 1 | 1.16mi |
| 5719 N Yale St Portland, OR | 6.0 | 3.0 | 2850 | $3,695 | $1.30 | 8d | 1 | 1.34mi |
Listing history 14 events
-
2026-06-18days on market $350,000 Active 97 DOM
-
2026-06-17days on market $350,000 Active 96 DOM
-
2026-06-16days on market $350,000 Active 95 DOM
-
2026-06-15days on market $350,000 Active 94 DOM
-
2026-06-13days on market $350,000 Active 92 DOM
-
2026-06-09days on market $350,000 Active 88 DOM
-
2026-06-08days on market $350,000 Active 87 DOM
-
2026-06-07days on market $350,000 Active 86 DOM
-
2026-06-03days on market $350,000 Active 82 DOM
-
2026-06-02days on market $350,000 Active 81 DOM
-
2026-06-01days on market $350,000 Active 80 DOM
-
2026-05-31days on market $350,000 Active 79 DOM
-
2026-03-23price $350,000 1308-char remark
Show marketing remark (1308 chars)
Private: SERIOUS INQUIRES ONLY PLEASE. Call LA with questions or to request showing. Seller requests OREF Forms. NOTE: Sales price, and all data provided, is for a SINGLE home (8527 N Edison). Seller is willing to negotiate sale of both; will carry financing for 6 months or consider partnering. There are two separate tax lots (8531 & 8527 N Edison). Each home is 2,177 sq ft + 628 sq ft ADU. Construction is approx. 50% completed and dried-in. The two homes are mirror images and at the same stage of completion. See supplemental Promotional Flyer for more information. Great opportunity to create housing density, affordable housing, and/or creative living space in the heart of St. Johns! Visions include co-housing, cooperative living, low-income or mission-oriented housing, PadSplit, or single-family home with ADU rental income. Originally purchased as a two-level townhome, re-design was drafted by EMA Architects (2017), with eco-conscious quality construction by Birdsmouth. Originally built in 2001, the homes are to-the-stud remodels with ADU structures added in 2019. Eco-touches include Blue "Glo" windows and green roofs. Homes are enclosed and weather protected; needs interior and exterior finishing work + mechanical, electrical and plumbing. Associated with RMLS #789622051.
-
2026-03-13$395,000 Active 1308-char remark
Show marketing remark (1308 chars)
Private: SERIOUS INQUIRES ONLY PLEASE. Call LA with questions or to request showing. Seller requests OREF Forms. NOTE: Sales price, and all data provided, is for a SINGLE home (8527 N Edison). Seller is willing to negotiate sale of both; will carry financing for 6 months or consider partnering. There are two separate tax lots (8531 & 8527 N Edison). Each home is 2,177 sq ft + 628 sq ft ADU. Construction is approx. 50% completed and dried-in. The two homes are mirror images and at the same stage of completion. See supplemental Promotional Flyer for more information. Great opportunity to create housing density, affordable housing, and/or creative living space in the heart of St. Johns! Visions include co-housing, cooperative living, low-income or mission-oriented housing, PadSplit, or single-family home with ADU rental income. Originally purchased as a two-level townhome, re-design was drafted by EMA Architects (2017), with eco-conscious quality construction by Birdsmouth. Originally built in 2001, the homes are to-the-stud remodels with ADU structures added in 2019. Eco-touches include Blue "Glo" windows and green roofs. Homes are enclosed and weather protected; needs interior and exterior finishing work + mechanical, electrical and plumbing. Associated with RMLS #789622051.
ⓘ Source: listings_history table (triggers on properties + properties_extension) + one-shot
backfill from property_details.listing_events for pre-trigger history.
Climate risk First Street
- Flood 1/10 Low FEMA zone X (unshaded) · 0% chance over 30 yrs
- Wildfire 1/10 Low
- Heat 3/10 Moderate 7 d/yr ≥92°F today · 14 d/yr by 30 yrs out
- Wind 1/10 Low
- Air quality 9/10 Extreme 12 unhealthy d/yr today · 12 by 30 yrs out
Nearby sold comps map
Loading sold comps map…
Walkable amenities ~0.75 mi
Loading nearby amenities…
Taxation est. · year 1
- Rental income
- $38,458
- − Mortgage interest
- −$19,605
- − Property taxes
- −$5,250
- − Insurance
- −$1,750
- − Repairs & maintenance
- −$3,077
- − Management
- −$3,077
- − Depreciation
- −$10,182
- Taxable loss
- −$4,483
- Est. tax savings @ 24.0%
- +$1,076
- After-tax cash flow
- $2,432/yr
For passive investors: Depreciation is non-cash, so a rental often shows a tax loss while cash-flowing — sheltering income. Rental losses are passive: they offset passive income freely, and up to $25,000/yr can offset ordinary (W-2) income if you actively participate and your MAGI is under $100k (phasing out to $0 by $150k); unused losses carry forward. On sale, claimed depreciation is recaptured at up to 25%, and gains may owe capital-gains tax (a 1031 exchange can defer both). Figures are a year-1 estimate at your 24.0% rate — not tax advice; consult a CPA.
Condition & rehab AI · 12 photos
This property is in the middle of a moderate renovation, with the kitchen, bathrooms, roof, exterior, flooring, interior walls/paint, and systems under construction. Completing these areas will make the property move-in ready and suitable for both resale and rental.
Repairs flagged
- Major Exposed framing and plumbing — Structural and plumbing systems are incomplete
- Major Exposed electrical wiring — Electrical systems are incomplete
Value-add opportunities
- Both Complete the construction of the kitchen, bathrooms, roof, exterior, flooring, interior walls/paint, and systems. — Completing these areas will make the property move-in ready and suitable for both resale and rental
- Both Install energy-efficient windows and doors. — Energy-efficient windows and doors will improve energy efficiency and reduce utility costs
- Both Add landscaping and curb appeal features. — Landscaping and curb appeal will enhance the property's visual appeal and attract potential buyers/tenants
Renovation cost estimate screening
| Repair item | Severity | Est. cost |
|---|---|---|
| Exposed framing and plumbing · Structural and plumbing systems are incomplete | Major | $15,000–50,000 |
| Exposed electrical wiring · Electrical systems are incomplete | Major | $15,000–50,000 |
| Total estimated repair cost · 2 items | $30,000–100,000 |
Value-add ROI direction
- Both Complete the construction of the kitchen, bathrooms, roof, exterior, flooring, interior walls/paint, and systems. — Completing these areas will make the property move-in ready and suitable for both resale and rental ↑
- Both Install energy-efficient windows and doors. — Energy-efficient windows and doors will improve energy efficiency and reduce utility costs ↑
- Both Add landscaping and curb appeal features. — Landscaping and curb appeal will enhance the property's visual appeal and attract potential buyers/tenants ↑
ⓘ Cost ranges are severity-bucket heuristics (US national rule-of-thumb). Get contractor quotes + a written scope before underwriting a rehab budget.
Schools (NCES district)
- District
- Portland SD 1J
- NCES district ID
- 4110040
- Math proficiency
- 46% ▼ -2.00%
- Reading proficiency
- 58% ▼ -3.00%
- Median HH income
- $57,851
- Composite
- 47.1/100
- National rank
- #5112
- State rank
- #23 of 183 in OR
Livability — Portland
- Score
- 77/100
- State rank
- #72
- US rank
- #3256
Category grades
Schools grade is shown separately in the Schools card above.
Census & demographics
- Census place
- Portland, OR
- County
- Multnomah County · 786,692 people
- City population
- 774,334
- Metro
- Portland-Vancouver-Hillsboro, OR-WA
- Population (ZIP)
- 33,116
- Household income
- $78,660
- Rent vs Own
- Severe rent burden
- 1401.0
Population outlook (Multnomah County) Hauer SSP2
- Today (2025)
- 930,825 people
- By 2030
- 996,904 · +7.1%
- By 2040
- 1,121,379 · +20.5%
- By 2050
- 1,242,124 · +33.4%
- By 2075
- 1,464,431 · +57.3%
- By 2100
- 1,576,181 · +69.3%
Race, ethnicity, and origin ACS 2023
- Neighborhood character
- Diverse neighborhood (Simpson 0.65)
- Race & ethnicity
- White 55% Hispanic / Latino 17% Two or more races 16% Black 12% Asian 6% Native American 1% Pacific Islander 1%
- Hispanic origin (detail)
- Mexican 12%
- Common ancestry
- Italian 3% Portuguese 3% Slovak 3%
- Foreign-born
- 10% · Canada, China
- Languages at home
- 81% English-only · Spanish 11% Other Asian/Pacific 3% Other Indo-European 1%
Political lean MEDSL · Multnomah
- 2024 margin
- Solid D (+62.1) · D 79.3% · R 17.2% · Other 3.5%
- 2008→2024 swing
- +6.0pp toward D · 2008: 56.1pp · 2024: 62.1pp
- All cycles
- 2024: D+62.1 2020: D+61.3 2016: D+58.3 2012: D+54.9 2008: D+56.1
Not yet ingested
- Civics
- —
Market trends
- HPI YoY
- ▼ -356.36%
- Current HPI
- 348.4979
- Rent YoY
- ▲ 2.11%
- Metro
- Portland-Vancouver-Hillsboro, OR-WA
- State GDP YoY
- ▲ 2.05%
- F500 in state
- 2
Industry mix (Fortune 500 HQ in OR)
| Industry | F500 HQs | Revenue |
|---|---|---|
| Consumer Goods | 1 | $51B |
|
||
Price history
-11.4% since first listed2 events — show timeline
- 2026-03-23 Price Changed $350,000 RMLS
- 2026-03-13 Listed $395,000 RMLS
Cash-flow waterfall
monthlySold comps — $/sqft
last 12 mo · ≤1 miLoading sold comps…