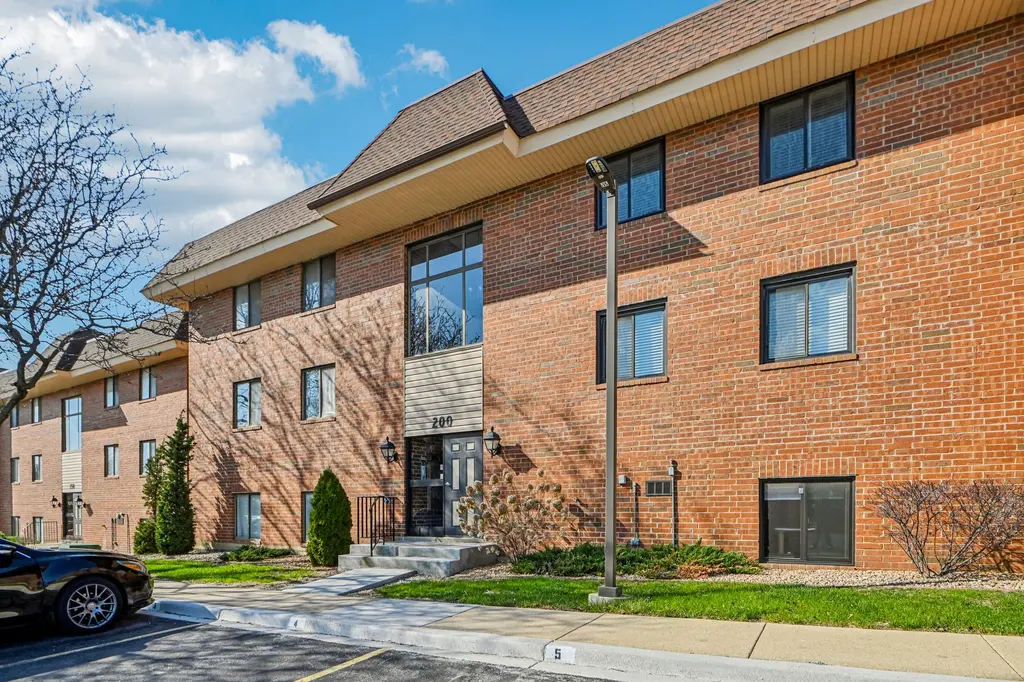
200 E Fountainview Ln Unit 2A · Lombard, IL
Flood risk 1/10 · Minimal
- FEMA flood zone
- X (unshaded)
- Chance of flooding over 30 yrs
- 0.0%
- Est. flood insurance / yr
- $507 – $1,088
Fire risk 1/10 · Minimal
- Est. fire insurance / yr
- $804 – $1,492
Heat risk 3/10 · Minor
- Hot days now (above 103°F)
- 7 days/yr
- Hot days in 30 yrs
- 14 days/yr
Wind risk 2/10 · Minimal
- Chance of severe wind over 30 yrs
- —
Air-quality risk 3/10 · Minor
- Unhealthy air days now
- 3 days/yr
- Unhealthy air days in 30 yrs
- 4 days/yr
Risk factors via First Street. Map © Google.
Why this score? — see what drove the D grade
The composite is a weighted blend of 9 inputs, each scored 0–100. Each bar is that input's sub-score; the figure is the points it added to the 100-point composite (weight × sub-score).
- Cash flow +12.0/30.0
- ARV discount +7.5/15.0
- 1% rule +5.4/10.0
- DSCR +3.6/10.0
- Schools +3.6/10.0
- Livability +3.6/5.0
- Rent growth +2.7/5.0
- Condition / age +2.5/5.0
- Appreciation +0.0/10.0
$240,000
🖨 Deal sheet (PDF) 📄 Offer letter ✓ Due diligence
Listing remarks MLS
Welcome Home... This beautifully renovated 2 Bed/2 Bath unit with breathtaking view from the spacious and secluded balcony. This 2nd floor airy & light filled unit features an open efficient kitchen with granite counters, breakfast bar, stainless steel appliances and pantry. This beautiful unit features a great size living room and a separate dining area, laminate wood floors throughout, sizable bedrooms with lots of closet space, master bedroom with ensuite master bath, remodeled guest bath, laundry in-unit, additional storage, parking included. Fantastic Location! Seconds to 88, 355, Yorktown Mall, Shops & Restaurants!
Key facts
- Private balcony
- Open-concept kitchen
- Convenient pantry
Tags
Property features AI
Finance
- Other: Tax exemptions: Homeowner
- HOA & community: Monthly association fee of $394; Association covers water, exterior maintenance, and lawn care; Storage available through association; Manager off-site; Pets allowed (cats and dogs) with maximum pet weight 20 lbs
Exterior
- Parking: One owned parking space
- Utilities: Water source: Lake Michigan; Public sewer
- Home design: Attached single condo; Entry level: 2; Condo ownership; Rehab completed in 2011
- Construction: Brick construction; Estimated living area; Building contains 6 units; Property age approximately 41–50 years; Not built before 1978
- Exterior features: Balcony; Common lot/dimensions
Interior
- Kitchen: Eating area with breakfast bar; Range; Dishwasher; Refrigerator
- Bedrooms: Master bedroom on main level with full bath; Second bedroom on main level (14 x 11); Two additional bedrooms listed
- Flooring: Wood laminate flooring in living areas, dining room, master and second bedroom
- Bathrooms: Two full bathrooms
- Heating & cooling: Electric forced air heating; Central air conditioning
- Interior features: Five total rooms; Separate dining room; Balcony/porch
- Laundry & utility: In-unit laundry (washer and dryer)
Neighborhood map
What this means for you Summary
Snapshot
- This is a 2-bed/2.0-bath condo listed at $240k.
Deal economics
- At list price, monthly cash flow is $-56 ($-673/yr) — negative.
- To cash-flow at today's rent, offer at most $230k (4.1% below list).
- Meets the 1% rule at list price ($3k rent vs $240k).
- Recommended offer: $230k (4.1% below list) — sets the bar for cash-flow.
- Cap rate 6.0% vs local median 3.7% in Lombard — top-decile yield for the area; either an underpriced asset or a hidden risk that comps aren't pricing in. Stress-test before assuming the spread holds.
Location & tenants
- Location reads 72/100 on livability (#314 in IL) — a middle-class / working-renter tenant base. Strengths: employment A+, housing A+, crime A-; Watch: cost of living C-, health & safety D+, amenities F.
- Glenbard Twp Hsd 87 (suburban): math 38% / reading 40% proficiency, ranked #126 of 620 in IL (top 20%) — families likely to look elsewhere, expect single-tenant / working-renter base with shorter leases.
- Zoned schools: Glenbard East High School (math 30% / reading 31%, grade F, #175 of 693 statewide, top 26%, 2,275 students, 0% FRL).
- Market conditions: Rents flat; 140 active listings in the ZIP; 21 comparable units currently listed for rent nearby; rentals leasing fast (median 0d on market — plan ~1-2 weeks tenant-placement turnaround); solid renter incomes; 1,378 units permitted in DuPage County in 2024 (594 in 5+ unit buildings).
Forward outlook
- Local home prices are declining (-3.0%/yr); year-one equity from $2k of loan paydown is wiped out by about $7k of value loss. Plan a longer hold.
Negotiation context
- It's been on market 32 days — a 3% lower offer ($233k) is reasonable based on typical stale-listing flexibility.
- 7 sale attempts since 14y ago with the ask held roughly flat each time — persistent listings suggest the price (not the market) is what's stuck; bring a comps-based counter.
- Current owner paid $195k; 23% above their basis — modest negotiation headroom, anchor on the comps not their cost.
Questions for the listing agent
- What do current leases actually rent for vs. the listed asking? Can we see a recent rent roll and the last 12 months of T-12 income?
- It's been on market 32 days. Have you received any prior offers? Is the seller open to a 4% concession, seller financing, or rate buy-down credit?
- What does the HOA fee cover, when was the last increase, and are there any pending special assessments or reserve-fund shortfalls?
- Any open or pending special assessments — roof, HVAC, plumbing, elevator, façade? What's the per-unit balance and payoff schedule, and is the seller paying it off at close or rolling it to the buyer?
- Is there a deadline driving the sale (1031 exchange, divorce, estate, relocation)? That informs how much negotiation room exists.
- Schools are B-rated — typically a magnet for longer-tenancy family renters. What's the average tenant stay here, and is there a school-zone premium baked into asking?
- The area grade is low — what's the realistic commute time and amenity access for the typical tenant pool here? Any planned neighborhood developments (good or bad) we should know about?
- What's the average days-on-market for RENTAL listings here right now (not sales)? A rising rental-DOM trend means longer vacancies and softer asking-rent achievability than the comps imply.
- What's the recent tenant-quality profile in this submarket — average credit score on applications, eviction rate, late-payment / NSF rate, and stable-employment percentage? A property-management company in the area should have these aggregated.
- How much new apartment / multifamily construction is in the pipeline within 1–3 miles? Heavy new supply (>2% of stock underway) typically softens rents 12–24 months out; light construction supports rent growth.
Investment metrics
- 1% rule
- 1.04% ✓
- Cap rate
- 6.01%
- Cash-on-cash
- -1.00%
- DSCR
- 0.96
- GRM
- 8.0
CMA / ARV
No comps found within radius.
Projected returns pro-forma
-3.0% appreciation · 0.94% rent growth · sell at horizon
- IRR
- -20.7%
- Equity multiple
- 0.30×
- Total profit
- $-47,287
- Equity at exit
- $35,785
- IRR
- -20.7%
- Equity multiple
- 0.04×
- Total profit
- $-64,733
- Equity at exit
- $20,751
Cash invested: $67,200 (down + closing). Projections, not guarantees.
Landlord ↔ Tenant lean methodology
- Overall (STATE)
- 43 Moderately Tenant-Leaning
- State Illinois
- 43 Moderately Tenant-Leaning · D+7
- County
- — inherits STATE
- City
- — inherits STATE
ZIP-level market 60148
- Rents YoY
- 0.9%
- Active inventory
- 140
- Price-to-rent
- 8.0×
Monthly cashflow live
- Estimated rent
- $2,508 high interval (Pro) →
- Mortgage (P&I)
- −$1,259
- Tax from tax record
- −$285 /mo · $3,417/yr
- Insurance
- −$100
- HOA
- −$394
- Vacancy / Maint / Mgmt
- −$527
- Net cashflow
- $-56
Break-even live
Sensitivity live
| Price | -10% $80 | -5% $12 | +0% $-56 | +5% $-124 | +10% $-192 |
|---|---|---|---|---|---|
| Rent | -10% $-254 | -5% $-155 | +0% $-56 | +5% $43 | +10% $142 |
| Rate | -1.0pp $65 | -0.5pp $5 | base $-56 | +0.5pp $-118 | +1.0pp $-182 |
UW: 25.0% down · 7.5% · 30yr · 1.5% tax · 5.0% vac · 8.0% maint · 8.0% mgmt
Financing live
Cash to close
- Down payment
- $60,000
- Closing costs
- $7,200
- Reserves months
- —
- Total cash needed
- —
Loan-product check · same deal, 3 products live
Conventional
25% down · 7.5% · 30yr
- Down + closing
- —
- Monthly P&I
- —
- Monthly cashflow
- —
- DSCR
- —
- Eligible?
- —
Personal DTI + credit; lowest rate.
DSCR
20% down · 8.5% · 30yr
- Down + closing
- —
- Monthly P&I
- —
- Monthly cashflow
- —
- DSCR
- —
- Eligible?
- —
No personal income docs; deal must DSCR.
Hard money
10% down · 12.0% · 12mo
- Down + closing
- —
- Monthly P&I
- —
- Monthly cashflow
- —
- DSCR
- —
- Eligible?
- —
Short-term bridge; refi at stabilization.
Rent comps 21 comps
| Address | Beds | Baths | Sqft | Rent | $/sqft | DOM | Units | Dist |
|---|---|---|---|---|---|---|---|---|
| 2233 S Highland Ave Lombard, IL | 2.0 | 1.0–2.0 | 858 | $2,561 | $2.98 | 0d | 48 | 0.23mi |
| 2001 S Highland Ave Lombard, IL | 2.0 | 2.0 | 740 | $1,750 | $2.36 | 8d | 1 | 0.29mi |
| 2720 S Highland Ave Lombard, IL | 1.0–3.0 | 1.0–2.0 | 1060 | $2,617 | $2.47 | 0d | 20 | 0.30mi |
| 95 Yorktown Shopping Ctr Lombard, IL | 1.0–3.0 | 1.0–2.0 | 1107 | $3,125 | $2.82 | 0d | 141 | 0.35mi |
| 2760 S Highland Ave Lombard, IL | 1.0–2.0 | 1.0–2.0 | 1056 | $3,234 | $3.06 | 0d | 9 | 0.37mi |
| 268 Gazebo Ln #38 Lombard, IL | 2.0 | 1.5 | 917 | $2,295 | $2.50 | 0d | 1 | 0.42mi |
| 268 Gazebo Ln #38 Lombard, IL | 2.0 | 1.5 | 917 | $2,295 | $2.50 | 21d | 1 | 0.42mi |
| 55 Yorktown Shopping Ctr Lombard, IL | 1.0–2.0 | 1.0–2.5 | 966 | $3,613 | $3.74 | 0d | 4 | 0.48mi |
| 50 Yorktown Shopping Ctr Lombard, IL | 1.0–2.0 | 1.0–2.0 | 1300 | $3,696 | $2.84 | 0d | 23 | 0.49mi |
| 50 Yorktown Shopping Ctr Unit 469 Lombard, IL | 1.0 | 1.0 | 888 | $2,474 | $2.79 | 0d | 1 | 0.49mi |
| 2015 S Finley Rd #408 Lombard, IL | 1.0 | 1.0 | 720 | $1,600 | $2.22 | 25d | 1 | 0.61mi |
| 2101 S Finley Rd Lombard, IL | 1.0–2.0 | 1.0–2.0 | 843 | $2,569 | $3.05 | 0d | 12 | 0.64mi |
| 450 Woodmoor Dr Lombard, IL | 2.0 | 1.0–2.0 | 953 | $3,194 | $3.35 | 0d | 16 | 0.81mi |
| 830 Foxworth Blvd Lombard, IL | 1.0–3.0 | 1.0–2.0 | 929 | $1,993 | $2.15 | 2d | 66 | 0.93mi |
| 1504 S Fairfield Ave Unit 25C Lombard, IL | 2.0 | 1.0 | 940 | $1,800 | $1.91 | 25d | 1 | 0.94mi |
| 2845 Easton St Downers Grove, IL | 2.0 | 1.0–2.5 | 1121 | $3,744 | $3.34 | 0d | 23 | 1.07mi |
| 1750 E 22nd St Lombard, IL | 2.0 | 2.0 | 920 | $1,882 | $2.05 | 0d | 1 | 1.10mi |
| 2003 S Meyers Rd Oakbrook Terrace, IL | 1.0–3.0 | 1.0–2.0 | 1227 | $3,211 | $2.62 | 0d | 7 | 1.16mi |
| 1300 S Finley Rd Lombard, IL | 1.0–3.0 | 1.0–2.0 | 1080 | $2,264 | $2.10 | 0d | 10 | 1.35mi |
| 1250 Old Bond Ct Unit 12501C Glen Ellyn, IL | 1.0 | 1.0 | 748 | $1,650 | $2.21 | 6d | 1 | 1.46mi |
| 1250 Old Bond Ct Unit 12301D Glen Ellyn, IL | 2.0 | 1.0 | 900 | $1,850 | $2.06 | 25d | 1 | 1.46mi |
HOA detail condo
- Monthly dues
- $394 · $4,728/yr
- Likely covers
- parking
- Assessments
- None detected in remarks — confirm with the listing agent.
Listing history 34 events
-
2026-06-08statusdays on market $240,000 Pending 32 DOM
-
2026-06-07days on market $240,000 Contingent - Continue to Show 31 DOM
-
2026-06-04days on market $240,000 Contingent - Continue to Show 28 DOM
-
2026-06-03days on market $240,000 Contingent - Continue to Show 27 DOM
-
2026-06-02days on market $240,000 Contingent - Continue to Show 26 DOM
-
2026-06-01days on market $240,000 Contingent - Continue to Show 25 DOM
-
2026-05-31days on market $240,000 Contingent - Continue to Show 24 DOM
-
2026-05-14historical Contingent - Continue to Show
-
2026-05-07$240,000 Active
-
2026-05-04historical Contingent - Continue to Show
-
2026-05-03historical
-
2026-04-25status Active
-
2026-04-23historical Contingent - Continue to Show
-
2022-07-11soldstatus $195,000
-
2022-07-01soldstatus $195,000 Closed 638-char remark
Show marketing remark (638 chars)
Welcome Home... This beautifully renovated 2 Bed/2 Bath unit with breathtaking view from the spacious and secluded balcony. This 2nd floor airy & light filled unit features an open efficient kitchen with granite counters, breakfast bar, stainless steel appliances and pantry. This beautiful unit features a great size living room and a separate dining area, laminate wood floors throughout, sizable bedrooms with lots of closet space, master bedroom with ensuite master bath, remodeled guest bath, laundry in-unit, additional storage, parking included. Fantastic Location! Seconds to 88, 355, Yorktown Mall, Shops & Restaurants!
-
2022-05-24historical Contingent - Continue to Show 638-char remark
Show marketing remark (638 chars)
Welcome Home... This beautifully renovated 2 Bed/2 Bath unit with breathtaking view from the spacious and secluded balcony. This 2nd floor airy & light filled unit features an open efficient kitchen with granite counters, breakfast bar, stainless steel appliances and pantry. This beautiful unit features a great size living room and a separate dining area, laminate wood floors throughout, sizable bedrooms with lots of closet space, master bedroom with ensuite master bath, remodeled guest bath, laundry in-unit, additional storage, parking included. Fantastic Location! Seconds to 88, 355, Yorktown Mall, Shops & Restaurants!
-
2022-05-13$210,000 Active 638-char remark
Show marketing remark (638 chars)
Welcome Home... This beautifully renovated 2 Bed/2 Bath unit with breathtaking view from the spacious and secluded balcony. This 2nd floor airy & light filled unit features an open efficient kitchen with granite counters, breakfast bar, stainless steel appliances and pantry. This beautiful unit features a great size living room and a separate dining area, laminate wood floors throughout, sizable bedrooms with lots of closet space, master bedroom with ensuite master bath, remodeled guest bath, laundry in-unit, additional storage, parking included. Fantastic Location! Seconds to 88, 355, Yorktown Mall, Shops & Restaurants!
-
2018-10-31soldstatus $145,000
-
2018-09-27soldstatus $145,000 Closed Sale
-
2018-09-17status Pending
-
2018-09-07historical Contingent
-
2018-08-30price $160,000
-
2018-07-19$175,000 New
-
2013-11-22soldstatus $74,000 Closed Sale
-
2013-10-18status Pending
-
2013-10-12historical Contingent
-
2013-10-03$69,999 New
-
2013-08-09historical
-
2013-03-21New
-
2012-07-10historical
-
2012-06-12New
-
2005-04-27soldstatus $160,000
-
1998-11-13soldstatus $87,000
-
1984-10-01soldstatus $54,000
ⓘ Source: listings_history table (triggers on properties + properties_extension) + one-shot
backfill from property_details.listing_events for pre-trigger history.
Tax reassessment forecast IL · Partial reset (capped growth)
- Current annual tax
- $3,417 · $285/mo
- Projected year-2 tax
- $4,432 · $369/mo
- Expected delta
- +$1,016/yr (+$85/mo · 29.7%)
ⓘ Screening estimate from a state-policy table — verify with the county assessor before closing.
Climate risk First Street
- Flood 1/10 Low FEMA zone X (unshaded) · 0% chance over 30 yrs
- Wildfire 1/10 Low
- Heat 3/10 Moderate 7 d/yr ≥103°F today · 14 d/yr by 30 yrs out
- Wind 2/10 Low
- Air quality 3/10 Moderate 3 unhealthy d/yr today · 4 by 30 yrs out
Nearby sold comps map
Loading sold comps map…
Walkable amenities ~0.75 mi
Loading nearby amenities…
Taxation est. · year 1
- Rental income
- $30,094
- − Mortgage interest
- −$13,444
- − Property taxes
- −$3,417
- − Insurance
- −$1,200
- − Repairs & maintenance
- −$2,408
- − Management
- −$2,408
- − HOA
- −$4,728
- − Depreciation
- −$6,982
- Taxable loss
- −$4,491
- Est. tax savings @ 24.0%
- +$1,078
- After-tax cash flow
- $405/yr
For passive investors: Depreciation is non-cash, so a rental often shows a tax loss while cash-flowing — sheltering income. Rental losses are passive: they offset passive income freely, and up to $25,000/yr can offset ordinary (W-2) income if you actively participate and your MAGI is under $100k (phasing out to $0 by $150k); unused losses carry forward. On sale, claimed depreciation is recaptured at up to 25%, and gains may owe capital-gains tax (a 1031 exchange can defer both). Figures are a year-1 estimate at your 24.0% rate — not tax advice; consult a CPA.
Schools (NCES district)
- District
- Glenbard Twp Hsd 87
- NCES district ID
- 1716830
- Math proficiency
- 38% ▼ -5.00%
- Reading proficiency
- 40% ▼ -4.00%
- Median HH income
- $79,535
- Composite
- 36.49/100
- National rank
- #4651
- State rank
- #126 of 620 in IL
Livability — Lombard
- Score
- 72/100
- State rank
- #314
- US rank
- #6205
Category grades
Schools grade is shown separately in the Schools card above.
Census & demographics
- Census place
- Lombard, IL
- County
- DuPage County · 904,569 people
- City population
- 52,596
- Metro
- Chicago-Naperville-Elgin, IL-IN-WI
- Population (ZIP)
- 52,596
- Household income
- $100,616
- Rent vs Own
- Severe rent burden
- 1539.0
Population outlook (DuPage County) Hauer SSP2
- Today (2025)
- 960,187 people
- By 2030
- 965,850 · +0.6%
- By 2040
- 965,812 · +0.6%
- By 2050
- 954,890 · -0.6%
- By 2075
- 910,185 · -5.2%
- By 2100
- 816,255 · -15.0%
Race, ethnicity, and origin ACS 2023
- Neighborhood character
- Predominantly White (66%)
- Race & ethnicity
- White 66% Hispanic / Latino 13% Asian 11% Two or more races 9% Black 6%
- Hispanic origin (detail)
- Mexican 9%
- Common ancestry
- Romanian 11% Italian 4% Iranian 2%
- Foreign-born
- 17% · Canada, China, South Korea
- Languages at home
- 75% English-only · Other Indo-European 9% Spanish 9% Russian/Polish/Slavic 3%
Political lean MEDSL · DuPage
- 2024 margin
- D (+13.3) · D 55.9% · R 42.5% · Other 1.6%
- 2008→2024 swing
- +2.5pp toward D · 2008: 10.8pp · 2024: 13.3pp
- All cycles
- 2024: D+13.3 2020: D+18.1 2016: D+14.1 2012: D+1.0 2008: D+10.8
Not yet ingested
- Civics
- —
Market trends
- HPI YoY
- ▼ -282.93%
- Current HPI
- 210.0801
- Rent YoY
- ▲ 0.94%
- Metro
- Chicago-Naperville-Elgin, IL-IN-WI
- State GDP YoY
- ▲ 1.59%
- F500 in state
- 60
Industry mix (Fortune 500 HQ in IL)
| Industry | F500 HQs | Revenue |
|---|---|---|
| Insurance | 4 | $201B |
|
||
| Consumer Goods | 4 | $87B |
|
||
| Industrial Machinery | 3 | $64B |
|
||
| Healthcare | 2 | $55B |
|
||
| Retail / Pharmacy | 1 | $148B |
|
||
| Agriculture / Food | 1 | $86B |
|
||
Price history
+344.4% since first listed27 events — show timeline
- 2026-05-14 Contingent — MRED as Distributed by MLS Grid
- 2026-05-07 Listed $240,000 MRED as Distributed by MLS Grid
- 2026-05-04 Contingent — MRED as Distributed by MLS Grid
- 2026-05-03 Listing Removed — MRED as Distributed by MLS Grid
- 2026-04-25 Relisted — MRED as Distributed by MLS Grid
- 2026-04-23 Contingent — MRED as Distributed by MLS Grid
- 2022-07-11 Sold (Public Records) $195,000 Public Records
- 2022-07-01 Sold (MLS) $195,000 MRED as Distributed by MLS Grid
- 2022-05-24 Contingent — MRED as Distributed by MLS Grid
- 2022-05-13 Listed $210,000 MRED as Distributed by MLS Grid
- 2018-10-31 Sold (Public Records) $145,000 Public Records
- 2018-09-27 Sold (MLS) $145,000 MRED as Distributed by MLS Grid
- 2018-09-17 Pending — MRED as Distributed by MLS Grid
- 2018-09-07 Contingent — MRED as Distributed by MLS Grid
- 2018-08-30 Price Changed $160,000 MRED as Distributed by MLS Grid
- 2018-07-19 Listed $175,000 MRED as Distributed by MLS Grid
- 2013-11-22 Sold (MLS) $74,000 MRED as Distributed by MLS Grid
- 2013-10-18 Pending — MRED as Distributed by MLS Grid
- 2013-10-12 Contingent — MRED as Distributed by MLS Grid
- 2013-10-03 Listed $69,999 MRED as Distributed by MLS Grid
- 2013-08-09 Listing Removed — MRED as Distributed by MLS Grid
- 2013-03-21 Listed — MRED as Distributed by MLS Grid
- 2012-07-10 Listing Removed — MRED as Distributed by MLS Grid
- 2012-06-12 Listed — MRED as Distributed by MLS Grid
- 2005-04-27 Sold (Public Records) $160,000 Public Records
- 1998-11-13 Sold (Public Records) $87,000 Public Records
- 1984-10-01 Sold (Public Records) $54,000 Public Records
Property tax history
+1.2%/yrLatest (2023): $3,417 · +3.9% YoY. Source: county tax records.
Cash-flow waterfall
monthlySold comps — $/sqft
last 12 mo · ≤1 miLoading sold comps…