27 Worcester · Bella Vista, AR
Flood risk 1/10 · Minimal
- FEMA flood zone
- X (unshaded)
- Chance of flooding over 30 yrs
- 0.0%
- Est. flood insurance / yr
- $507 – $1,088
Fire risk 3/10 · Minor
- Est. fire insurance / yr
- $1,499 – $2,785
Heat risk 4/10 · Minor
- Hot days now (above 104°F)
- 7 days/yr
- Hot days in 30 yrs
- 20 days/yr
Wind risk 2/10 · Minimal
- Chance of severe wind over 30 yrs
- 2.0%
Air-quality risk 2/10 · Minimal
- Unhealthy air days now
- 0 days/yr
- Unhealthy air days in 30 yrs
- 1 days/yr
Risk factors via First Street. Map © Google.
Why this score? — see what drove the C+ grade
The composite is a weighted blend of 9 inputs, each scored 0–100. Each bar is that input's sub-score; the figure is the points it added to the 100-point composite (weight × sub-score).
- Cash flow +17.7/30.0
- ARV discount +15.0/15.0
- Appreciation +5.7/10.0
- DSCR +5.6/10.0
- Schools +5.2/10.0
- 1% rule +3.5/10.0
- Livability +3.4/5.0
- Rent growth +2.5/5.0
- Condition / age +2.5/5.0
$299,999
🖨 Deal sheet 📄 Offer letter ✓ Due diligence
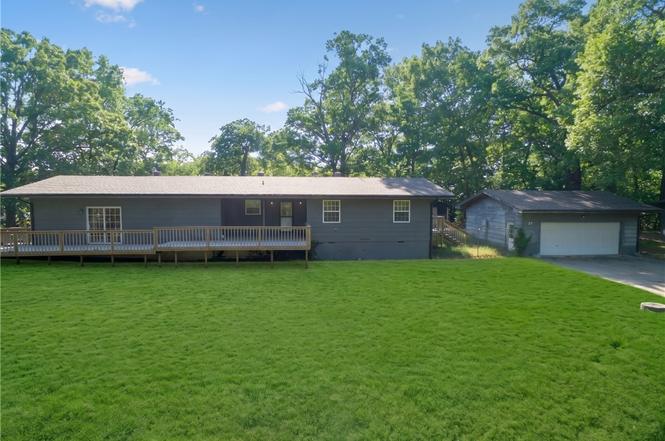
Listing remarks
Space, comfort, and functionality all in one! This property sits on a large corner lot with two driveways and features a detached, finished 2-car garage, providing plenty of parking. The home has been fully updated with interior cosmetic repairs, including freshly painted walls, trim, and doors, brand-new carpet, new ceiling fans, and updated flooring, giving it a clean and modern feel. The sewer conversion has already been completed, adding extra value and peace of mind for the future homeowner. Perfect for anyone who values space, practicality, and comfort in a well-located Bella Vista neighborhood!
Key facts
- Large corner lot
- New flooring
- Garage
Tags
Property features AI
Finance
- Other: Property is in a residential zone
- HOA & community: Monthly association fee (details: see agent); Community amenities include clubhouse, dock, pool, tennis courts, trails/paths, park, and nearby shopping
Exterior
- Parking: Detached 2-car garage with asphalt driveway and garage door opener
- Security: Smoke detector(s)
- Utilities: Public water; Septic (septic tank); Electricity available; Natural gas available; Cable available; Phone available
- Home design: Single-story home; Faces east; Fixer condition
- Construction: Frame construction; Asphalt shingle roof
- Exterior features: Deck; Cleared, landscaped corner lot; Near park and subdivision amenities; Sloped lot; Public road frontage
Interior
- Kitchen: Dishwasher; Microwave; Refrigerator; Garbage disposal; Electric water heater
- Bedrooms: Two main-level bedrooms (each about 11.8 x 11.8)
- Flooring: Carpet; Vinyl; Wood
- Bathrooms: Two full bathrooms
- Heating & cooling: Central heat and cooling; Electric heat; Heat pump; Baseboard heating
- Interior features: Double-pane vinyl windows; Walk-in closet(s); Storage
- Laundry & utility: Main-level utility/laundry rooms; Crawlspace basement
Neighborhood map
What this means for you Summary
Snapshot
- This is a 3-bed/2.0-bath single-family listed at $300k.
Deal economics
- At list price, monthly cash flow is $244 ($3k/yr) — positive.
- The deal already cash-flows at list — no discount required.
- To meet the 1% rule (rent ≥ 1% of price), the offer needs to be $254k (15.2% below list).
- Recommended offer: $254k (15.2% below list) — sets the bar for 1% rule.
- Cap rate 7.3% vs local median 3.6% in Bella Vista — top-decile yield for the area; either an underpriced asset or a hidden risk that comps aren't pricing in. Stress-test before assuming the spread holds.
Location & tenants
- Location reads 67/100 on livability (#111 in AR) — a middle-class / working-renter tenant base. Strengths: cost of living A+, housing A+, schools A; Watch: amenities F, commute F, health & safety F.
- Bentonville School District (urban): math 59% / reading 59% proficiency, ranked #3 of 238 in AR (top 1%) — acceptable for families but not a draw, mixed tenant base, ~2y average lease.
- Market conditions: 475 active listings in the ZIP; 4 comparable units currently listed for rent nearby; rentals leasing fast (median 14d on market — plan ~1-2 weeks tenant-placement turnaround); solid renter incomes; 4,359 units permitted in Benton County in 2024 (402 in 5+ unit buildings).
Forward outlook
- In year one you build about $6k of equity ($2k loan paydown + $4k appreciation (1.4% local appreciation)).
- Benton County population projected at +56% by 2050 — long-run rental-demand tailwind backs the buy-and-hold thesis.
- At projected returns (1.4% appreciation + 3.0% rent growth), your $84k cash investment doubles in ~8 years — after that, you're playing with house money.
- By year 6, paydown + projected appreciation supports a ~$34k cash-out refi (75% LTV) — recoverable capital for the next deal without selling this one.
Negotiation context
- It's been on market 143 days — a 12% lower offer ($264k) is reasonable based on typical stale-listing flexibility.
- Current owner paid $205k; 46% above their basis — modest negotiation headroom, anchor on the comps not their cost.
Questions for the listing agent
- It's been on market 143 days. Have you received any prior offers? Is the seller open to a 15% concession, seller financing, or rate buy-down credit?
- Built in 1972 — when were the roof, HVAC, electrical panel, plumbing, and water heater last replaced?
- Why hasn't it sold? Are there any deal-killer items the seller is aware of (foundation, flood, title, zoning, code violations)?
- Is there a deadline driving the sale (1031 exchange, divorce, estate, relocation)? That informs how much negotiation room exists.
- Schools are A-rated — typically a magnet for longer-tenancy family renters. What's the average tenant stay here, and is there a school-zone premium baked into asking?
- What's the average days-on-market for RENTAL listings here right now (not sales)? A rising rental-DOM trend means longer vacancies and softer asking-rent achievability than the comps imply.
- What's the recent tenant-quality profile in this submarket — average credit score on applications, eviction rate, late-payment / NSF rate, and stable-employment percentage? A property-management company in the area should have these aggregated.
- How much new for-sale + rental construction is in the pipeline within 1–3 miles? Heavy new supply typically softens prices + rents 12–24 months out; constrained supply supports both.
Investment metrics
- 1% rule
- 0.85% ✗
- Cap rate
- 7.27%
- Cash-on-cash
- 3.49%
- DSCR
- 1.16
- GRM
- 9.8
CMA / ARV
- ARV (on-the-fly)
- $434,304
- Comps found
- 12
Show comp detail 12 sales within ~0.75 mi
| Address | Dist | Beds/Ba | Sqft | Sold | Price | $/sf | Match |
|---|---|---|---|---|---|---|---|
| 55 Melbourn Dr | 0.42mi | 3/2.0 | 1,888 (+1%) | 3mo | $449,700 | $238 | 77 |
| 1 Glemsford Dr | 0.35mi | 4/2.0 (+1) | 1,912 (+2%) | 4mo | $439,900 | $230 | 72 |
| 1 Burwell Dr | 0.19mi | 4/2.0 (+1) | 2,050 (+10%) | 1mo | $499,000 | $243 | 69 |
| 6 Bishampton Ln | 0.15mi | 3/2.0 | 1,592 (-15%) | 5mo | $314,500 | $198 | 64 |
| 4 March Ln | 0.35mi | 4/2.5 (+1) | 1,711 (-9%) | 3mo | $396,950 | $232 | 60 |
| 5 Inskid Ln | 0.45mi | 3/2.0 | 1,640 (-12%) | 4mo | $362,000 | $221 | 55 |
| 19 Mildenhall Dr | 0.57mi | 3/2.0 | 1,664 (-11%) | 1mo | $359,950 | $216 | 54 |
| 57 Melbourn Dr | 0.44mi | 3/2.0 | 1,600 (-14%) | 2mo | $312,500 | $195 | 53 |
| 28 Haverhill Dr | 0.44mi | 2/2.0 (-1) | 1,640 (-12%) | 3mo | $180,000 | $110 | 51 |
| 2 Greenodd Dr | 0.72mi | 3/3.0 | 2,080 (+11%) | 5mo | $499,000 | $240 | 40 |
| 30 Westmorland Dr | 0.66mi | 4/2.5 (+1) | 1,673 (-11%) | 7mo | $392,950 | $235 | 38 |
| 4 Egton Dr | 0.71mi | 3/2.0 | 2,150 (+15%) | 4mo | $516,000 | $240 | 38 |
Match score weights: distance 35% · size 25% · config 20% · recency 20%. Top-matched comps best support the ARV.
Projected returns pro-forma
1.38% appreciation · 3.0% rent growth · sell at horizon
- IRR
- 6.1%
- Equity multiple
- 1.32×
- Total profit
- $26,710
- Equity at exit
- $108,467
- IRR
- 10.0%
- Equity multiple
- 2.26×
- Total profit
- $106,138
- Equity at exit
- $148,945
Cash invested: $84,000 (down + closing). Projections, not guarantees.
Landlord ↔ Tenant lean methodology
- Overall (STATE)
- 92 Strongly Landlord-Friendly
- State Arkansas
- 92 Strongly Landlord-Friendly · R+14
- County
- — inherits STATE
- City
- — inherits STATE
ZIP-level market 72714
- Home prices YoY
- 0.5%
- Active inventory
- 475
- Price-to-rent
- 9.8×
Monthly cashflow live
- Estimated rent
- $2,543 medium interval (Pro) →
- Mortgage (P&I)
- −$1,573
- Tax from tax record
- −$66 /mo · $798/yr
- Insurance
- −$125
- HOA
- −$0
- Vacancy / Maint / Mgmt
- −$534
- Net cashflow
- $244
Break-even live
UW: 25.0% down · 7.5% · 30yr · 1.5% tax · 5.0% vac · 8.0% maint · 8.0% mgmt
Financing live
Cash to close
- Down payment
- $75,000
- Closing costs
- $9,000
- Reserves months
- —
- Total cash needed
- —
Loan-product check · same deal, 3 products live
Conventional
25% down · 7.5% · 30yr
- Down + closing
- —
- Monthly P&I
- —
- Monthly cashflow
- —
- DSCR
- —
- Eligible?
- —
Personal DTI + credit; lowest rate.
DSCR
20% down · 8.5% · 30yr
- Down + closing
- —
- Monthly P&I
- —
- Monthly cashflow
- —
- DSCR
- —
- Eligible?
- —
No personal income docs; deal must DSCR.
Hard money
10% down · 12.0% · 12mo
- Down + closing
- —
- Monthly P&I
- —
- Monthly cashflow
- —
- DSCR
- —
- Eligible?
- —
Short-term bridge; refi at stabilization.
Rent comps 4 comps
| Address | Beds | Baths | Sqft | Rent | $/sqft | DOM | Units | Dist |
|---|---|---|---|---|---|---|---|---|
| 7 Ulverston Dr Bella Vista, AR | 3.0 | 2.0 | 2000 | $1,900 | $0.95 | 13d | 1 | 0.71mi |
| 16 Stretford Dr Bella Vista, AR | 4.0 | 3.0 | 2182 | $3,500 | $1.60 | 13d | 1 | 0.85mi |
| 1 Dent Ln Bella Vista, AR | 4.0 | 2.0 | 2215 | $2,850 | $1.29 | 13d | 1 | 1.31mi |
| 24 Pickering Dr Unit 1297038P Bella Vista, AR | 3.0 | 2.0 | 2497 | $2,040 | $0.82 | 14d | 1 | 1.35mi |
Listing history 21 events
-
2026-06-18days on market $299,999 Active 143 DOM
-
2026-06-17days on market $299,999 Active 142 DOM
-
2026-06-15days on market $299,999 Active 140 DOM
-
2026-06-14pricedays on market $299,999 Active 138 DOM
-
2026-06-10days on market $304,600 Active 135 DOM
-
2026-06-09days on market $304,600 Active 134 DOM
-
2026-06-08days on market $304,600 Active 133 DOM
-
2026-06-07days on market $304,600 Active 132 DOM
-
2026-06-05days on market $304,600 Active 129 DOM
-
2026-06-03days on market $304,600 Active 128 DOM
-
2026-06-02days on market $304,600 Active 127 DOM
-
2026-06-01remarks 608-char remark
-
2026-06-01days on market $304,600 Active 126 DOM
-
2026-05-31days on market $304,600 Active 125 DOM
-
2026-05-31days on market $304,600 Active 124 DOM
-
2026-05-21price $304,600
-
2026-04-10price $304,800
-
2026-03-17price $309,900
-
2026-01-26$310,000 Active
-
2025-12-22soldstatus $205,000
-
2001-12-26soldstatus $88,000
ⓘ Source: listings_history table (triggers on properties + properties_extension) + one-shot
backfill from property_details.listing_events for pre-trigger history.
Tax reassessment forecast AR · Resets to sale price
- Current annual tax
- $798 · $66/mo
- Projected year-2 tax
- $1,920 · $160/mo
- Expected delta
- +$1,122/yr (+$94/mo · 140.7%)
ⓘ Screening estimate from a state-policy table — verify with the county assessor before closing.
Climate risk First Street
- Flood 1/10 Low FEMA zone X (unshaded) · 0% chance over 30 yrs
- Wildfire 3/10 Moderate
- Heat 4/10 Moderate 7 d/yr ≥104°F today · 20 d/yr by 30 yrs out
- Wind 2/10 Low 2% chance of damaging wind over 30 yrs
- Air quality 2/10 Low 0 unhealthy d/yr today · 1 by 30 yrs out
Nearby sold comps map
Loading sold comps map…
Walkable amenities ~0.75 mi
Loading nearby amenities…
Taxation est. · year 1
- Rental income
- $30,517
- − Mortgage interest
- −$16,805
- − Property taxes
- −$798
- − Insurance
- −$1,500
- − Repairs & maintenance
- −$2,441
- − Management
- −$2,441
- − Depreciation
- −$8,727
- Taxable loss
- −$2,195
- Est. tax savings @ 24.0%
- +$527
- After-tax cash flow
- $3,459/yr
For passive investors: Depreciation is non-cash, so a rental often shows a tax loss while cash-flowing — sheltering income. Rental losses are passive: they offset passive income freely, and up to $25,000/yr can offset ordinary (W-2) income if you actively participate and your MAGI is under $100k (phasing out to $0 by $150k); unused losses carry forward. On sale, claimed depreciation is recaptured at up to 25%, and gains may owe capital-gains tax (a 1031 exchange can defer both). Figures are a year-1 estimate at your 24.0% rate — not tax advice; consult a CPA.
Schools (NCES district)
- District
- Bentonville School District
- NCES district ID
- 0503060
- Math proficiency
- 59% ▼ -8.00%
- Reading proficiency
- 59% ▼ -6.00%
- Median HH income
- $66,721
- Composite
- 51.85/100
- National rank
- #1661
- State rank
- #3 of 238 in AR
Livability — Bella Vista
- Score
- 67/100
- State rank
- #111
- US rank
- #11129
Category grades
Schools grade is shown separately in the Schools card above.
Census & demographics
- Census place
- Bella Vista, AR
- County
- Benton County · 259,241 people
- City population
- 31,638
- Metro
- Fayetteville-Springdale-Rogers, AR
- Population (ZIP)
- 14,350
- Household income
- $103,125
- Rent vs Own
- Severe rent burden
- 61.0
Population outlook (Benton County) Hauer SSP2
- Today (2025)
- 318,683 people
- By 2030
- 353,481 · +10.9%
- By 2040
- 425,280 · +33.4%
- By 2050
- 497,239 · +56.0%
- By 2075
- 662,114 · +107.8%
- By 2100
- 776,431 · +143.6%
Race, ethnicity, and origin ACS 2023
- Neighborhood character
- Predominantly White (83%)
- Race & ethnicity
- White 83% Two or more races 11% Hispanic / Latino 6%
- Hispanic origin (detail)
- Mexican 2% Dominican 2%
- Common ancestry
- Slovak 4% Lithuanian 3% Italian 3%
- Foreign-born
- 3% · Canada
- Languages at home
- 98% English-only · Spanish 2%
Political lean MEDSL · Benton
- 2024 margin
- Strong R (+27.0) · D 35.2% · R 62.1% · Other 2.7%
- 2008→2024 swing
- +9.6pp toward D · 2008: -36.5pp · 2024: -27.0pp
- All cycles
- 2024: R+27.0 2020: R+26.4 2016: R+34.9 2012: R+40.4 2008: R+36.5
Not yet ingested
- Civics
- —
Market trends
- HPI YoY
- ▲ 1.38%
- Current HPI
- 307.5796
- Rent YoY
- —
- Metro
- Fayetteville-Springdale-Rogers, AR
- State GDP YoY
- ▲ 3.80%
- F500 in state
- 10
Industry mix (Fortune 500 HQ in AR)
| Industry | F500 HQs | Revenue |
|---|---|---|
| Retail | 1 | $681B |
|
||
| Food / Agriculture | 1 | $53B |
|
||
| Retail / Energy | 1 | $22B |
|
||
| Transportation / Logistics | 1 | $12B |
|
||
| Energy | 1 | $4B |
|
||
Price history
+246.1% since first listed6 events — show timeline
- 2026-05-21 Price Changed $304,600 NWARMLS
- 2026-04-10 Price Changed $304,800 NWARMLS
- 2026-03-17 Price Changed $309,900 NWARMLS
- 2026-01-26 Listed $310,000 NWARMLS
- 2025-12-22 Sold (Public Records) $205,000 Public Records
- 2001-12-26 Sold (Public Records) $88,000 Public Records
Property tax history
-1.5%/yrLatest (2025): $798 · -10.3% YoY. Source: county tax records.
Cash-flow waterfall
monthlySold comps — $/sqft
last 12 mo · ≤1 miLoading sold comps…