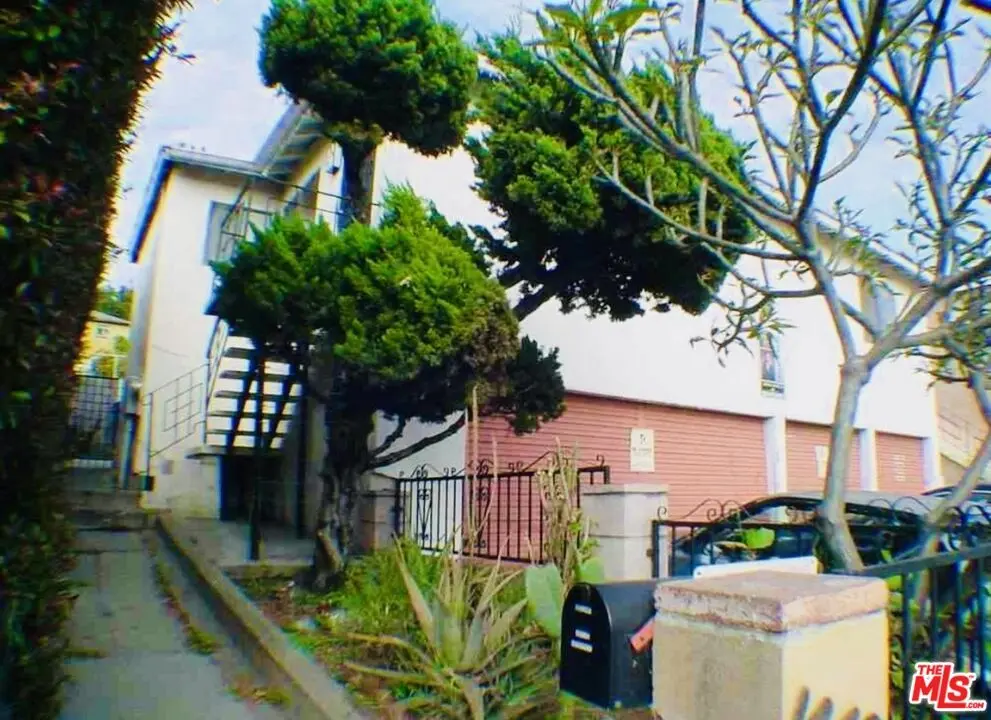
 Fourplex
1460 N Eastern Ave · East Los Angeles, CA
Flood risk 1/10 · Minimal
- FEMA flood zone
- X (unshaded)
- Chance of flooding over 30 yrs
- 0.0%
- Est. flood insurance / yr
- $507 – $1,088
Fire risk 1/10 · Minimal
- Est. fire insurance / yr
- $659 – $1,223
Heat risk 6/10 · Moderate
- Hot days now (above 95°F)
- 7 days/yr
- Hot days in 30 yrs
- 21 days/yr
Wind risk 1/10 · Minimal
- Chance of severe wind over 30 yrs
- —
Air-quality risk 6/10 · Moderate
- Unhealthy air days now
- 11 days/yr
- Unhealthy air days in 30 yrs
- 12 days/yr
Risk factors via First Street. Map © Google.
Why this score? — see what drove the D+ grade
The composite is a weighted blend of 9 inputs, each scored 0–100. Each bar is that input's sub-score; the figure is the points it added to the 100-point composite (weight × sub-score).
- Cash flow +15.1/30.0
- ARV discount +11.1/15.0
- DSCR +4.6/10.0
- 1% rule +3.8/10.0
- Schools +3.6/10.0
- Livability +3.0/5.0
- Condition / age +2.5/5.0
- Rent growth +1.7/5.0
- Appreciation +0.0/10.0
$899,000
🖨 Deal sheet 📄 Offer letter ✓ Due diligence
Multi-family units
County records classify this as Multi-Family (2-4 Unit). Listing-text estimate: 4 units. confirmed
Listing remarks
3 units, front house will be delivered vacant is 4bed/2bath plus 4 additional bedrooms converted from 4 car garage. Unit 1 is 1bed/1bath rented for $1,410, Unit 2 is 2bed + bonus room/1bath rented for $1,575. Additional 6 parking spaces on the lot. Do not disturb occupants!
Key facts
- 5,206 sq ft lot
- Garage
- Built 1924
Property features AI
Finance
- Other: Units configured as house plus 2 additional units; Scheduled as actual rents
- Financial info: Gross operating income: $96,000; Net operating income: $72,000; Total annual expenses: $24,000; Gross income reported as $96,000; Gross rent multiplier: 9.3; Projected/unit rents: Unit 1 $5,500; Unit 2 $2,750; Unit 3 $1,750; Actual/unit rents: Unit 2 $1,575; Unit 3 $1,410; Number of buildings: 2
- HOA & community: Complex contains 3 total units
Exterior
- Parking: Gated garage; Total of 10 parking spaces
- Utilities: Tenants pay gas, electric, and cable TV
- Home design: Residential income property; Multi-level (2 total floors)
- Construction: No construction details provided
- Exterior features: No other structures reported; Zoned LCR3*
Interior
- Kitchen: Gas/Electric range; Oven; Refrigerator
- Bedrooms: One unit with 8 bedrooms; One unit with 2 bedrooms; One unit with 1 bedroom
- Flooring: Hardwood floors
- Bathrooms: Unit with 8 bedrooms has 2 bathrooms; Unit with 2 bedrooms has 1 bathroom; Unit with 1 bedroom has 1 bathroom
- Heating & cooling: Central heat; Central cooling
- Interior features: Built-in storage/features; Central heating and cooling
- Laundry & utility: Laundry located inside; Gas dryer hookup
Neighborhood map
What this means for you Summary
Snapshot
- This is a 4 × 1-bed/?-bath units multifamily listed at $899k.
Deal economics
- At list price, monthly cash flow is $290 ($3k/yr) — positive. Per door: $73/mo.
- The deal already cash-flows at list — no discount required.
- To meet the 1% rule (rent ≥ 1% of price), the offer needs to be $788k (12.3% below list).
- Recommended offer: $788k (12.3% below list) — sets the bar for 1% rule.
- Cap rate 6.7% vs local median 3.7% in East Los Angeles — top-decile yield for the area; either an underpriced asset or a hidden risk that comps aren't pricing in. Stress-test before assuming the spread holds.
Location & tenants
- Location reads 60/100 on livability (#594 in CA) — a middle-class / working-renter tenant base. Strengths: commute A+, schools B+; Watch: employment C-, health & safety D, crime F.
- Los Angeles Unified (urban): math 29% / reading 54% proficiency, ranked #223 of 517 in CA (top 43%) — families likely to look elsewhere, expect single-tenant / working-renter base with shorter leases; 67% free/reduced lunch — lower-income household profile, screen leases tightly.
- Market conditions: Rents falling (-3.3%/yr); 80 active listings in the ZIP; 30 comparable units currently listed for rent nearby; rentals at typical pace (median 25d on market — plan ~3-4 weeks tenant-placement turnaround); 43% of comp listings sitting > 30 days — soft ceiling on asking rent; 19,697 units permitted in Los Angeles County in 2024 (9,426 in 5+ unit buildings).
- At $7,881/mo this rent would consume 130% of the median local household income ($73k/yr) (locally 1857% of renters already pay >50% of income on rent) — very limited rent-growth headroom before tenants either downsize or default.
Forward outlook
- Local home prices are declining (-3.0%/yr); year-one equity from $6k of loan paydown is wiped out by about $27k of value loss. Plan a longer hold.
- Los Angeles County population projected at +9% by 2050 — modest demand growth; plan on rents tracking national, not racing it.
Negotiation context
- It's been on market 44 days — a 3% lower offer ($872k) is reasonable based on typical stale-listing flexibility.
- 6 sale attempts since 4y ago; this cycle's ask is 16548% above the opening price — seller raised mid-cycle; expect resistance to lowballs.
Risks & watch-outs
- Watch-outs: built in 1924 — expect roof / HVAC / electrical / plumbing capex.
- Climate carrying-cost: extreme-heat days projected 7→21/yr by 2055 (HVAC capex compounding) — expect insurance premiums to compound above CPI over the hold.
Questions for the listing agent
- It's been on market 44 days. Have you received any prior offers? Is the seller open to a 12% concession, seller financing, or rate buy-down credit?
- Can we see the unit-by-unit rent roll, current vacancy, and any below-market leases? What's the average tenancy length?
- What capital expenditures (roof, boiler, parking lot, exteriors) have been made in the last 5 years, and what's planned in the next 2?
- Built in 1924 — when were the roof, HVAC, electrical panel, plumbing, and water heater last replaced?
- Is there a deadline driving the sale (1031 exchange, divorce, estate, relocation)? That informs how much negotiation room exists.
- Schools are B-rated — typically a magnet for longer-tenancy family renters. What's the average tenant stay here, and is there a school-zone premium baked into asking?
- Crime grade is F in this area — have there been break-ins, vandalism, or insurance claims at this property in the last 3 years? What carrier currently insures it and at what premium?
- The area grade is low — what's the realistic commute time and amenity access for the typical tenant pool here? Any planned neighborhood developments (good or bad) we should know about?
- What's the average days-on-market for RENTAL listings here right now (not sales)? A rising rental-DOM trend means longer vacancies and softer asking-rent achievability than the comps imply.
- What's the recent tenant-quality profile in this submarket — average credit score on applications, eviction rate, late-payment / NSF rate, and stable-employment percentage? A property-management company in the area should have these aggregated.
- How much new apartment / multifamily construction is in the pipeline within 1–3 miles? Heavy new supply (>2% of stock underway) typically softens rents 12–24 months out; light construction supports rent growth.
Investment metrics
- 1% rule
- 0.88% ✗
- Cap rate
- 6.68%
- Cash-on-cash
- 1.38%
- DSCR
- 1.06
- GRM
- 9.5
CMA / ARV
- ARV (median comp)
- $976,230
- List price
- $899,000
- Delta
- -7.91%
- Verdict
- FAIR
- Comps
- 20 within 1.0 mi
Projected returns pro-forma
-3.0% appreciation · 0.0% rent growth · sell at horizon
- IRR
- -17.4%
- Equity multiple
- 0.40×
- Total profit
- $-150,353
- Equity at exit
- $134,044
- IRR
- -16.0%
- Equity multiple
- 0.22×
- Total profit
- $-196,606
- Equity at exit
- $77,729
Cash invested: $251,720 (down + closing). Projections, not guarantees.
Landlord ↔ Tenant lean methodology
- Overall (STATE)
- 18 Strongly Tenant-Friendly
- State California
- 18 Strongly Tenant-Friendly · D+13
- County
- — inherits STATE
- City
- — inherits STATE
ZIP-level market 90063
- Rents YoY
- -3.3%
- Active inventory
- 80
- Price-to-rent
- 38.0×
Monthly cashflow live
- Estimated rent
- $7,881 medium interval (Pro) →
- Mortgage (P&I)
- −$4,714
- Tax from tax record
- −$847 /mo · $10,163/yr
- Insurance
- −$375
- HOA
- −$0
- Vacancy / Maint / Mgmt
- −$1,655
- Net cashflow
- $290
Break-even live
4-unit breakdown (identical units grouped — click to expand)
| Units | Beds | Baths | Est. rent |
|---|---|---|---|
| 4× units | 1 | — | $7,880 |
| #1 | 1 | — | $1,970 |
| #2 | 1 | — | $1,970 |
| #3 | 1 | — | $1,970 |
| #4 | 1 | — | $1,970 |
| Total (4 units) | $7,881 | ||
UW: 25.0% down · 7.5% · 30yr · 1.5% tax · 5.0% vac · 8.0% maint · 8.0% mgmt
Financing live
Cash to close
- Down payment
- $224,750
- Closing costs
- $26,970
- Reserves months
- —
- Total cash needed
- —
Loan-product check · same deal, 3 products live
Conventional
25% down · 7.5% · 30yr
- Down + closing
- —
- Monthly P&I
- —
- Monthly cashflow
- —
- DSCR
- —
- Eligible?
- —
Personal DTI + credit; lowest rate.
DSCR
20% down · 8.5% · 30yr
- Down + closing
- —
- Monthly P&I
- —
- Monthly cashflow
- —
- DSCR
- —
- Eligible?
- —
No personal income docs; deal must DSCR.
Hard money
10% down · 12.0% · 12mo
- Down + closing
- —
- Monthly P&I
- —
- Monthly cashflow
- —
- DSCR
- —
- Eligible?
- —
Short-term bridge; refi at stabilization.
Rent comps 30 comps
| Address | Beds | Baths | Sqft | Rent | $/sqft | DOM | Units | Dist |
|---|---|---|---|---|---|---|---|---|
| 1518 Norman Pl Los Angeles, CA | 2.0 | 1.5 | 950 | $2,499 | $2.63 | 43d | 1 | 0.27mi |
| 1846 Del Paso Ave Los Angeles, CA | 4.0 | 1.0 | 1272 | $3,800 | $2.99 | 24d | 1 | 0.77mi |
| 1562 Attridge Ave Los Angeles, CA | 2.0 | 2.0 | 899 | $3,500 | $3.89 | 43d | 1 | 0.80mi |
| 1192 Stringer Ave Los Angeles, CA | 2.0 | 1.0 | 882 | $3,395 | $3.85 | 7d | 1 | 0.82mi |
| 3111 W Ramona Rd Unit 3111C Alhambra, CA | 2.0 | 1.5 | 875 | $2,095 | $2.39 | 10d | 1 | 0.88mi |
| 4904 Ithaca Ave Unit 1 Los Angeles, CA | 3.0 | 2.0 | 1100 | $2,780 | $2.53 | 24d | 1 | 0.91mi |
| 4904 Ithaca Ave Unit 5 Los Angeles, CA | 3.0 | 2.0 | 1100 | $2,750 | $2.50 | 43d | 1 | 0.91mi |
| 612 N Brannick Ave Los Angeles, CA | 3.0 | 1.0 | 1615 | $3,450 | $2.14 | 43d | 1 | 1.04mi |
| 2357 N Eastern Ave Los Angeles, CA | 2.0 | 1.0 | 1033 | $3,400 | $3.29 | 43d | 1 | 1.11mi |
| 2817 Montezuma Ave Alhambra, CA | 3.0 | 2.0 | 1000 | $3,200 | $3.20 | 11d | 1 | 1.12mi |
| 2815 Montezuma Ave Alhambra, CA | 3.0 | 2.0 | 1150 | $3,200 | $2.78 | 10d | 1 | 1.13mi |
| 1801 W Garvey Ave Unit 323 Alhambra, CA | 2.0 | 1.0 | 950 | $2,792 | $2.94 | 1d | 1 | 1.15mi |
| 1801 Garvey Ave Alhambra, CA | 1.0–2.0 | 1.0 | 773 | $2,792 | $3.61 | 1d | 8 | 1.16mi |
| 2225 Meridian Ave Unit D Alhambra, CA | 2.0 | 1.5 | 900 | $2,525 | $2.81 | 43d | 1 | 1.17mi |
| 2100 Brightwood St Monterey Park, CA | 3.0 | 2.0 | 1472 | $3,950 | $2.68 | 1d | 1 | 1.20mi |
| 1226 N Alma Ave Los Angeles, CA | 2.0 | 1.0 | 892 | $2,600 | $2.91 | 43d | 1 | 1.21mi |
| 2721 Montezuma Ave Alhambra, CA | 4.0 | 2.0 | 1700 | $4,688 | $2.76 | 1d | 1 | 1.22mi |
| 1301 N Stone St Los Angeles, CA | 3.0 | 2.0 | 1369 | $4,200 | $3.07 | 24d | 1 | 1.23mi |
| 3261 City Terrace Dr Los Angeles, CA | 3.0 | 2.0 | 1353 | $2,850 | $2.11 | 43d | 1 | 1.23mi |
| 1142 N Alma Ave Los Angeles, CA | 3.0 | 2.0 | 1248 | $3,500 | $2.80 | 5d | 1 | 1.24mi |
| 2712 W Hellman Ave Alhambra, CA | 4.0 | 3.0 | 1740 | $4,200 | $2.41 | 1d | 1 | 1.29mi |
| 4091 San Carlos St Unit 4089 Los Angeles, CA | 2.0 | 1.0 | 1100 | $2,795 | $2.54 | 7d | 1 | 1.33mi |
| 3173 Fairmount St Los Angeles, CA | 3.0 | 2.0 | 1100 | $3,300 | $3.00 | 43d | 1 | 1.40mi |
| 2723 Ballard St Los Angeles, CA | 2.0 | 1.0 | 1408 | $3,500 | $2.49 | 43d | 1 | 1.41mi |
| 1542 Ricardo St Los Angeles, CA | 3.0 | 2.0 | 1600 | $3,500 | $2.19 | 43d | 1 | 1.46mi |
| 2308 S Fremont Ave Alhambra, CA | 3.0 | 2.0 | 1462 | $3,500 | $2.39 | 17d | 1 | 1.47mi |
| 2418 S Fremont Ave #10 Alhambra, CA | 2.0 | 2.5 | 1310 | $3,800 | $2.90 | 1d | 1 | 1.47mi |
| 1411 Tremont St Unit 2 Los Angeles, CA | 3.0 | 3.0 | 1400 | $3,795 | $2.71 | 3d | 1 | 1.49mi |
| 1419 Milton Ave Unit 1417 Alhambra, CA | 2.0 | 1.0 | 1000 | $2,925 | $2.92 | 43d | 1 | 1.49mi |
| 1419 Milton Ave Unit 1419 Alhambra, CA | 2.0 | 2.0 | 900 | $2,825 | $3.14 | 43d | 1 | 1.49mi |
Listing history 25 events
-
2026-06-18days on market $899,000 Active 44 DOM
-
2026-06-17days on market $899,000 Active 43 DOM
-
2026-06-16days on market $899,000 Active 42 DOM
-
2026-06-15days on market $899,000 Active 41 DOM
-
2026-06-13days on market $899,000 Active 39 DOM
-
2026-06-09days on market $899,000 Active 35 DOM
-
2026-06-08days on market $899,000 Active 34 DOM
-
2026-06-07days on market $899,000 Active 33 DOM
-
2026-06-04days on market $899,000 Active 30 DOM
-
2026-06-03days on market $899,000 Active 29 DOM
-
2026-06-02days on market $899,000 Active 28 DOM
-
2026-06-01days on market $899,000 Active 27 DOM
-
2026-05-31days on market $899,000 Active 26 DOM
-
2026-05-05$899,000 Active 274-char remark
-
2024-12-19historical $5,400
-
2024-10-26price $5,400
-
2024-10-25price $5,000
-
2024-10-19$5,400
-
2023-12-31historical
-
2023-11-18price $999,999
-
2023-11-16status Active
-
2023-09-27historical Active Under Contract
-
2023-03-14$1,150,000 Active
-
2022-12-31historical
-
2022-08-16$1,150,000 Active
ⓘ Source: listings_history table (triggers on properties + properties_extension) + one-shot
backfill from property_details.listing_events for pre-trigger history.
Tax reassessment forecast CA · Resets to sale price
- Current annual tax
- $10,163 · $847/mo
- Projected year-2 tax
- $10,163 · $847/mo
- Expected delta
- $0/yr ($0/mo · 0.0%)
ⓘ Screening estimate from a state-policy table — verify with the county assessor before closing.
Climate risk First Street
- Flood 1/10 Low FEMA zone X (unshaded) · 0% chance over 30 yrs
- Wildfire 1/10 Low
- Heat 6/10 Major 7 d/yr ≥95°F today · 21 d/yr by 30 yrs out
- Wind 1/10 Low
- Air quality 6/10 Major 11 unhealthy d/yr today · 12 by 30 yrs out
Nearby sold comps map
Loading sold comps map…
Walkable amenities ~0.75 mi
Loading nearby amenities…
Taxation est. · year 1
- Rental income
- $94,572
- − Mortgage interest
- −$50,358
- − Property taxes
- −$10,163
- − Insurance
- −$4,495
- − Repairs & maintenance
- −$7,566
- − Management
- −$7,566
- − Depreciation
- −$26,153
- Taxable loss
- −$11,729
- Est. tax savings @ 24.0%
- +$2,815
- After-tax cash flow
- $6,295/yr
For passive investors: Depreciation is non-cash, so a rental often shows a tax loss while cash-flowing — sheltering income. Rental losses are passive: they offset passive income freely, and up to $25,000/yr can offset ordinary (W-2) income if you actively participate and your MAGI is under $100k (phasing out to $0 by $150k); unused losses carry forward. On sale, claimed depreciation is recaptured at up to 25%, and gains may owe capital-gains tax (a 1031 exchange can defer both). Figures are a year-1 estimate at your 24.0% rate — not tax advice; consult a CPA.
Schools (NCES district)
- District
- Los Angeles Unified
- NCES district ID
- 0622710
- Math proficiency
- 29% ▼ -4.00%
- Reading proficiency
- 54% ▲ 10.00%
- Median HH income
- $50,403
- Composite
- 35.67/100
- National rank
- #4875
- State rank
- #223 of 517 in CA
Livability — East Los Angeles
- Score
- 60/100
- State rank
- #594
- US rank
- #19237
Category grades
Schools grade is shown separately in the Schools card above.
Census & demographics
- Census place
- East Los Angeles, CA
- County
- Los Angeles County · 9,444,647 people
- City population
- 108,740
- Metro
- Los Angeles-Long Beach-Anaheim, CA
- Population (ZIP)
- 48,397
- Household income
- $72,942
- Rent vs Own
- Severe rent burden
- 1857.0
Population outlook (Los Angeles County) Hauer SSP2
- Today (2025)
- 10,940,515 people
- By 2030
- 11,256,481 · +2.9%
- By 2040
- 11,729,929 · +7.2%
- By 2050
- 11,948,407 · +9.2%
- By 2075
- 11,818,114 · +8.0%
- By 2100
- 10,842,928 · -0.9%
Race, ethnicity, and origin ACS 2023
- Neighborhood character
- Predominantly Hispanic (94%)
- Race & ethnicity
- Hispanic / Latino 94% Two or more races 13% White 3% Native American 2% Asian 2%
- Hispanic origin (detail)
- Mexican 84%
- Foreign-born
- 40% · Canada, China
- Languages at home
- 17% English-only · Spanish 81%
Political lean MEDSL · Los Angeles
- 2024 margin
- Solid D (+32.9) · D 64.8% · R 31.9% · Other 3.3%
- 2008→2024 swing
- -7.4pp toward R · 2008: 40.4pp · 2024: 32.9pp
- All cycles
- 2024: D+32.9 2020: D+44.2 2016: D+48.0 2012: D+40.0 2008: D+40.4
Not yet ingested
- Civics
- —
Market trends
- HPI YoY
- ▼ -841.41%
- Current HPI
- 476.1519
- Rent YoY
- ▼ -3.30%
- Metro
- Los Angeles-Long Beach-Anaheim, CA
- State GDP YoY
- ▲ 3.21%
- F500 in state
- 116
Industry mix (Fortune 500 HQ in CA)
| Industry | F500 HQs | Revenue |
|---|---|---|
| Technology | 27 | $1,492B |
|
||
| Financial Services | 3 | $174B |
|
||
| Retail | 3 | $44B |
|
||
| Insurance | 3 | $26B |
|
||
| Media / Entertainment | 2 | $115B |
|
||
| Pharmaceuticals / Biotech | 2 | $62B |
|
||
Price history
-99.5% since first listed13 events — show timeline
- 2026-06-03 Listed for Rent $5,400 TURBOTENANT
- 2026-05-05 Listed $899,000 TheMLS
- 2024-12-19 Rental Removed $5,400 TURBOTENANT
- 2024-10-26 Price Changed $5,400 TURBOTENANT
- 2024-10-25 Price Changed $5,000 TURBOTENANT
- 2024-10-19 Listed for Rent $5,400 TURBOTENANT
- 2023-12-31 Listing Removed — CRMLS
- 2023-11-18 Price Changed $999,999 CRMLS
- 2023-11-16 Relisted — CRMLS
- 2023-09-27 Contingent — CRMLS
- 2023-03-14 Listed $1,150,000 CRMLS
- 2022-12-31 Listing Removed — CRMLS
- 2022-08-16 Listed $1,150,000 CRMLS
Property tax history
+10.6%/yrLatest (2025): $10,163 · +279.2% YoY. Source: county tax records.
Cash-flow waterfall
monthlySold comps — $/sqft
last 12 mo · ≤1 miLoading sold comps…