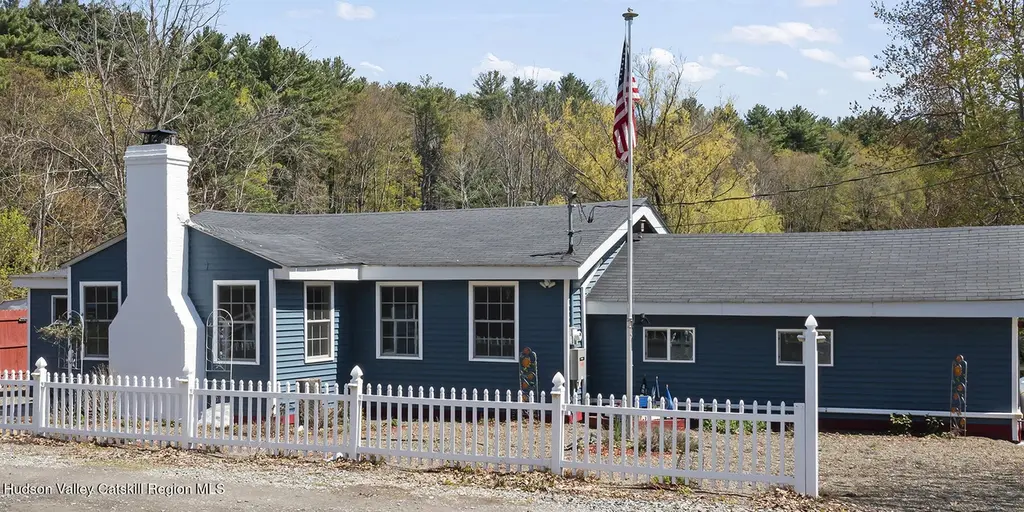
16 Robin Rd · Copake Lake, NY
Flood risk 1/10 · Minimal
- FEMA flood zone
- X
- Chance of flooding over 30 yrs
- 0.0%
- Est. flood insurance / yr
- $473 – $860
Fire risk 4/10 · Minor
- Est. fire insurance / yr
- $691 – $1,283
Heat risk 3/10 · Minor
- Hot days now (above 95°F)
- 7 days/yr
- Hot days in 30 yrs
- 16 days/yr
Wind risk 4/10 · Minor
- Chance of severe wind over 30 yrs
- 11.0%
Air-quality risk 2/10 · Minimal
- Unhealthy air days now
- 1 days/yr
- Unhealthy air days in 30 yrs
- 2 days/yr
Risk factors via First Street. Map © Google.
Why this score? — see what drove the A- grade
The composite is a weighted blend of 9 inputs, each scored 0–100. Each bar is that input's sub-score; the figure is the points it added to the 100-point composite (weight × sub-score).
- Cash flow +28.6/30.0
- ARV discount +15.0/15.0
- DSCR +10.0/10.0
- Appreciation +10.0/10.0
- 1% rule +7.0/10.0
- Schools +4.5/10.0
- Livability +3.1/5.0
- Rent growth +2.5/5.0
- Condition / age +2.5/5.0
$375,000
🖨 Deal sheet 📄 Offer letter ✓ Due diligence
Listing remarks
WOWZA!!! THIS IS AN AMAZING NEW PRICE AND JUST IN TIME FOR SUMMER AT COPAKE LAKE! This home has undergone a complete transformation. Much of the structure was taken down to the frame and rebuilt with precision, resulting in a modern, energy-efficient retreat designed for comfort, style, and long-term durability. Today, the home offers new interior and exterior walls, roof, plumbing, electrical, insulation, and high-efficiency mechanical systems with mini-split heating and cooling. Every upgrade was carefully selected for quality and performance. Sunlight fills the interior, creating a warm, inviting atmosphere throughout. The family room features a wood-burning fireplace and serene lake v
Key facts
- Open concept living
- Lake views
- Backup generator
Tags
Property features AI
Finance
- HOA & community: Community offers golf access; Community offers lake access; Community has a restaurant
Exterior
- Parking: On-site parking
- Utilities: Private water source; Septic tank; Electricity connected
- Home design: Single family residence; One level
- Construction: Asphalt roof
- Exterior features: Deck; Front yard fencing; Vinyl fencing; Shed(s); Has view
Interior
- Kitchen: ENERGY STAR qualified refrigerator; Free-standing gas oven; Free-standing range; Microwave; Range hood; ENERGY STAR qualified appliances
- Flooring: Ceramic tile; Hardwood
- Bathrooms: 1 full bathroom
- Heating & cooling: Baseboard heating; Has heating
- Interior features: ENERGY STAR qualified appliances; Tankless water heater; Walk-out basement
- Laundry & utility: Washer hookup; Electric dryer hookup
Neighborhood map
What this means for you Summary
Snapshot
- This is a 2-bed/1.0-bath single-family listed at $375k.
Deal economics
- At list price, monthly cash flow is $1k ($15k/yr) — positive.
- The deal already cash-flows at list — no discount required.
- Meets the 1% rule at list price ($4k rent vs $375k).
- Recommended offer: $364k (3.0% below list) — sets the bar for market timing.
- Cap rate 10.3% vs local median 2.4% in Copake Lake — top-decile yield for the area; either an underpriced asset or a hidden risk that comps aren't pricing in. Stress-test before assuming the spread holds.
Location & tenants
- Location reads 62/100 on livability (#841 in NY) — a middle-class / working-renter tenant base. Strengths: employment A+, housing A+; Watch: schools D+, amenities F, commute F.
- Taconic Hills Central School District (rural): math 53% / reading 51% proficiency, ranked #335 of 590 in NY (top 57%) — acceptable for families but not a draw, mixed tenant base, ~2y average lease.
- Market conditions: 42 active listings in the ZIP; 136 units permitted in Columbia County in 2024 (0 in 5+ unit buildings).
Forward outlook
- In year one you build about $40k of equity ($3k loan paydown + $38k appreciation (10.0% local appreciation)).
- Columbia County population projected at -22% by 2050 — secular population decline; favor cash flow + early exit over multi-decade hold.
- At projected returns (10.0% appreciation + 3.0% rent growth), your $105k cash investment doubles in ~2 years — after that, you're playing with house money.
- By year 2, paydown + projected appreciation supports a ~$64k cash-out refi (75% LTV) — recoverable capital for the next deal without selling this one.
Negotiation context
- It's been on market 49 days — a 3% lower offer ($364k) is reasonable based on typical stale-listing flexibility.
- 8 sale attempts since 9y ago; this cycle's ask has dropped $44k (11%) from the opening price — seller is motivated, your offer sets the floor, not the list.
- Current owner paid $30k; list at $375k implies a 1150% gain — meaningful room to come down on a strong offer.
Risks & watch-outs
- Watch-outs: built in 1955 — expect roof / HVAC / electrical / plumbing capex.
Questions for the listing agent
- It's been on market 49 days. Have you received any prior offers? Is the seller open to a 3% concession, seller financing, or rate buy-down credit?
- Built in 1955 — when were the roof, HVAC, electrical panel, plumbing, and water heater last replaced?
- Is there a deadline driving the sale (1031 exchange, divorce, estate, relocation)? That informs how much negotiation room exists.
- Schools are D-rated, which usually means shorter tenancies and higher turnover. Who's the typical renter profile here, and what's been the actual vacancy rate?
- What's the average days-on-market for RENTAL listings here right now (not sales)? A rising rental-DOM trend means longer vacancies and softer asking-rent achievability than the comps imply.
- What's the recent tenant-quality profile in this submarket — average credit score on applications, eviction rate, late-payment / NSF rate, and stable-employment percentage? A property-management company in the area should have these aggregated.
- How much new for-sale + rental construction is in the pipeline within 1–3 miles? Heavy new supply typically softens prices + rents 12–24 months out; constrained supply supports both.
Investment metrics
- 1% rule
- 1.20% ✓
- Cap rate
- 10.27%
- Cash-on-cash
- 14.19%
- DSCR
- 1.63
- GRM
- 7.0
CMA / ARV
- ARV (median comp)
- $490,000
- List price
- $375,000
- Delta
- -23.47%
- Verdict
- UNDERPRICED
- Comps
- 19 within 1.0 mi
Projected returns pro-forma
10.0% appreciation · 3.0% rent growth · sell at horizon
- IRR
- 34.7%
- Equity multiple
- 3.70×
- Total profit
- $283,187
- Equity at exit
- $337,830
- IRR
- 29.9%
- Equity multiple
- 8.35×
- Total profit
- $771,540
- Equity at exit
- $728,543
Cash invested: $105,000 (down + closing). Projections, not guarantees.
Landlord ↔ Tenant lean methodology
- Overall (STATE)
- 15 Strongly Tenant-Friendly
- State New York
- 15 Strongly Tenant-Friendly · D+10
- County
- — inherits STATE
- City
- — inherits STATE
ZIP-level market 12521
- Home prices YoY
- 23.4%
- Active inventory
- 42
- Price-to-rent
- 7.0×
Monthly cashflow live
- Estimated rent
- $4,482 medium interval (Pro) →
- Mortgage (P&I)
- −$1,967
- Tax from tax record
- −$176 /mo · $2,115/yr
- Insurance
- −$156
- HOA
- −$0
- Vacancy / Maint / Mgmt
- −$941
- Net cashflow
- $1,241
Break-even live
UW: 25.0% down · 7.5% · 30yr · 1.5% tax · 5.0% vac · 8.0% maint · 8.0% mgmt
Financing live
Cash to close
- Down payment
- $93,750
- Closing costs
- $11,250
- Reserves months
- —
- Total cash needed
- —
Loan-product check · same deal, 3 products live
Conventional
25% down · 7.5% · 30yr
- Down + closing
- —
- Monthly P&I
- —
- Monthly cashflow
- —
- DSCR
- —
- Eligible?
- —
Personal DTI + credit; lowest rate.
DSCR
20% down · 8.5% · 30yr
- Down + closing
- —
- Monthly P&I
- —
- Monthly cashflow
- —
- DSCR
- —
- Eligible?
- —
No personal income docs; deal must DSCR.
Hard money
10% down · 12.0% · 12mo
- Down + closing
- —
- Monthly P&I
- —
- Monthly cashflow
- —
- DSCR
- —
- Eligible?
- —
Short-term bridge; refi at stabilization.
Listing history 31 events
-
2026-06-19days on market $375,000 Active 49 DOM
-
2026-06-18days on market $375,000 Active 48 DOM
-
2026-06-17days on market $375,000 Active 47 DOM
-
2026-06-16days on market $375,000 Active 46 DOM
-
2026-06-15days on market $375,000 Active 45 DOM
-
2026-06-14days on market $375,000 Active 43 DOM
-
2026-06-12days on market $375,000 Active 42 DOM
-
2026-06-09days on market $375,000 Active 39 DOM
-
2026-06-08days on market $375,000 Active 38 DOM
-
2026-06-07days on market $375,000 Active 37 DOM
-
2026-06-07days on market $375,000 Active 36 DOM
-
2026-06-04days on market $375,000 Active 33 DOM
-
2026-06-02days on market $375,000 Active 32 DOM
-
2026-06-01days on market $375,000 Active 31 DOM
-
2026-05-31days on market $375,000 Active 30 DOM
-
2026-05-31days on market $375,000 Active 29 DOM
-
2026-05-18status Active 1619-char remark
-
2026-05-18historical 1619-char remark
-
2026-05-15price $375,000 1619-char remark
-
2026-05-08status Active 1619-char remark
-
2026-05-07historical 1619-char remark
-
2026-05-01status Active 1619-char remark
-
2026-04-30$419,000 Active 1619-char remark
-
2026-04-30historical $419,000 1619-char remark
-
2026-04-30historical
-
2025-10-28$499,000 Active
-
2018-02-05soldstatus $30,000
-
2017-11-22$34,900
-
2017-08-28$39,900
-
2017-08-24$39,900
-
1997-10-14soldstatus $30,000
ⓘ Source: listings_history table (triggers on properties + properties_extension) + one-shot
backfill from property_details.listing_events for pre-trigger history.
Tax reassessment forecast NY · Partial reset (capped growth)
- Current annual tax
- $2,115 · $176/mo
- Projected year-2 tax
- $4,226 · $352/mo
- Expected delta
- +$2,111/yr (+$176/mo · 99.8%)
ⓘ Screening estimate from a state-policy table — verify with the county assessor before closing.
Climate risk First Street
- Flood 1/10 Low FEMA zone X · 0% chance over 30 yrs
- Wildfire 4/10 Moderate
- Heat 3/10 Moderate 7 d/yr ≥95°F today · 16 d/yr by 30 yrs out
- Wind 4/10 Moderate 11% chance of damaging wind over 30 yrs
- Air quality 2/10 Low 1 unhealthy d/yr today · 2 by 30 yrs out
Nearby sold comps map
Loading sold comps map…
Walkable amenities ~0.75 mi
Loading nearby amenities…
Taxation est. · year 1
- Rental income
- $53,778
- − Mortgage interest
- −$21,006
- − Property taxes
- −$2,115
- − Insurance
- −$1,875
- − Repairs & maintenance
- −$4,302
- − Management
- −$4,302
- − Depreciation
- −$10,909
- Taxable income
- $9,269
- Est. tax owed @ 24.0%
- −$2,225
- After-tax cash flow
- $12,672/yr
For passive investors: Depreciation is non-cash, so a rental often shows a tax loss while cash-flowing — sheltering income. Rental losses are passive: they offset passive income freely, and up to $25,000/yr can offset ordinary (W-2) income if you actively participate and your MAGI is under $100k (phasing out to $0 by $150k); unused losses carry forward. On sale, claimed depreciation is recaptured at up to 25%, and gains may owe capital-gains tax (a 1031 exchange can defer both). Figures are a year-1 estimate at your 24.0% rate — not tax advice; consult a CPA.
Schools (NCES district)
- District
- Taconic Hills Central School District
- NCES district ID
- 3628620
- Math proficiency
- 53% ▲ 10.00%
- Reading proficiency
- 51% ▲ 11.00%
- Median HH income
- $57,329
- Composite
- 45.16/100
- National rank
- #2676
- State rank
- #335 of 590 in NY
Livability — Copake Lake
- Score
- 62/100
- State rank
- #841
- US rank
- #16329
Category grades
Schools grade is shown separately in the Schools card above.
Census & demographics
- Census place
- Copake Lake, NY
- Population (ZIP)
- 1,874
Population outlook (Columbia County) Hauer SSP2
- Today (2025)
- 58,662 people
- By 2030
- 56,557 · -3.6%
- By 2040
- 51,324 · -12.5%
- By 2050
- 45,790 · -21.9%
- By 2075
- 35,232 · -39.9%
- By 2100
- 25,846 · -55.9%
Race, ethnicity, and origin ACS 2023
- Neighborhood character
- Predominantly White (81%)
- Race & ethnicity
- White 81% Two or more races 11% Hispanic / Latino 7% Black 1%
- Hispanic origin (detail)
- Mexican 1% Cuban 2%
- Common ancestry
- Romanian 3% Scotch-Irish 3% Slovak 2%
- Foreign-born
- 4% · Canada, Jamaica
- Languages at home
- 90% English-only · Spanish 8% Russian/Polish/Slavic 1% Other Indo-European 1%
Political lean MEDSL · Columbia
- 2024 margin
- D (+14.7) · D 57.4% · R 42.6%
- 2008→2024 swing
- +1.3pp toward D · 2008: 13.4pp · 2024: 14.7pp
- All cycles
- 2024: D+14.7 2020: D+16.7 2016: D+1.4 2012: D+11.7 2008: D+13.4
Not yet ingested
- Civics
- —
Market trends
- HPI YoY
- ▲ 83.58%
- Current HPI
- 441.0272
- Rent YoY
- —
- Metro
- —
- State GDP YoY
- ▲ 2.60%
- F500 in state
- 92
Industry mix (Fortune 500 HQ in NY)
| Industry | F500 HQs | Revenue |
|---|---|---|
| Financial Services | 10 | $950B |
|
||
| Consumer Goods | 9 | $162B |
|
||
| Insurance | 4 | $225B |
|
||
| Telecommunications | 2 | $144B |
|
||
| Pharmaceuticals | 2 | $112B |
|
||
| Media / Entertainment | 2 | $69B |
|
||
Price history
+1150.0% since first listed15 events — show timeline
- 2026-05-18 Relisted — HVCRMLS
- 2026-05-18 Delisted — HVCRMLS
- 2026-05-15 Price Changed $375,000 HVCRMLS
- 2026-05-08 Relisted — HVCRMLS
- 2026-05-07 Delisted — HVCRMLS
- 2026-05-01 Relisted — HVCRMLS
- 2026-04-30 Listed $419,000 HVCRMLS
- 2026-04-30 Coming Soon $419,000 HVCRMLS
- 2026-04-30 Listing Removed — Global MLS
- 2025-10-28 Listed $499,000 Global MLS
- 2018-02-05 Sold (MLS) $30,000 HVCRMLS
- 2017-11-22 Listed $34,900 HVCRMLS
- 2017-08-28 Listed $39,900 HVCRMLS
- 2017-08-24 Listed $39,900 HVCRMLS
- 1997-10-14 Sold (Public Records) $30,000 Public Records
Property tax history
-0.2%/yrLatest (2025): $2,115 · +2.8% YoY. Source: county tax records.
Cash-flow waterfall
monthlySold comps — $/sqft
last 12 mo · ≤1 miLoading sold comps…