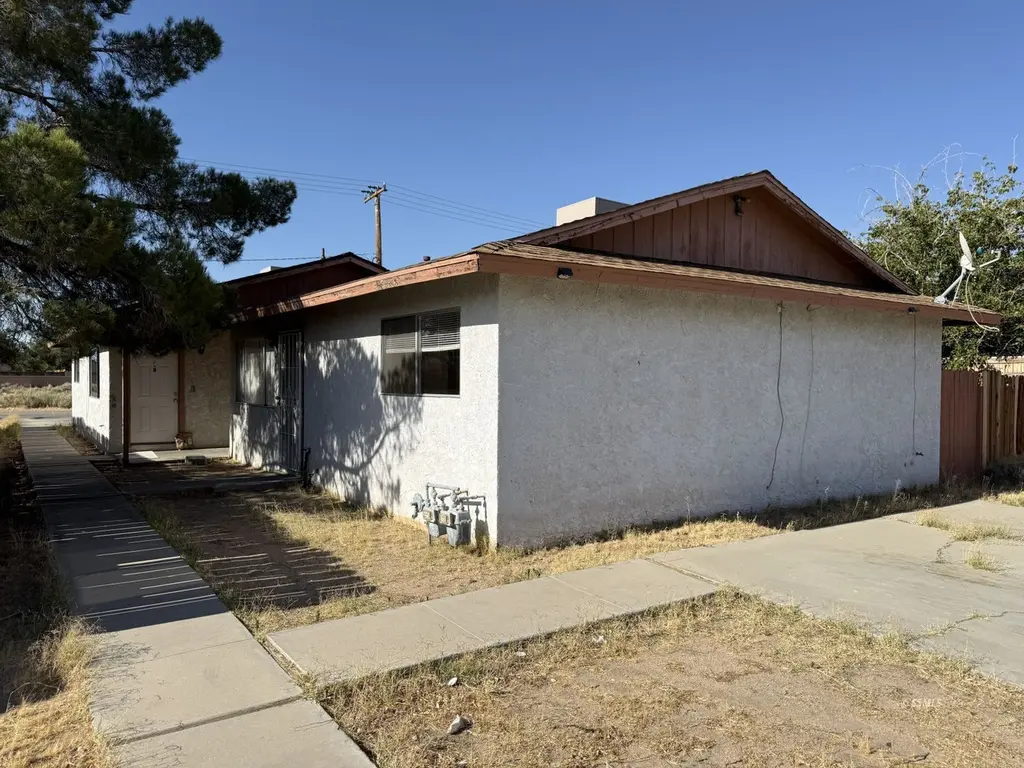
 Duplex
736 Commercial Ave · Ridgecrest, CA
Flood risk 1/10 · Minimal
- FEMA flood zone
- X (shaded)
- Chance of flooding over 30 yrs
- 0.0%
- Est. flood insurance / yr
- $507 – $1,088
Fire risk 3/10 · Minor
- Est. fire insurance / yr
- $659 – $1,223
Heat risk 8/10 · Major
- Hot days now (above 105°F)
- 7 days/yr
- Hot days in 30 yrs
- 20 days/yr
Wind risk 1/10 · Minimal
- Chance of severe wind over 30 yrs
- —
Air-quality risk 7/10 · Major
- Unhealthy air days now
- 14 days/yr
- Unhealthy air days in 30 yrs
- 15 days/yr
Risk factors via First Street. Map © Google.
Why this score? — see what drove the C grade
The composite is a weighted blend of 9 inputs, each scored 0–100. Each bar is that input's sub-score; the figure is the points it added to the 100-point composite (weight × sub-score).
- Cash flow +23.7/30.0
- DSCR +7.6/10.0
- ARV discount +7.5/15.0
- 1% rule +5.9/10.0
- Livability +3.5/5.0
- Rent growth +3.4/5.0
- Schools +2.9/10.0
- Condition / age +2.5/5.0
- Appreciation +0.0/10.0
$199,950
🖨 Deal sheet 📄 Offer letter ✓ Due diligence
Multi-family units
County records classify this as Multi-Family (2-4 Unit). Listing-text estimate: 2 units. confirmed
Listing remarks
Don't miss out on this great investment opportunity! Duplex, priced under market. Unit A has new carpet and fresh paint. Both units have indoor laundry room with extra storage and east facing back patios. Refrigerators stay in both units as well. Unit B is recently vacated and needs some love. Take advantage of the lower price to do your own repairs and build equity. Schedule a showing today!
Key facts
- Fresh paint
- Refrigerators stay
- New carpet
Tags
Property features AI
Exterior
- Home design: Residential income property; Duplex; Fixer-upper / income property
- Construction: Stucco construction; Slab foundation; Asphalt/composition/shingle roof
- Exterior features: Fenced yard; R-2 zoning
Interior
- Kitchen: Dishwasher; Range / Oven; Disposal
- Flooring: Carpet
- Interior features: Dishwasher; Disposal; Range / Oven; Gas water heater
- Laundry & utility: Gas water heater
Neighborhood map
What this means for you Summary
Snapshot
- This is a 2 × 2-bed/1.0-bath units multifamily listed at $200k.
Deal economics
- At list price, monthly cash flow is $379 ($5k/yr) — positive. Per door: $189/mo.
- The deal already cash-flows at list — no discount required.
- Meets the 1% rule at list price ($2k rent vs $200k).
- Cap rate 8.6% vs local median 4.0% in Ridgecrest — top-decile yield for the area; either an underpriced asset or a hidden risk that comps aren't pricing in. Stress-test before assuming the spread holds.
Location & tenants
- Location reads 70/100 on livability (#243 in CA) — a middle-class / working-renter tenant base. Strengths: commute A+, housing A+; Watch: schools C-, amenities D+, cost of living D+.
- Sierra Sands Unified (town): math 25% / reading 39% proficiency, ranked #294 of 517 in CA (top 57%) — families likely to look elsewhere, expect single-tenant / working-renter base with shorter leases.
- Market conditions: Rents rising (+3.6%/yr); 328 active listings in the ZIP; 14 comparable units currently listed for rent nearby; rentals leasing fast (median 3d on market — plan ~1-2 weeks tenant-placement turnaround); solid renter incomes; 3,244 units permitted in Kern County in 2024 (73 in 5+ unit buildings).
- This rent runs 30% of the median local income ($87k/yr) — at the standard rent-burdened threshold; future hikes will face affordability resistance.
Forward outlook
- Local home prices are declining (-3.0%/yr); year-one equity from $1k of loan paydown is wiped out by about $6k of value loss. Plan a longer hold.
- Kern County population projected at +17% by 2050 — long-run rental-demand tailwind backs the buy-and-hold thesis.
Negotiation context
- Only 9 days on market — expect competitive offers; lowballing is unlikely to land.
- Current owner paid $87k; list at $200k implies a 130% gain — meaningful room to come down on a strong offer.
Risks & watch-outs
- Climate carrying-cost: extreme-heat days projected 7→20/yr by 2055 (HVAC capex compounding) — expect insurance premiums to compound above CPI over the hold.
Questions for the listing agent
- Can we see the unit-by-unit rent roll, current vacancy, and any below-market leases? What's the average tenancy length?
- What capital expenditures (roof, boiler, parking lot, exteriors) have been made in the last 5 years, and what's planned in the next 2?
- Is there a deadline driving the sale (1031 exchange, divorce, estate, relocation)? That informs how much negotiation room exists.
- Crime grade is F in this area — have there been break-ins, vandalism, or insurance claims at this property in the last 3 years? What carrier currently insures it and at what premium?
- What's the average days-on-market for RENTAL listings here right now (not sales)? A rising rental-DOM trend means longer vacancies and softer asking-rent achievability than the comps imply.
- What's the recent tenant-quality profile in this submarket — average credit score on applications, eviction rate, late-payment / NSF rate, and stable-employment percentage? A property-management company in the area should have these aggregated.
- How much new apartment / multifamily construction is in the pipeline within 1–3 miles? Heavy new supply (>2% of stock underway) typically softens rents 12–24 months out; light construction supports rent growth.
Investment metrics
- 1% rule
- 1.09% ✓
- Cap rate
- 8.57%
- Cash-on-cash
- 8.12%
- DSCR
- 1.36
- GRM
- 7.7
CMA / ARV
No comps found within radius.
Projected returns pro-forma
-3.0% appreciation · 3.58% rent growth · sell at horizon
- IRR
- -3.3%
- Equity multiple
- 0.88×
- Total profit
- $-6,988
- Equity at exit
- $29,813
- IRR
- 7.0%
- Equity multiple
- 1.54×
- Total profit
- $30,304
- Equity at exit
- $17,288
Cash invested: $55,986 (down + closing). Projections, not guarantees.
Landlord ↔ Tenant lean methodology
- Overall (STATE)
- 18 Strongly Tenant-Friendly
- State California
- 18 Strongly Tenant-Friendly · D+13
- County
- — inherits STATE
- City
- — inherits STATE
ZIP-level market 93555
- Home prices YoY
- -24.0%
- Rents YoY
- 3.6%
- Active inventory
- 328
- Price-to-rent
- 15.3×
Monthly cashflow live
- Estimated rent
- $2,172 high interval (Pro) →
- Mortgage (P&I)
- −$1,049
- Tax from tax record
- −$205 /mo · $2,461/yr
- Insurance
- −$83
- HOA
- −$0
- Vacancy / Maint / Mgmt
- −$456
- Net cashflow
- $379
Break-even live
2-unit breakdown (identical units grouped — click to expand)
| Units | Beds | Baths | Est. rent |
|---|---|---|---|
| 2× units | 2 | 1 | $2,172 |
| #1 | 2 | 1 | $1,086 |
| #2 | 2 | 1 | $1,086 |
| Total (2 units) | $2,172 | ||
UW: 25.0% down · 7.5% · 30yr · 1.5% tax · 5.0% vac · 8.0% maint · 8.0% mgmt
Financing live
Cash to close
- Down payment
- $49,988
- Closing costs
- $5,998
- Reserves months
- —
- Total cash needed
- —
Loan-product check · same deal, 3 products live
Conventional
25% down · 7.5% · 30yr
- Down + closing
- —
- Monthly P&I
- —
- Monthly cashflow
- —
- DSCR
- —
- Eligible?
- —
Personal DTI + credit; lowest rate.
DSCR
20% down · 8.5% · 30yr
- Down + closing
- —
- Monthly P&I
- —
- Monthly cashflow
- —
- DSCR
- —
- Eligible?
- —
No personal income docs; deal must DSCR.
Hard money
10% down · 12.0% · 12mo
- Down + closing
- —
- Monthly P&I
- —
- Monthly cashflow
- —
- DSCR
- —
- Eligible?
- —
Short-term bridge; refi at stabilization.
Rent comps 14 comps
| Address | Beds | Baths | Sqft | Rent | $/sqft | DOM | Units | Dist |
|---|---|---|---|---|---|---|---|---|
| 112 Rawhide Ln Ridgecrest, CA | 3.0 | 2.0 | 1467 | $1,650 | $1.12 | 2d | 1 | 0.22mi |
| 236 S American St Ridgecrest, CA | 3.0 | 2.0 | 1407 | $1,650 | $1.17 | 43d | 1 | 0.25mi |
| 624 Yellow Astor Ave Ridgecrest, CA | 2.0 | 2.0 | 1441 | $1,800 | $1.25 | 21d | 1 | 0.43mi |
| 528 Heatherglen Dr Ridgecrest, CA | 3.0 | 2.0 | 1370 | $1,725 | $1.26 | 2d | 1 | 0.45mi |
| 224 Larkspur St Ridgecrest, CA | 3.0 | 2.0 | 1362 | $1,995 | $1.46 | 2d | 1 | 0.52mi |
| 431 Jacobs Ct Ridgecrest, CA | 3.0 | 2.0 | 1743 | $1,850 | $1.06 | 43d | 1 | 0.53mi |
| 255 E Upjohn Ave Ridgecrest, CA | 2.0 | 2.5 | 1258 | $1,350 | $1.07 | 2d | 1 | 0.79mi |
| 520 Silveridge St Ridgecrest, CA | 3.0 | 2.0 | 1471 | $2,000 | $1.36 | 43d | 1 | 0.80mi |
| 247 E Upjohn Ave Ridgecrest, CA | 3.0 | 2.5 | 1305 | $1,425 | $1.09 | 2d | 1 | 0.80mi |
| 205 E Upjohn Ave Ridgecrest, CA | 2.0 | 2.5 | 1288 | $1,225 | $0.95 | 43d | 1 | 0.82mi |
| 225 N Helena St Ridgecrest, CA | 3.0 | 2.0 | 1527 | $1,750 | $1.15 | 2d | 1 | 1.25mi |
| 419 Jean Ave Ridgecrest, CA | 3.0 | 2.0 | 1583 | $1,585 | $1.00 | 2d | 1 | 1.26mi |
| 401 N Norma St Ridgecrest, CA | 3.0 | 2.0 | 1360 | $1,500 | $1.10 | 2d | 1 | 1.42mi |
| 247 Peg St Ridgecrest, CA | 3.0 | 2.0 | 1876 | $1,500 | $0.80 | 2d | 1 | 1.45mi |
Listing history 8 events
-
2026-06-14statusdays on market $199,950 Pending 9 DOM
-
2026-06-13days on market $199,950 Active 8 DOM
-
2026-06-10days on market $199,950 Active 6 DOM
-
2026-06-09days on market $199,950 Active 5 DOM
-
2026-06-08days on market $199,950 Active 4 DOM
-
2026-06-07days on market $199,950 Active 3 DOM
-
2026-06-05remarks 395-char remark
-
2026-06-05$199,950 Active 1 DOM
ⓘ Source: listings_history table (triggers on properties + properties_extension) + one-shot
backfill from property_details.listing_events for pre-trigger history.
Tax reassessment forecast CA · Resets to sale price
- Current annual tax
- $2,461 · $205/mo
- Projected year-2 tax
- $2,461 · $205/mo
- Expected delta
- $0/yr ($0/mo · 0.0%)
ⓘ Screening estimate from a state-policy table — verify with the county assessor before closing.
Climate risk First Street
- Flood 1/10 Low FEMA zone X (shaded) · 0% chance over 30 yrs
- Wildfire 3/10 Moderate
- Heat 8/10 Severe 7 d/yr ≥105°F today · 20 d/yr by 30 yrs out
- Wind 1/10 Low
- Air quality 7/10 Severe 14 unhealthy d/yr today · 15 by 30 yrs out
Nearby sold comps map
Loading sold comps map…
Walkable amenities ~0.75 mi
Loading nearby amenities…
Taxation est. · year 1
- Rental income
- $26,064
- − Mortgage interest
- −$11,200
- − Property taxes
- −$2,461
- − Insurance
- −$1,000
- − Repairs & maintenance
- −$2,085
- − Management
- −$2,085
- − Depreciation
- −$5,817
- Taxable income
- $1,416
- Est. tax owed @ 24.0%
- −$340
- After-tax cash flow
- $4,207/yr
For passive investors: Depreciation is non-cash, so a rental often shows a tax loss while cash-flowing — sheltering income. Rental losses are passive: they offset passive income freely, and up to $25,000/yr can offset ordinary (W-2) income if you actively participate and your MAGI is under $100k (phasing out to $0 by $150k); unused losses carry forward. On sale, claimed depreciation is recaptured at up to 25%, and gains may owe capital-gains tax (a 1031 exchange can defer both). Figures are a year-1 estimate at your 24.0% rate — not tax advice; consult a CPA.
Schools (NCES district)
- District
- Sierra Sands Unified
- NCES district ID
- 0636800
- Math proficiency
- 25% ▼ -11.00%
- Reading proficiency
- 39% ▼ -11.00%
- Median HH income
- $58,937
- Composite
- 28.66/100
- National rank
- #6699
- State rank
- #294 of 517 in CA
Livability — Ridgecrest
- Score
- 70/100
- State rank
- #243
- US rank
- #8014
Category grades
Schools grade is shown separately in the Schools card above.
Census & demographics
- Census place
- Ridgecrest, CA
- County
- Kern County · 710,371 people
- City population
- 33,845
- Metro
- Bakersfield, CA
- Population (ZIP)
- 33,845
- Household income
- $86,700
- Rent vs Own
- Severe rent burden
- 975.0
Population outlook (Kern County) Hauer SSP2
- Today (2025)
- 947,286 people
- By 2030
- 978,984 · +3.3%
- By 2040
- 1,045,018 · +10.3%
- By 2050
- 1,105,232 · +16.7%
- By 2075
- 1,229,538 · +29.8%
- By 2100
- 1,238,059 · +30.7%
Race, ethnicity, and origin ACS 2023
- Neighborhood character
- Majority White (65%)
- Race & ethnicity
- White 65% Hispanic / Latino 20% Two or more races 12% Black 4% Asian 4% Native American 1%
- Hispanic origin (detail)
- Mexican 15%
- Common ancestry
- Italian 4% Lithuanian 2% Slovak 2%
- Foreign-born
- 7% · Canada
- Languages at home
- 84% English-only · Spanish 11% Other Indo-European 1% Other Asian/Pacific 1%
Political lean MEDSL · Kern
- 2024 margin
- Strong R (+21.1) · D 38.2% · R 59.3% · Other 2.5%
- 2008→2024 swing
- -3.3pp toward R · 2008: -17.8pp · 2024: -21.1pp
- All cycles
- 2024: R+21.1 2020: R+10.2 2016: R+15.0 2012: R+20.9 2008: R+17.8
Not yet ingested
- Civics
- —
Market trends
- HPI YoY
- ▼ -120.17%
- Current HPI
- 380.5208
- Rent YoY
- ▲ 3.58%
- Metro
- Bakersfield, CA
- State GDP YoY
- ▲ 3.21%
- F500 in state
- 116
Industry mix (Fortune 500 HQ in CA)
| Industry | F500 HQs | Revenue |
|---|---|---|
| Technology | 27 | $1,492B |
|
||
| Financial Services | 3 | $174B |
|
||
| Retail | 3 | $44B |
|
||
| Insurance | 3 | $26B |
|
||
| Media / Entertainment | 2 | $115B |
|
||
| Pharmaceuticals / Biotech | 2 | $62B |
|
||
Price history
+180.7% since first listed6 events — show timeline
- 2026-06-04 Listed $199,950 SSMLS
- 2003-12-18 Sold (Public Records) $87,000 Public Records
- 2001-11-07 Sold (Public Records) $87,000 Public Records
- 1998-12-17 Sold (Public Records) $36,000 Public Records
- 1997-07-07 Sold (Public Records) $25,000 Public Records
- 1997-02-14 Sold (Public Records) $71,244 Public Records
Property tax history
+3.5%/yrLatest (2025): $2,461 · +4.6% YoY. Source: county tax records.
Cash-flow waterfall
monthlySold comps — $/sqft
last 12 mo · ≤1 miLoading sold comps…