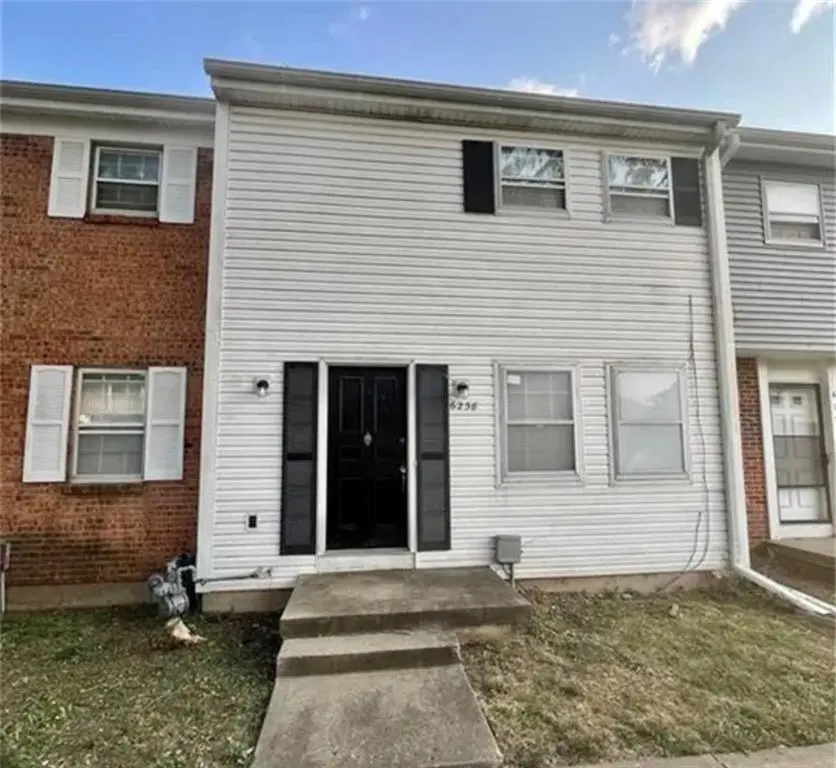
6238 E 129th St · Grandview, MO
Flood risk 1/10 · Minimal
- FEMA flood zone
- X (unshaded)
- Chance of flooding over 30 yrs
- 0.0%
- Est. flood insurance / yr
- $473 – $860
Fire risk 1/10 · Minimal
- Est. fire insurance / yr
- $1,054 – $1,958
Heat risk 4/10 · Minor
- Hot days now (above 107°F)
- 7 days/yr
- Hot days in 30 yrs
- 17 days/yr
Wind risk 2/10 · Minimal
- Chance of severe wind over 30 yrs
- —
Air-quality risk 3/10 · Minor
- Unhealthy air days now
- 3 days/yr
- Unhealthy air days in 30 yrs
- 3 days/yr
Risk factors via First Street. Map © Google.
Why this score? — see what drove the C grade
The composite is a weighted blend of 9 inputs, each scored 0–100. Each bar is that input's sub-score; the figure is the points it added to the 100-point composite (weight × sub-score).
- Cash flow +22.5/30.0
- ARV discount +7.7/15.0
- 1% rule +7.2/10.0
- DSCR +7.2/10.0
- Rent growth +4.0/5.0
- Livability +3.1/5.0
- Condition / age +2.5/5.0
- Schools +2.1/10.0
- Appreciation +0.0/10.0
$143,000
🖨 Deal sheet 📄 Offer letter ✓ Due diligence
Listing remarks MLS
This inviting townhouse offers 3 bedrooms and 2.5 bathrooms with a functional layout designed for everyday living. The main floor features an open kitchen and living area, creating an ideal space for relaxing or entertaining. The kitchen peninsula provides plenty of room for gathering, meal prep, and casual dining. Fresh interior paint throughout makes this home truly move-in ready. Enjoy the convenience of an enclosed garage stall for parking and extra storage, plus a private fenced back deck perfect for outdoor seating, grilling, or pets. A great opportunity for low-maintenance living with comfortable indoor and outdoor spaces. HOA covers roof, siding, exterior, water, and lawn.
Key facts
- Living area
- Kitchen peninsula
- Open kitchen
Tags
Neighborhood map
What this means for you Summary
Snapshot
- This is a 3-bed/2.0-bath townhouse listed at $143k.
Deal economics
- At list price, monthly cash flow is $240 ($3k/yr) — positive.
- The deal already cash-flows at list — no discount required.
- Meets the 1% rule at list price ($2k rent vs $143k).
- Recommended offer: $139k (3.0% below list) — sets the bar for market timing.
- Cap rate 8.3% vs local median 5.0% in Grandview — top-decile yield for the area; either an underpriced asset or a hidden risk that comps aren't pricing in. Stress-test before assuming the spread holds.
Location & tenants
- Location reads 61/100 on livability (#454 in MO) — a middle-class / working-renter tenant base. Strengths: cost of living A+, housing A+; Watch: schools D, employment D, crime F.
- Grandview C-4 (suburban): math 17% / reading 32% proficiency, ranked #284 of 324 in MO (top 88%) — low school quality limits family demand, transient renter base, plan for 1-2y turnover; 65% free/reduced lunch — lower-income household profile, screen leases tightly.
- Market conditions: Rents rising fast (+6.1%/yr); 116 active listings in the ZIP; 19 comparable units currently listed for rent nearby; rentals at typical pace (median 17d on market — plan ~3-4 weeks tenant-placement turnaround); 4,002 units permitted in Jackson County in 2024 (2,271 in 5+ unit buildings).
- This rent runs 39% of the median local income ($53k/yr) — at the standard rent-burdened threshold; future hikes will face affordability resistance.
Forward outlook
- Local home prices are declining (-3.0%/yr); year-one equity from $989 of loan paydown is wiped out by about $4k of value loss. Plan a longer hold.
- Jackson County population projected at +4% by 2050 — modest demand growth; plan on rents tracking national, not racing it.
- At projected returns (-3.0% appreciation + 6.1% rent growth), your $40k cash investment doubles in ~9 years — after that, you're playing with house money.
Negotiation context
- It's been on market 56 days — a 3% lower offer ($139k) is reasonable based on typical stale-listing flexibility.
- 4 sale attempts since 18y ago with the ask held roughly flat each time — persistent listings suggest the price (not the market) is what's stuck; bring a comps-based counter.
Questions for the listing agent
- It's been on market 56 days. Have you received any prior offers? Is the seller open to a 3% concession, seller financing, or rate buy-down credit?
- Built in 1968 — when were the roof, HVAC, electrical panel, plumbing, and water heater last replaced?
- What does the HOA fee cover, when was the last increase, and are there any pending special assessments or reserve-fund shortfalls?
- Is there a deadline driving the sale (1031 exchange, divorce, estate, relocation)? That informs how much negotiation room exists.
- Schools are D-rated, which usually means shorter tenancies and higher turnover. Who's the typical renter profile here, and what's been the actual vacancy rate?
- Crime grade is F in this area — have there been break-ins, vandalism, or insurance claims at this property in the last 3 years? What carrier currently insures it and at what premium?
- What's the average days-on-market for RENTAL listings here right now (not sales)? A rising rental-DOM trend means longer vacancies and softer asking-rent achievability than the comps imply.
- What's the recent tenant-quality profile in this submarket — average credit score on applications, eviction rate, late-payment / NSF rate, and stable-employment percentage? A property-management company in the area should have these aggregated.
- How much new for-sale + rental construction is in the pipeline within 1–3 miles? Heavy new supply typically softens prices + rents 12–24 months out; constrained supply supports both.
Investment metrics
- 1% rule
- 1.22% ✓
- Cap rate
- 8.30%
- Cash-on-cash
- 7.18%
- DSCR
- 1.32
- GRM
- 6.8
CMA / ARV
- ARV (median comp)
- $143,500
- List price
- $143,000
- Delta
- -0.35%
- Verdict
- FAIR
- Comps
- 20 within 1.0 mi
Show comp detail 8 sales within ~0.75 mi
| Address | Dist | Beds/Ba | Sqft | Sold | Price | $/sf | Match |
|---|---|---|---|---|---|---|---|
| 6411 E 127th St | 0.10mi | 3/2.5 | 1,300 (-8%) | 1mo | $159,000 | $122 | 78 |
| 6006 E 127th St | 0.15mi | 3/2.5 | 1,472 (+4%) | 12mo | $165,000 | $112 | 74 |
| 5956 E 129th St | 0.13mi | 2/1.5 (-1) | 1,513 (+6%) | 2mo | $99,900 | $66 | 74 |
| 6027 E 127th St | 0.10mi | 3/2.5 | 1,536 (+8%) | 13mo | $115,000 | $75 | 69 |
| 6619 E 128th St | 0.23mi | 3/2.5 | 1,521 (+7%) | 17mo | $175,000 | $115 | 62 |
| 6443 E 127th St | 0.13mi | 3/2.5 | 1,630 (+15%) | 12mo | $162,500 | $100 | 57 |
| 5930 E 129th St | 0.12mi | 2/1.5 (-1) | 1,620 (+14%) | 17mo | $149,000 | $92 | 50 |
| 6270 E 129th St | 0.07mi | 2/2.5 (-1) | 1,620 (+14%) | 20mo | $135,000 | $83 | 50 |
Match score weights: distance 35% · size 25% · config 20% · recency 20%. Top-matched comps best support the ARV.
Projected returns pro-forma
-3.0% appreciation · 6.1% rent growth · sell at horizon
- IRR
- -1.4%
- Equity multiple
- 0.95×
- Total profit
- $-2,163
- Equity at exit
- $21,322
- IRR
- 11.7%
- Equity multiple
- 2.07×
- Total profit
- $42,876
- Equity at exit
- $12,364
Cash invested: $40,040 (down + closing). Projections, not guarantees.
Landlord ↔ Tenant lean methodology
- Overall (STATE)
- 81 Strongly Landlord-Friendly
- State Missouri
- 81 Strongly Landlord-Friendly · R+10
- County
- — inherits STATE
- City
- — inherits STATE
ZIP-level market 64030
- Home prices YoY
- -30.7%
- Rents YoY
- 6.1%
- Active inventory
- 116
- Price-to-rent
- 6.8×
Monthly cashflow live
- Estimated rent
- $1,750 high interval (Pro) →
- Mortgage (P&I)
- −$750
- Tax from tax record
- −$122 /mo · $1,460/yr
- Insurance
- −$60
- HOA
- −$212
- Vacancy / Maint / Mgmt
- −$368
- Net cashflow
- $240
Break-even live
UW: 25.0% down · 7.5% · 30yr · 1.5% tax · 5.0% vac · 8.0% maint · 8.0% mgmt
Financing live
Cash to close
- Down payment
- $35,750
- Closing costs
- $4,290
- Reserves months
- —
- Total cash needed
- —
Loan-product check · same deal, 3 products live
Conventional
25% down · 7.5% · 30yr
- Down + closing
- —
- Monthly P&I
- —
- Monthly cashflow
- —
- DSCR
- —
- Eligible?
- —
Personal DTI + credit; lowest rate.
DSCR
20% down · 8.5% · 30yr
- Down + closing
- —
- Monthly P&I
- —
- Monthly cashflow
- —
- DSCR
- —
- Eligible?
- —
No personal income docs; deal must DSCR.
Hard money
10% down · 12.0% · 12mo
- Down + closing
- —
- Monthly P&I
- —
- Monthly cashflow
- —
- DSCR
- —
- Eligible?
- —
Short-term bridge; refi at stabilization.
Rent comps 19 comps
| Address | Beds | Baths | Sqft | Rent | $/sqft | DOM | Units | Dist |
|---|---|---|---|---|---|---|---|---|
| 1325 Duck Rd Grandview, MO | 3.0 | 1.5 | 1480 | $1,600 | $1.08 | 43d | 1 | 0.38mi |
| 6505 Yorkshire Ct Grandview, MO | 3.0 | 2.0 | 1697 | $2,090 | $1.23 | 4d | 1 | 0.61mi |
| 6003 E 133rd St Grandview, MO | 4.0 | 2.5 | 1560 | $1,990 | $1.28 | 12d | 1 | 0.70mi |
| 13206 15th St Grandview, MO | 3.0 | 2.0 | 1204 | $1,735 | $1.44 | 21d | 1 | 0.73mi |
| 7508 E 127th Pl Grandview, MO | 3.0 | 2.0 | 1396 | $1,945 | $1.39 | 1d | 1 | 0.88mi |
| 12712 7th St Grandview, MO | 3.0 | 2.0 | 1050 | $1,545 | $1.47 | 12d | 1 | 0.89mi |
| 7502 E 132nd Ter Grandview, MO | 3.0 | 2.0 | 1754 | $2,135 | $1.22 | 23d | 1 | 1.06mi |
| 6731 E 119th St Grandview, MO | 1.0–2.0 | 1.0–2.0 | 762 | $1,150 | $1.51 | 1d | 14 | 1.11mi |
| 13629 Applewood Dr Grandview, MO | 3.0 | 1.5 | 998 | $1,549 | $1.55 | 17d | 1 | 1.18mi |
| 8011 E 130th Ct Unit 1 Grandview, MO | 3.0 | 1.5 | 1160 | $1,600 | $1.38 | 17d | 1 | 1.20mi |
| 11805 Lawndale Ave Kansas City, MO | 3.0 | 1.0 | 1152 | $1,565 | $1.36 | 23d | 1 | 1.21mi |
| 6501 E 137th St Grandview, MO | 4.0 | 3.0 | 1469 | $2,135 | $1.45 | 43d | 1 | 1.22mi |
| 13100 Sycamore Ave Grandview, MO | 3.0 | 2.0 | 1056 | $1,775 | $1.68 | 43d | 1 | 1.27mi |
| 3813 Duck Rd Unit 3803 8 Grandview, MO | 3.0 | 2.0 | 875 | $1,000 | $1.14 | 3d | 1 | 1.28mi |
| 11720 Newton Ave Kansas City, MO | 2.0–3.0 | 1.5–3.0 | 1293 | $1,699 | $1.31 | 1d | 9 | 1.29mi |
| 13144 Ashland Ave Grandview, MO | 3.0 | 2.0 | 1056 | $1,706 | $1.62 | 43d | 1 | 1.39mi |
| 11803 Holiday Dr #5 Kansas City, MO | 1.0–3.0 | 1.0 | 1016 | $1,130 | $1.11 | 1d | 1 | 1.40mi |
| 11934 Sycamore Ave Grandview, MO | 3.0 | 2.0 | 1414 | $1,806 | $1.28 | 43d | 1 | 1.41mi |
| 11923 Manchester Ave Grandview, MO | 3.0 | 2.0 | 1407 | $1,815 | $1.29 | 43d | 1 | 1.42mi |
HOA detail
- Monthly dues
- $212 · $2,544/yr
- Likely covers
- water
Listing history 22 events
-
2026-06-18days on market $143,000 Active 56 DOM
-
2026-06-17days on market $143,000 Active 55 DOM
-
2026-06-16days on market $143,000 Active 54 DOM
-
2026-06-15days on market $143,000 Active 53 DOM
-
2026-06-13days on market $143,000 Active 51 DOM
-
2026-06-13days on market $143,000 Active 50 DOM
-
2026-06-09days on market $143,000 Active 47 DOM
-
2026-06-08days on market $143,000 Active 46 DOM
-
2026-06-07days on market $143,000 Active 45 DOM
-
2026-06-03status $143,000 Active 41 DOM
-
2026-04-28price $143,000 689-char remark
Show marketing remark (689 chars)
This inviting townhouse offers 3 bedrooms and 2.5 bathrooms with a functional layout designed for everyday living. The main floor features an open kitchen and living area, creating an ideal space for relaxing or entertaining. The kitchen peninsula provides plenty of room for gathering, meal prep, and casual dining. Fresh interior paint throughout makes this home truly move-in ready. Enjoy the convenience of an enclosed garage stall for parking and extra storage, plus a private fenced back deck perfect for outdoor seating, grilling, or pets. A great opportunity for low-maintenance living with comfortable indoor and outdoor spaces. HOA covers roof, siding, exterior, water, and lawn.
-
2026-04-16$145,000 Active 689-char remark
Show marketing remark (689 chars)
This inviting townhouse offers 3 bedrooms and 2.5 bathrooms with a functional layout designed for everyday living. The main floor features an open kitchen and living area, creating an ideal space for relaxing or entertaining. The kitchen peninsula provides plenty of room for gathering, meal prep, and casual dining. Fresh interior paint throughout makes this home truly move-in ready. Enjoy the convenience of an enclosed garage stall for parking and extra storage, plus a private fenced back deck perfect for outdoor seating, grilling, or pets. A great opportunity for low-maintenance living with comfortable indoor and outdoor spaces. HOA covers roof, siding, exterior, water, and lawn.
-
2024-12-16soldstatus
-
2024-12-12soldstatus Closed 547-char remark
Show marketing remark (547 chars)
This charming townhouse presents an excellent investment opportunity. Featuring three bedrooms and two and a half bathrooms, it offers a practical layout perfect for families or renters. The inviting living area flows seamlessly, creating a cozy atmosphere. The backyard provides a space for outdoor enjoyment. Conveniently located near schools, parks, shopping, and public transportation, this property is ideally positioned for strong rental potential. Don't miss out on this promising investment! HOA covers roof, siding, exterior, water, lawn!
-
2024-11-11status Pending 547-char remark
Show marketing remark (547 chars)
This charming townhouse presents an excellent investment opportunity. Featuring three bedrooms and two and a half bathrooms, it offers a practical layout perfect for families or renters. The inviting living area flows seamlessly, creating a cozy atmosphere. The backyard provides a space for outdoor enjoyment. Conveniently located near schools, parks, shopping, and public transportation, this property is ideally positioned for strong rental potential. Don't miss out on this promising investment! HOA covers roof, siding, exterior, water, lawn!
-
2024-09-20$125,000 Active 547-char remark
Show marketing remark (547 chars)
This charming townhouse presents an excellent investment opportunity. Featuring three bedrooms and two and a half bathrooms, it offers a practical layout perfect for families or renters. The inviting living area flows seamlessly, creating a cozy atmosphere. The backyard provides a space for outdoor enjoyment. Conveniently located near schools, parks, shopping, and public transportation, this property is ideally positioned for strong rental potential. Don't miss out on this promising investment! HOA covers roof, siding, exterior, water, lawn!
-
2020-11-09soldstatus
-
2020-10-30soldstatus Closed
-
2020-10-05historical Active Under Contract
-
2020-10-02$79,900 Active
-
2008-09-06historical
-
2008-05-07$39,900
ⓘ Source: listings_history table (triggers on properties + properties_extension) + one-shot
backfill from property_details.listing_events for pre-trigger history.
Tax reassessment forecast MO · Resets to sale price
- Current annual tax
- $1,460 · $122/mo
- Projected year-2 tax
- $1,460 · $122/mo
- Expected delta
- $0/yr ($0/mo · 0.0%)
ⓘ Screening estimate from a state-policy table — verify with the county assessor before closing.
Climate risk First Street
- Flood 1/10 Low FEMA zone X (unshaded) · 0% chance over 30 yrs
- Wildfire 1/10 Low
- Heat 4/10 Moderate 7 d/yr ≥107°F today · 17 d/yr by 30 yrs out
- Wind 2/10 Low
- Air quality 3/10 Moderate 3 unhealthy d/yr today · 3 by 30 yrs out
Nearby sold comps map
Loading sold comps map…
Walkable amenities ~0.75 mi
Loading nearby amenities…
Taxation est. · year 1
- Rental income
- $21,003
- − Mortgage interest
- −$8,010
- − Property taxes
- −$1,460
- − Insurance
- −$715
- − Repairs & maintenance
- −$1,680
- − Management
- −$1,680
- − HOA
- −$2,544
- − Depreciation
- −$4,160
- Taxable income
- $754
- Est. tax owed @ 24.0%
- −$181
- After-tax cash flow
- $2,694/yr
For passive investors: Depreciation is non-cash, so a rental often shows a tax loss while cash-flowing — sheltering income. Rental losses are passive: they offset passive income freely, and up to $25,000/yr can offset ordinary (W-2) income if you actively participate and your MAGI is under $100k (phasing out to $0 by $150k); unused losses carry forward. On sale, claimed depreciation is recaptured at up to 25%, and gains may owe capital-gains tax (a 1031 exchange can defer both). Figures are a year-1 estimate at your 24.0% rate — not tax advice; consult a CPA.
Schools (NCES district)
- District
- Grandview C-4
- NCES district ID
- 2913140
- Math proficiency
- 17% ▼ -12.00%
- Reading proficiency
- 32% ▼ -3.00%
- Median HH income
- $48,934
- Composite
- 21.49/100
- National rank
- #8326
- State rank
- #284 of 324 in MO
Livability — Grandview
- Score
- 61/100
- State rank
- #454
- US rank
- #18350
Category grades
Schools grade is shown separately in the Schools card above.
Census & demographics
- Census place
- Grandview, MO
- County
- Jackson County · 687,798 people
- City population
- 26,422
- Metro
- Kansas City, MO-KS
- Population (ZIP)
- 26,422
- Household income
- $53,216
- Rent vs Own
- Severe rent burden
- 1449.0
Population outlook (Jackson County) Hauer SSP2
- Today (2025)
- 719,589 people
- By 2030
- 731,456 · +1.6%
- By 2040
- 746,689 · +3.8%
- By 2050
- 749,289 · +4.1%
- By 2075
- 736,227 · +2.3%
- By 2100
- 668,210 · -7.1%
Race, ethnicity, and origin ACS 2023
- Neighborhood character
- Diverse neighborhood (Simpson 0.68)
- Race & ethnicity
- White 44% Black 33% Hispanic / Latino 14% Two or more races 7% Asian 3%
- Hispanic origin (detail)
- Mexican 8%
- Common ancestry
- Lithuanian 1% Romanian 1% Slovak 1%
- Foreign-born
- 9% · Canada, South Korea
- Languages at home
- 86% English-only · Spanish 11% Korean 1% Arabic 1%
Political lean MEDSL · Jackson
- 2024 margin
- D (+19.3) · D 58.9% · R 39.5% · Other 1.6%
- 2008→2024 swing
- -6.1pp toward R · 2008: 25.4pp · 2024: 19.3pp
- All cycles
- 2024: D+19.3 2020: D+22.0 2016: D+16.6 2012: D+19.0 2008: D+25.4
Not yet ingested
- Civics
- —
Market trends
- HPI YoY
- ▼ -142.24%
- Current HPI
- 321.6905
- Rent YoY
- ▲ 6.10%
- Metro
- Kansas City, MO-KS
- State GDP YoY
- ▲ 1.84%
- F500 in state
- 20
Industry mix (Fortune 500 HQ in MO)
| Industry | F500 HQs | Revenue |
|---|---|---|
| Healthcare | 1 | $163B |
|
||
| Insurance | 1 | $21B |
|
||
| Industrial Technology | 1 | $17B |
|
||
| Retail | 1 | $16B |
|
||
| Industrial Distribution | 1 | $10B |
|
||
| Utilities | 1 | $9B |
|
||
Price history
+258.4% since first listed12 events — show timeline
- 2026-04-28 Price Changed $143,000 Heartland MLS as Distributed by MLS Grid
- 2026-04-16 Listed $145,000 Heartland MLS as Distributed by MLS Grid
- 2024-12-16 Sold (Public Records) — Public Records
- 2024-12-12 Sold (MLS) — Heartland MLS as Distributed by MLS Grid
- 2024-11-11 Pending — Heartland MLS as Distributed by MLS Grid
- 2024-09-20 Listed $125,000 Heartland MLS as Distributed by MLS Grid
- 2020-11-09 Sold (Public Records) — Public Records
- 2020-10-30 Sold (MLS) — Heartland MLS as Distributed by MLS Grid
- 2020-10-05 Contingent — Heartland MLS as Distributed by MLS Grid
- 2020-10-02 Listed $79,900 Heartland MLS as Distributed by MLS Grid
- 2008-09-06 Listing Removed — Heartland MLS as Distributed by MLS Grid
- 2008-05-07 Listed $39,900 Heartland MLS as Distributed by MLS Grid
Property tax history
+6.6%/yrLatest (2025): $1,460 · +6.1% YoY. Source: county tax records.
Cash-flow waterfall
monthlySold comps — $/sqft
last 12 mo · ≤1 miLoading sold comps…