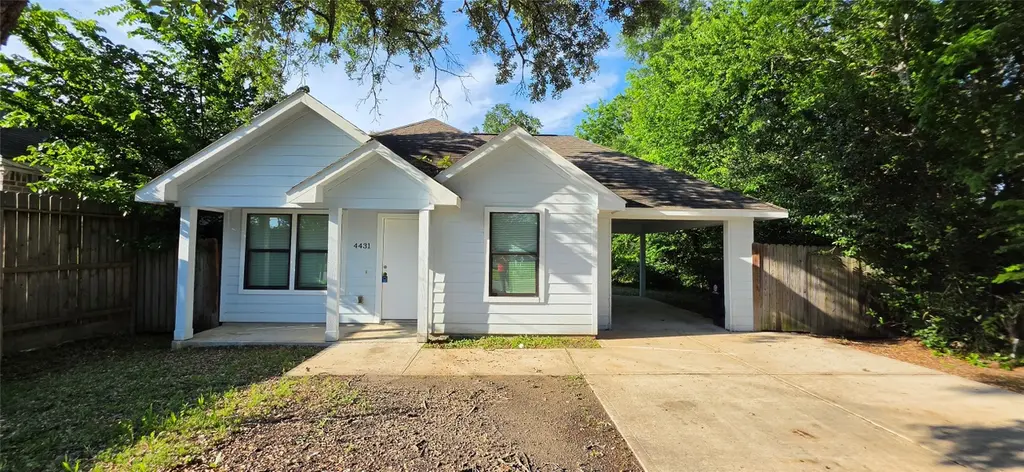
4431 Stassen St · Houston, TX
Flood risk 4/10 · Minor
- FEMA flood zone
- X (unshaded)
- Chance of flooding over 30 yrs
- 0.21%
- Est. flood insurance / yr
- $507 – $1,088
Fire risk 1/10 · Minimal
- Est. fire insurance / yr
- $1,222 – $2,270
Heat risk 9/10 · Severe
- Hot days now (above 109°F)
- 7 days/yr
- Hot days in 30 yrs
- 23 days/yr
Wind risk 9/10 · Severe
- Chance of severe wind over 30 yrs
- 99.0%
Air-quality risk 2/10 · Minimal
- Unhealthy air days now
- 2 days/yr
- Unhealthy air days in 30 yrs
- 2 days/yr
Risk factors via First Street. Map © Google.
Why this score? — see what drove the D- grade
The composite is a weighted blend of 9 inputs, each scored 0–100. Each bar is that input's sub-score; the figure is the points it added to the 100-point composite (weight × sub-score).
- Appreciation +10.0/10.0
- Cash flow +9.1/30.0
- Rent growth +3.7/5.0
- Livability +3.7/5.0
- 1% rule +3.4/10.0
- Schools +2.7/10.0
- DSCR +2.5/10.0
- Condition / age +2.5/5.0
- ARV discount +0.0/15.0
$205,000
🖨 Deal sheet 📄 Offer letter ✓ Due diligence
Listing remarks
Welcome to this charming home featuring 3 bedrooms and 2 full baths. The property includes a convenient carport with accessibility-friendly entry. Inside, you’ll find a welcoming family room that flows into an open-concept dining area and kitchen, complete with granite countertops and appliances. Enjoy brand-new vinyl flooring and fresh interior paint throughout, plus the convenience of an interior utility room. Ideally located with easy access to the 610 Loop and Highway 288. Just minutes from the Texas Medical Center, NRG Stadium, and downtown. Your future home puts you close to everything you need. Don't delay. Schedule your showing today!
Key facts
- Vinyl flooring
- Granite countertops
- 5,000 sq ft lot
Tags
Property features AI
Exterior
- Parking: Attached carport; Driveway; One carport space
- Security: Owned security system
- Utilities: Public water; Public sewer
- Home design: Residential property; Single-story (all main living on first floor); Built in 2016
- Construction: Cement siding; Composition roof; Slab foundation
- Exterior features: Private yard; Located in a subdivision
Interior
- Kitchen: Dishwasher; Free-standing range; Gas oven; Microwave; Refrigerator; Garbage disposal
- Bedrooms: Three first-floor bedrooms; Primary bedroom on first floor; Bedroom dimensions approximately 10 x 11, 10 x 10, and 12 x 9
- Flooring: Plank flooring; Vinyl flooring
- Bathrooms: Two full bathrooms
- Heating & cooling: Central heating (electric); Central air conditioning (electric)
- Interior features: Granite counters; Kitchen open to family room; Tub with shower; Ceiling fan(s)
- Laundry & utility: Washer hookup; Electric dryer hookup
Neighborhood map
What this means for you Summary
Snapshot
- This is a 2-bed/1.0-bath single-family listed at $205k.
Deal economics
- At list price, monthly cash flow is $-158 ($-2k/yr) — negative.
- To cash-flow at today's rent, offer at most $177k (13.6% below list).
- To meet the 1% rule (rent ≥ 1% of price), the offer needs to be $171k (16.4% below list).
- Recommended offer: $171k (16.4% below list) — sets the bar for 1% rule.
- Cap rate 5.4% vs local median 3.2% in Houston — top-decile yield for the area; either an underpriced asset or a hidden risk that comps aren't pricing in. Stress-test before assuming the spread holds.
Location & tenants
- Location reads 74/100 on livability (#184 in TX, #4,771 nationally) — a middle-class / working-renter tenant base. Strengths: amenities A+, cost of living A+, housing A+; Watch: crime F.
- Houston ISD (urban): math 27% / reading 35% proficiency, ranked #593 of 826 in TX (top 72%) — families likely to look elsewhere, expect single-tenant / working-renter base with shorter leases; 71% free/reduced lunch — lower-income household profile, screen leases tightly.
- Zoned schools: Attucks Middle (math 15% / reading 22%, grade F, #1,478 of 1,662 statewide, top 90%, 439 students, 98% FRL); Worthing H S (math 22% / reading 21%, grade F, #1,377 of 1,632 statewide, top 85%, 827 students, 96% FRL) — zoned schools average 97% FRL vs 71% district-wide (26 pts higher); higher-poverty schools than district average — tighter screening recommended.
- Market conditions: Rents rising fast (+4.8%/yr); 312 active listings in the ZIP; 35 comparable units currently listed for rent nearby; rentals at typical pace (median 18d on market — plan ~3-4 weeks tenant-placement turnaround); lower-income renter base — watch delinquency; 29,883 units permitted in Harris County in 2024 (8,621 in 5+ unit buildings).
- At $1,714/mo this rent would consume 55% of the median local household income ($37k/yr) (locally 1446% of renters already pay >50% of income on rent) — very limited rent-growth headroom before tenants either downsize or default.
Forward outlook
- In year one you build about $22k of equity ($1k loan paydown + $20k appreciation (10.0% local appreciation)).
- Harris County population projected at +47% by 2050 — long-run rental-demand tailwind backs the buy-and-hold thesis.
- By year 2, paydown + projected appreciation supports a ~$35k cash-out refi (75% LTV) — recoverable capital for the next deal without selling this one.
Negotiation context
- It's been on market 30 days — a 2% lower offer ($202k) is reasonable based on typical stale-listing flexibility.
Risks & watch-outs
- Climate carrying-cost: severe wind risk, 99% chance of damaging wind over 30y; extreme-heat days projected 7→23/yr by 2055 (HVAC capex compounding) — expect insurance premiums to compound above CPI over the hold.
Questions for the listing agent
- What do current leases actually rent for vs. the listed asking? Can we see a recent rent roll and the last 12 months of T-12 income?
- Is there a deadline driving the sale (1031 exchange, divorce, estate, relocation)? That informs how much negotiation room exists.
- Schools are D-rated, which usually means shorter tenancies and higher turnover. Who's the typical renter profile here, and what's been the actual vacancy rate?
- Crime grade is F in this area — have there been break-ins, vandalism, or insurance claims at this property in the last 3 years? What carrier currently insures it and at what premium?
- The area grade is low — what's the realistic commute time and amenity access for the typical tenant pool here? Any planned neighborhood developments (good or bad) we should know about?
- What's the average days-on-market for RENTAL listings here right now (not sales)? A rising rental-DOM trend means longer vacancies and softer asking-rent achievability than the comps imply.
- What's the recent tenant-quality profile in this submarket — average credit score on applications, eviction rate, late-payment / NSF rate, and stable-employment percentage? A property-management company in the area should have these aggregated.
- How much new for-sale + rental construction is in the pipeline within 1–3 miles? Heavy new supply typically softens prices + rents 12–24 months out; constrained supply supports both.
Investment metrics
- 1% rule
- 0.84% ✗
- Cap rate
- 5.37%
- Cash-on-cash
- -3.30%
- DSCR
- 0.85
- GRM
- 10.0
CMA / ARV
- ARV (on-the-fly)
- $163,170
- Comps found
- 12
Show comp detail 12 sales within ~0.75 mi
| Address | Dist | Beds/Ba | Sqft | Sold | Price | $/sf | Match |
|---|---|---|---|---|---|---|---|
| 4423 Stassen St | 0.02mi | 2/2.0 | 1,188 (+7%) | 8mo | $149,000 | $125 | 77 |
| 3902 Aledo St | 0.47mi | 3/1.0 (+1) | 1,176 (+6%) | 4mo | $90,000 | $77 | 60 |
| 4525 Newberry St | 0.33mi | 3/2.0 (+1) | 1,176 (+6%) | 8mo | $245,000 | $208 | 59 |
| 4429 Galesburg St | 0.36mi | 2/1.0 | 983 (-11%) | 13mo | $175,000 | $178 | 53 |
| 1109 Danube St | 0.48mi | 2/1.0 | 945 (-15%) | 0mo | $87,000 | $92 | 52 |
| 8122 Corinth St Unit B | 0.61mi | 3/2.0 (+1) | 1,094 (-1%) | 12mo | $286,000 | $261 | 50 |
| 4410 Knoxville St | 0.43mi | 3/2.0 (+1) | 1,188 (+7%) | 13mo | $150,000 | $126 | 49 |
| 4737 Alvin St | 0.67mi | 3/1.0 (+1) | 1,216 (+10%) | 4mo | $95,000 | $78 | 44 |
| 4522 Larkspur St | 0.71mi | 3/2.0 (+1) | 1,040 (-6%) | 7mo | $155,000 | $149 | 42 |
| 8019 Lawler St | 0.70mi | 2/1.0 | 1,008 (-9%) | 14mo | $98,000 | $97 | 40 |
| 1026 Theresa St | 0.59mi | 3/2.0 (+1) | 960 (-14%) | 5mo | $209,900 | $219 | 37 |
| 8030 Lawler St | 0.72mi | 3/1.0 (+1) | 952 (-14%) | 10mo | $139,900 | $147 | 29 |
Match score weights: distance 35% · size 25% · config 20% · recency 20%. Top-matched comps best support the ARV.
Projected returns pro-forma
10.0% appreciation · 4.77% rent growth · sell at horizon
- IRR
- 22.5%
- Equity multiple
- 2.83×
- Total profit
- $104,772
- Equity at exit
- $184,680
- IRR
- 20.6%
- Equity multiple
- 6.63×
- Total profit
- $323,398
- Equity at exit
- $398,270
Cash invested: $57,400 (down + closing). Projections, not guarantees.
Landlord ↔ Tenant lean methodology
- Overall (STATE)
- 87 Strongly Landlord-Friendly
- State Texas
- 87 Strongly Landlord-Friendly · R+5
- County
- — inherits STATE
- City
- — inherits STATE
ZIP-level market 77051
- Home prices YoY
- 9.7%
- Rents YoY
- 4.8%
- Active inventory
- 312
- Price-to-rent
- 10.0×
Monthly cashflow live
- Estimated rent
- $1,714 high interval (Pro) →
- Mortgage (P&I)
- −$1,075
- Tax from tax record
- −$352 /mo · $4,225/yr
- Insurance
- −$85
- HOA
- −$0
- Vacancy / Maint / Mgmt
- −$360
- Net cashflow
- $-158
Break-even live
UW: 25.0% down · 7.5% · 30yr · 1.5% tax · 5.0% vac · 8.0% maint · 8.0% mgmt
Financing live
Cash to close
- Down payment
- $51,250
- Closing costs
- $6,150
- Reserves months
- —
- Total cash needed
- —
Loan-product check · same deal, 3 products live
Conventional
25% down · 7.5% · 30yr
- Down + closing
- —
- Monthly P&I
- —
- Monthly cashflow
- —
- DSCR
- —
- Eligible?
- —
Personal DTI + credit; lowest rate.
DSCR
20% down · 8.5% · 30yr
- Down + closing
- —
- Monthly P&I
- —
- Monthly cashflow
- —
- DSCR
- —
- Eligible?
- —
No personal income docs; deal must DSCR.
Hard money
10% down · 12.0% · 12mo
- Down + closing
- —
- Monthly P&I
- —
- Monthly cashflow
- —
- DSCR
- —
- Eligible?
- —
Short-term bridge; refi at stabilization.
Rent comps 35 comps
| Address | Beds | Baths | Sqft | Rent | $/sqft | DOM | Units | Dist |
|---|---|---|---|---|---|---|---|---|
| 4410 Bellfort Ave Unit 4404 8 Houston, TX | 2.0 | 1.0 | 812 | $999 | $1.23 | 7d | 1 | 0.12mi |
| 8521 Dosia St Houston, TX | 3.0 | 2.0 | 1028 | $1,665 | $1.62 | 13d | 1 | 0.28mi |
| 4609 Bricker St Unit B Houston, TX | 3.0 | 2.5 | 1300 | $3,500 | $2.69 | 13d | 1 | 0.35mi |
| 4609 Bricker St Unit ABC Houston, TX | 3.0 | 2.5 | 1375 | $3,500 | $2.55 | 11d | 1 | 0.35mi |
| 4609 Bricker St Unit C Houston, TX | 2.0 | 1.5 | 1100 | $3,200 | $2.91 | 13d | 1 | 0.35mi |
| 4615 Redbud St Unit b Houston, TX | 3.0 | 2.0 | 872 | $1,149 | $1.32 | 24d | 1 | 0.39mi |
| 8107 Calhoun Rd Houston, TX | 3.0 | 2.5 | 1304 | $2,250 | $1.73 | 24d | 1 | 0.44mi |
| 4526 Knoxville St Unit A Houston, TX | 3.0 | 2.5 | 1474 | $1,775 | $1.20 | 15d | 1 | 0.45mi |
| 4530 Mayflower St Houston, TX | 3.0 | 2.0 | 1302 | $1,800 | $1.38 | 43d | 1 | 0.48mi |
| 7818 Calhoun Rd Unit 8 Houston, TX | 2.0 | 1.0 | 800 | $1,200 | $1.50 | 43d | 1 | 0.48mi |
| 7823 Gladstone St Houston, TX | 2.0 | 2.0 | 850 | $1,600 | $1.88 | 43d | 1 | 0.55mi |
| 8328 Corinth St Unit B Houston, TX | 3.0 | 2.5 | 1500 | $2,800 | $1.87 | 20d | 1 | 0.56mi |
| 1600 Jester St Houston, TX | 1.0–2.0 | 1.0 | 707 | $1,395 | $1.97 | 2d | 4 | 0.60mi |
| 8010 Livingston St Houston, TX | 3.0 | 2.0 | 1400 | $1,800 | $1.29 | 43d | 1 | 0.68mi |
| 4326 Larkspur St Unit 3 Houston, TX | 2.0 | 1.0 | 800 | $1,200 | $1.50 | 17d | 1 | 0.69mi |
| 4207 Phlox St Houston, TX | 2.0 | 1.0 | 736 | $962 | $1.31 | 2d | 1 | 0.82mi |
| 4205 Phlox St Unit 2 BEDROOM 6 Houston, TX | 2.0 | 1.0 | 736 | $860 | $1.17 | 18d | 1 | 0.83mi |
| 7918 Jutland Rd Houston, TX | 3.0 | 1.0 | 996 | $1,295 | $1.30 | 43d | 1 | 0.87mi |
| 4723 Mallow St Houston, TX | 3.0 | 2.5 | 1472 | $1,850 | $1.26 | 5d | 1 | 0.90mi |
| 7812 Tierwester St Houston, TX | 2.0 | 1.0 | 800 | $950 | $1.19 | 16d | 2 | 1.02mi |
| 4007 Corder St Houston, TX | 2.0 | 1.0 | 814 | $885 | $1.09 | 24d | 1 | 1.03mi |
| 5314 Northridge Dr Unit A Houston, TX | 3.0 | 2.0 | 872 | $1,185 | $1.36 | 43d | 1 | 1.13mi |
| 7032 Conley St Houston, TX | 3.0 | 2.0 | 1220 | $2,850 | $2.34 | 43d | 1 | 1.16mi |
| 9414 Heno St Unit 13 Houston, TX | 2.0 | 1.0 | 824 | $900 | $1.09 | 24d | 1 | 1.16mi |
| 5036 Mallow St Houston, TX | 3.0 | 3.0 | 1472 | $2,050 | $1.39 | 43d | 1 | 1.19mi |
| 3137 W Bellfort Ave Houston, TX | 2.0 | 2.0 | 1164 | $1,802 | $1.55 | 43d | 1 | 1.20mi |
| 4810 Wilmington St Unit A Houston, TX | 3.0 | 2.0 | 1165 | $1,650 | $1.42 | 43d | 1 | 1.22mi |
| 4205 Grassmere St Houston, TX | 2.0 | 1.0 | 824 | $900 | $1.09 | 24d | 1 | 1.23mi |
| 4112 Grassmere St Houston, TX | 2.0 | 1.0 | 711 | $700 | $0.98 | 11d | 1 | 1.27mi |
| 4918 Wilmington St Unit A Houston, TX | 3.0 | 3.0 | 1300 | $2,100 | $1.62 | 43d | 1 | 1.28mi |
| 2889 Reed Rd Houston, TX | 1.0–2.0 | 1.0–2.0 | 997 | $1,648 | $1.65 | 3d | 2 | 1.39mi |
| 3603 Alice St Houston, TX | 1.0 | 1.0 | 848 | $1,000 | $1.18 | 4d | 1 | 1.46mi |
| 3603 Alice St Houston, TX | 2.0 | 1.0 | 850 | $1,000 | $1.18 | 4d | 1 | 1.46mi |
| 3603 Alice St Unit 15 Houston, TX | 2.0 | 1.0 | 850 | $999 | $1.18 | 7d | 1 | 1.47mi |
| 3603 Alice St Unit 3725-B Houston, TX | 1.0 | 1.0 | 850 | $999 | $1.18 | 7d | 1 | 1.47mi |
Listing history 14 events
-
2026-06-18days on market $205,000 Active 30 DOM
-
2026-06-17days on market $205,000 Active 29 DOM
-
2026-06-16days on market $205,000 Active 28 DOM
-
2026-06-15days on market $205,000 Active 27 DOM
-
2026-06-13days on market $205,000 Active 25 DOM
-
2026-06-10days on market $205,000 Active 21 DOM
-
2026-06-08days on market $205,000 Active 20 DOM
-
2026-06-07days on market $205,000 Active 19 DOM
-
2026-06-04days on market $205,000 Active 16 DOM
-
2026-06-01days on market $205,000 Active 13 DOM
-
2026-05-31days on market $205,000 Active 12 DOM
-
2026-05-19$205,000 Active
-
2017-05-10soldstatus
-
1993-10-05soldstatus
ⓘ Source: listings_history table (triggers on properties + properties_extension) + one-shot
backfill from property_details.listing_events for pre-trigger history.
Tax reassessment forecast TX · Resets to sale price
- Current annual tax
- $4,225 · $352/mo
- Projected year-2 tax
- $4,225 · $352/mo
- Expected delta
- $0/yr ($0/mo · 0.0%)
ⓘ Screening estimate from a state-policy table — verify with the county assessor before closing.
Climate risk First Street
- Flood 4/10 Moderate FEMA zone X (unshaded) · 21% chance over 30 yrs
- Wildfire 1/10 Low
- Heat 9/10 Extreme 7 d/yr ≥109°F today · 23 d/yr by 30 yrs out
- Wind 9/10 Extreme 99% chance of damaging wind over 30 yrs
- Air quality 2/10 Low 2 unhealthy d/yr today · 2 by 30 yrs out
Nearby sold comps map
Loading sold comps map…
Walkable amenities ~0.75 mi
Loading nearby amenities…
Taxation est. · year 1
- Rental income
- $20,574
- − Mortgage interest
- −$11,483
- − Property taxes
- −$4,225
- − Insurance
- −$1,025
- − Repairs & maintenance
- −$1,646
- − Management
- −$1,646
- − Depreciation
- −$5,964
- Taxable loss
- −$5,415
- Est. tax savings @ 24.0%
- +$1,299
- After-tax cash flow
- $-597/yr
For passive investors: Depreciation is non-cash, so a rental often shows a tax loss while cash-flowing — sheltering income. Rental losses are passive: they offset passive income freely, and up to $25,000/yr can offset ordinary (W-2) income if you actively participate and your MAGI is under $100k (phasing out to $0 by $150k); unused losses carry forward. On sale, claimed depreciation is recaptured at up to 25%, and gains may owe capital-gains tax (a 1031 exchange can defer both). Figures are a year-1 estimate at your 24.0% rate — not tax advice; consult a CPA.
Schools (NCES district)
- District
- Houston ISD
- NCES district ID
- 4823640
- Math proficiency
- 27% ▼ -18.00%
- Reading proficiency
- 35% ▼ -6.00%
- Median HH income
- $46,054
- Composite
- 26.63/100
- National rank
- #7173
- State rank
- #593 of 826 in TX
Livability — Houston
- Score
- 74/100
- State rank
- #184
- US rank
- #4771
Category grades
Schools grade is shown separately in the Schools card above.
Census & demographics
- Census place
- Houston, TX
- County
- Harris County · 4,702,590 people
- City population
- 3,226,434
- Metro
- Houston-The Woodlands-Sugar Land, TX
- Population (ZIP)
- 19,795
- Household income
- $37,415
- Rent vs Own
- Severe rent burden
- 1446.0
Population outlook (Harris County) Hauer SSP2
- Today (2025)
- 5,571,493 people
- By 2030
- 6,089,821 · +9.3%
- By 2040
- 7,142,806 · +28.2%
- By 2050
- 8,185,864 · +46.9%
- By 2075
- 10,574,329 · +89.8%
- By 2100
- 12,109,958 · +117.4%
Race, ethnicity, and origin ACS 2023
- Neighborhood character
- Predominantly Black (77%)
- Race & ethnicity
- Black 77% Hispanic / Latino 16% Two or more races 11% White 3%
- Hispanic origin (detail)
- Mexican 6% Puerto Rican 1%
- Foreign-born
- 8% · Canada, China
- Languages at home
- 88% English-only · Spanish 10%
Political lean MEDSL · Harris
- 2024 margin
- Lean D (+5.5) · D 52.0% · R 46.4% · Other 1.6%
- 2008→2024 swing
- +3.9pp toward D · 2008: 1.6pp · 2024: 5.5pp
- All cycles
- 2024: D+5.5 2020: D+13.3 2016: D+12.4 2012: D+0.1 2008: D+1.6
Not yet ingested
- Civics
- —
Market trends
- HPI YoY
- ▲ 16.02%
- Current HPI
- 180.4283
- Rent YoY
- ▲ 4.77%
- Metro
- Houston-The Woodlands-Sugar Land, TX
- State GDP YoY
- ▲ 3.95%
- F500 in state
- 110
Industry mix (Fortune 500 HQ in TX)
| Industry | F500 HQs | Revenue |
|---|---|---|
| Energy | 16 | $1,198B |
|
||
| Technology | 5 | $198B |
|
||
| Engineering / Construction | 4 | $72B |
|
||
| Energy Services | 3 | $60B |
|
||
| Utilities | 3 | $41B |
|
||
| Healthcare | 2 | $330B |
|
||
Price history
3 events — show timeline
- 2026-05-19 Listed $205,000 HARMLS
- 2017-05-10 Sold (Public Records) — Public Records
- 1993-10-05 Sold (Public Records) — Public Records
Property tax history
+9.8%/yrLatest (2025): $4,225 · -8.4% YoY. Source: county tax records.
Cash-flow waterfall
monthlySold comps — $/sqft
last 12 mo · ≤1 miLoading sold comps…