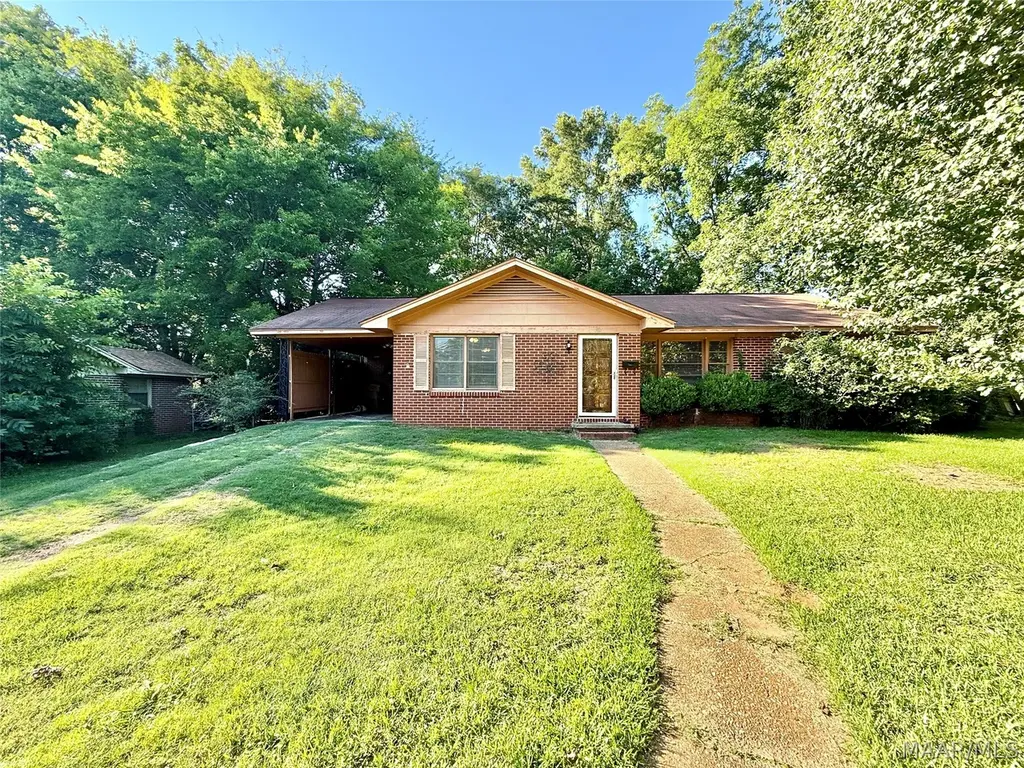
407 Laurel Ave · Selma, AL
Flood risk 1/10 · Minimal
- FEMA flood zone
- X (unshaded)
- Chance of flooding over 30 yrs
- 0.0%
- Est. flood insurance / yr
- $507 – $1,088
Fire risk 4/10 · Minor
- Est. fire insurance / yr
- $916 – $1,700
Heat risk 8/10 · Major
- Hot days now (above 108°F)
- 7 days/yr
- Hot days in 30 yrs
- 20 days/yr
Wind risk 8/10 · Major
- Chance of severe wind over 30 yrs
- 80.0%
Air-quality risk 2/10 · Minimal
- Unhealthy air days now
- 0 days/yr
- Unhealthy air days in 30 yrs
- 1 days/yr
Risk factors via First Street. Map © Google.
Why this score? — see what drove the B grade
The composite is a weighted blend of 9 inputs, each scored 0–100. Each bar is that input's sub-score; the figure is the points it added to the 100-point composite (weight × sub-score).
- Cash flow +30.0/30.0
- ARV discount +15.0/15.0
- DSCR +10.0/10.0
- 1% rule +8.7/10.0
- Livability +2.8/5.0
- Rent growth +2.5/5.0
- Condition / age +2.5/5.0
- Schools +0.9/10.0
- Appreciation +0.0/10.0
$68,000
🖨 Deal sheet 📄 Offer letter ✓ Due diligence
Key facts
- 0.26 acre lot
- Parking
- Built 1959
Property features AI
Finance
- Financial info: Operating expenses: None (multi-unit field)
Exterior
- Parking: Attached carport with one carport space
- Security: Fire alarm
- Utilities: Cable available; Electricity available; Natural gas available; High-speed internet available; Public water; Public sewer
- Home design: One-story home
- Construction: Brick and wood siding exterior; Slab foundation
- Exterior features: Fully fenced yard; Storage structure; Level lot; Mature trees; Subdivision setting; Public paved road frontage
Interior
- Kitchen: Dishwasher; Electric range with smooth cooktop; Range hood; Refrigerator
- Bedrooms: Two bedrooms on the first floor
- Flooring: Carpet; Tile; Vinyl
- Bathrooms: Two full bathrooms on the first floor
- Heating & cooling: Central electric heating; Central air conditioning; Ceiling fans
- Interior features: Blinds and window treatments; Breakfast bar
- Laundry & utility: Washer hookup; Dryer hookup; Electric water heater
Neighborhood map
What this means for you Summary
Snapshot
- This is a 3-bed/1.0-bath single-family listed at $68k.
Deal economics
- At list price, monthly cash flow is $335 ($4k/yr) — positive.
- The deal already cash-flows at list — no discount required.
- Meets the 1% rule at list price ($929 rent vs $68k).
- Cap rate 12.2% vs local median 7.5% in Selma — top-decile yield for the area; either an underpriced asset or a hidden risk that comps aren't pricing in. Stress-test before assuming the spread holds.
Location & tenants
- Location reads 56/100 on livability (#407 in AL) — a working-class tenant base; expect higher turnover. Strengths: cost of living A+, housing B; Watch: schools F, crime F, amenities F.
- Selma City (town): math 2% / reading 23% proficiency, ranked #118 of 129 in AL (top 92%) — low school quality limits family demand, transient renter base, plan for 1-2y turnover; 84% free/reduced lunch — lower-income household profile, screen leases tightly.
- Market conditions: 104 active listings in the ZIP; 1 comparable units currently listed for rent nearby; 7 units permitted in Dallas County in 2024 (0 in 5+ unit buildings).
Forward outlook
- Local home prices are declining (-3.0%/yr); year-one equity from $470 of loan paydown is wiped out by about $2k of value loss. Plan a longer hold.
- Dallas County population projected at -36% by 2050 — secular population decline; favor cash flow + early exit over multi-decade hold.
- At projected returns (-3.0% appreciation + 3.0% rent growth), your $19k cash investment doubles in ~6 years — after that, you're playing with house money.
Negotiation context
- Only 1 days on market — expect competitive offers; lowballing is unlikely to land.
Risks & watch-outs
- Watch-outs: built in 1959 — expect roof / HVAC / electrical / plumbing capex.
- Climate carrying-cost: severe wind risk, 80% chance of damaging wind over 30y; extreme-heat days projected 7→20/yr by 2055 (HVAC capex compounding) — expect insurance premiums to compound above CPI over the hold.
Questions for the listing agent
- Built in 1959 — when were the roof, HVAC, electrical panel, plumbing, and water heater last replaced?
- Is there a deadline driving the sale (1031 exchange, divorce, estate, relocation)? That informs how much negotiation room exists.
- Schools are F-rated, which usually means shorter tenancies and higher turnover. Who's the typical renter profile here, and what's been the actual vacancy rate?
- Crime grade is F in this area — have there been break-ins, vandalism, or insurance claims at this property in the last 3 years? What carrier currently insures it and at what premium?
- What's the average days-on-market for RENTAL listings here right now (not sales)? A rising rental-DOM trend means longer vacancies and softer asking-rent achievability than the comps imply.
- What's the recent tenant-quality profile in this submarket — average credit score on applications, eviction rate, late-payment / NSF rate, and stable-employment percentage? A property-management company in the area should have these aggregated.
- How much new for-sale + rental construction is in the pipeline within 1–3 miles? Heavy new supply typically softens prices + rents 12–24 months out; constrained supply supports both.
Investment metrics
- 1% rule
- 1.37% ✓
- Cap rate
- 12.21%
- Cash-on-cash
- 21.13%
- DSCR
- 1.94
- GRM
- 6.1
CMA / ARV
- ARV (on-the-fly)
- $86,996
- Comps found
- 9
Show comp detail 9 sales within ~0.75 mi
| Address | Dist | Beds/Ba | Sqft | Sold | Price | $/sf | Match |
|---|---|---|---|---|---|---|---|
| 512 Columbus Dr | 0.32mi | 3/2.0 | 1,703 (+2%) | 1mo | $130,000 | $76 | 77 |
| 2521 Nottingham Dr | 0.29mi | 3/2.0 | 1,872 (+12%) | 7mo | $125,000 | $67 | 57 |
| 210 9th Ave | 0.48mi | 4/2.0 (+1) | 1,793 (+7%) | 4mo | $102,000 | $57 | 53 |
| 228 Mcdonald Ave | 0.43mi | 3/2.0 | 1,520 (-9%) | 16mo | $42,500 | $28 | 47 |
| 223 Mcdonald Ave | 0.46mi | 3/1.0 | 1,450 (-13%) | 11mo | $75,000 | $52 | 47 |
| 325 Crestwood Dr | 0.53mi | 3/1.5 | 1,452 (-13%) | 11mo | $90,000 | $62 | 42 |
| 1918 Church St | 0.72mi | 3/1.0 | 1,599 (-4%) | 22mo | $6,000 | $4 | 41 |
| 2116 Elkdale St | 0.51mi | 3/2.0 | 1,472 (-12%) | 15mo | $60,000 | $41 | 40 |
| 1108 9th Ave | 0.74mi | 2/2.0 (-1) | 1,472 (-12%) | 21mo | $17,000 | $12 | 19 |
Match score weights: distance 35% · size 25% · config 20% · recency 20%. Top-matched comps best support the ARV.
Projected returns pro-forma
-3.0% appreciation · 3.0% rent growth · sell at horizon
- IRR
- 13.6%
- Equity multiple
- 1.54×
- Total profit
- $10,304
- Equity at exit
- $10,139
- IRR
- 22.4%
- Equity multiple
- 2.91×
- Total profit
- $36,347
- Equity at exit
- $5,879
Cash invested: $19,040 (down + closing). Projections, not guarantees.
Landlord ↔ Tenant lean methodology
- Overall (STATE)
- 90 Strongly Landlord-Friendly
- State Alabama
- 90 Strongly Landlord-Friendly · R+15
- County
- — inherits STATE
- City
- — inherits STATE
ZIP-level market 36701
- Home prices YoY
- -6.3%
- Active inventory
- 104
- Price-to-rent
- 6.1×
Monthly cashflow live
- Estimated rent
- $929 medium interval (Pro) →
- Mortgage (P&I)
- −$357
- Tax from tax record
- −$14 /mo · $165/yr
- Insurance
- −$28
- HOA
- −$0
- Vacancy / Maint / Mgmt
- −$195
- Net cashflow
- $335
Break-even live
UW: 25.0% down · 7.5% · 30yr · 1.5% tax · 5.0% vac · 8.0% maint · 8.0% mgmt
Financing live
Cash to close
- Down payment
- $17,000
- Closing costs
- $2,040
- Reserves months
- —
- Total cash needed
- —
Loan-product check · same deal, 3 products live
Conventional
25% down · 7.5% · 30yr
- Down + closing
- —
- Monthly P&I
- —
- Monthly cashflow
- —
- DSCR
- —
- Eligible?
- —
Personal DTI + credit; lowest rate.
DSCR
20% down · 8.5% · 30yr
- Down + closing
- —
- Monthly P&I
- —
- Monthly cashflow
- —
- DSCR
- —
- Eligible?
- —
No personal income docs; deal must DSCR.
Hard money
10% down · 12.0% · 12mo
- Down + closing
- —
- Monthly P&I
- —
- Monthly cashflow
- —
- DSCR
- —
- Eligible?
- —
Short-term bridge; refi at stabilization.
Rent comps 1 comps
| Address | Beds | Baths | Sqft | Rent | $/sqft | DOM | Units | Dist |
|---|---|---|---|---|---|---|---|---|
| 1300 Cloverdale Rd Selma, AL | 2.0–3.0 | 1.5–2.5 | 1204 | $929 | $0.77 | 21d | 1 | 1.01mi |
Listing history 1 events
-
2026-06-18$68,000 Active 1 DOM
ⓘ Source: listings_history table (triggers on properties + properties_extension) + one-shot
backfill from property_details.listing_events for pre-trigger history.
Tax reassessment forecast AL · Resets to sale price
- Current annual tax
- $165 · $14/mo
- Projected year-2 tax
- $279 · $23/mo
- Expected delta
- +$114/yr (+$10/mo · 69.4%)
ⓘ Screening estimate from a state-policy table — verify with the county assessor before closing.
Climate risk First Street
- Flood 1/10 Low FEMA zone X (unshaded) · 0% chance over 30 yrs
- Wildfire 4/10 Moderate
- Heat 8/10 Severe 7 d/yr ≥108°F today · 20 d/yr by 30 yrs out
- Wind 8/10 Severe 80% chance of damaging wind over 30 yrs
- Air quality 2/10 Low 0 unhealthy d/yr today · 1 by 30 yrs out
Nearby sold comps map
Loading sold comps map…
Walkable amenities ~0.75 mi
Loading nearby amenities…
Taxation est. · year 1
- Rental income
- $11,148
- − Mortgage interest
- −$3,809
- − Property taxes
- −$165
- − Insurance
- −$340
- − Repairs & maintenance
- −$892
- − Management
- −$892
- − Depreciation
- −$1,978
- Taxable income
- $3,072
- Est. tax owed @ 24.0%
- −$737
- After-tax cash flow
- $3,286/yr
For passive investors: Depreciation is non-cash, so a rental often shows a tax loss while cash-flowing — sheltering income. Rental losses are passive: they offset passive income freely, and up to $25,000/yr can offset ordinary (W-2) income if you actively participate and your MAGI is under $100k (phasing out to $0 by $150k); unused losses carry forward. On sale, claimed depreciation is recaptured at up to 25%, and gains may owe capital-gains tax (a 1031 exchange can defer both). Figures are a year-1 estimate at your 24.0% rate — not tax advice; consult a CPA.
Schools (NCES district)
- District
- Selma City
- NCES district ID
- 0102970
- Math proficiency
- 2% ▼ -24.00%
- Reading proficiency
- 23% ▼ -2.00%
- Median HH income
- $23,380
- Composite
- 9.07/100
- National rank
- #9870
- State rank
- #118 of 129 in AL
Livability — Selma
- Score
- 56/100
- State rank
- #407
- US rank
- #22550
Category grades
Schools grade is shown separately in the Schools card above.
Census & demographics
- Census place
- Selma, AL
- Population (ZIP)
- 22,358
Population outlook (Dallas County) Hauer SSP2
- Today (2025)
- 35,464 people
- By 2030
- 32,631 · -8.0%
- By 2040
- 27,246 · -23.2%
- By 2050
- 22,691 · -36.0%
- By 2075
- 14,867 · -58.1%
- By 2100
- 10,285 · -71.0%
Race, ethnicity, and origin ACS 2023
- Neighborhood character
- Predominantly Black (69%)
- Race & ethnicity
- Black 69% White 28% Hispanic / Latino 2%
- Common ancestry
- Serbian 1% Lithuanian 1% Slovak 1%
- Foreign-born
- 2% · Canada
- Languages at home
- 98% English-only · Spanish 1%
Political lean MEDSL · Dallas
- 2024 margin
- Solid D (+32.5) · D 65.9% · R 33.4%
- 2008→2024 swing
- -2.0pp toward R · 2008: 34.5pp · 2024: 32.5pp
- All cycles
- 2024: D+32.5 2020: D+37.5 2016: D+37.6 2012: D+39.7 2008: D+34.5
Not yet ingested
- Civics
- —
Market trends
- HPI YoY
- ▼ -11.98%
- Current HPI
- 176.6034
- Rent YoY
- —
- Metro
- —
- State GDP YoY
- ▲ 2.94%
- F500 in state
- 4
Industry mix (Fortune 500 HQ in AL)
| Industry | F500 HQs | Revenue |
|---|---|---|
| Financial Services | 1 | $8B |
|
||
| Healthcare | 1 | $5B |
|
||
Price history
1 event — show timeline
- 2026-06-18 Listed $68,000 MAAR
Property tax history
+1.3%/yrLatest (2021): $165 · +0.0% YoY. Source: county tax records.
Cash-flow waterfall
monthlySold comps — $/sqft
last 12 mo · ≤1 miLoading sold comps…