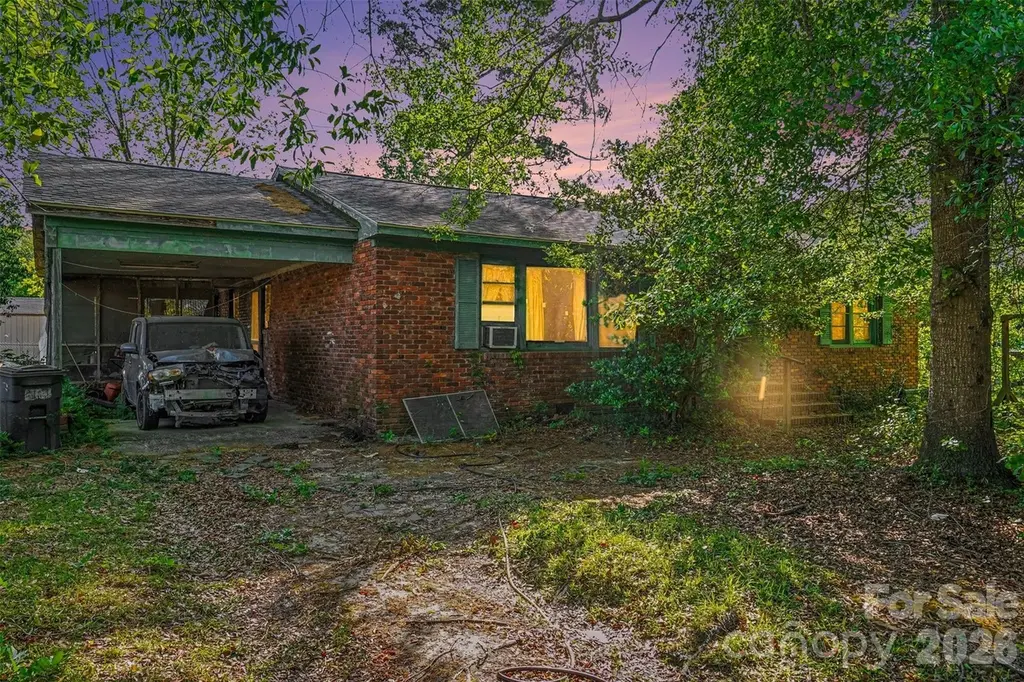
105 W Temple Ave · Rockingham, NC
Flood risk 1/10 · Minimal
- FEMA flood zone
- X (unshaded)
- Chance of flooding over 30 yrs
- 0.0%
- Est. flood insurance / yr
- $507 – $1,088
Fire risk 5/10 · Moderate
- Est. fire insurance / yr
- $906 – $1,684
Heat risk 8/10 · Major
- Hot days now (above 109°F)
- 7 days/yr
- Hot days in 30 yrs
- 16 days/yr
Wind risk 6/10 · Moderate
- Chance of severe wind over 30 yrs
- 61.0%
Air-quality risk 1/10 · Minimal
- Unhealthy air days now
- 0 days/yr
- Unhealthy air days in 30 yrs
- 0 days/yr
Risk factors via First Street. Map © Google.
Why this score? — see what drove the B grade
The composite is a weighted blend of 9 inputs, each scored 0–100. Each bar is that input's sub-score; the figure is the points it added to the 100-point composite (weight × sub-score).
- Cash flow +30.0/30.0
- DSCR +10.0/10.0
- 1% rule +8.0/10.0
- ARV discount +7.5/15.0
- Appreciation +5.0/10.0
- Livability +3.2/5.0
- Schools +2.7/10.0
- Rent growth +2.5/5.0
- Condition / age +2.5/5.0
$89,900
🖨 Deal sheet (PDF) 📄 Offer letter ✓ Due diligence
Listing remarks
Brick Ranch Opportunity in Established Community. Located in a highly desirable, well-established neighborhood, this classic brick ranch offers an excellent opportunity for investors, renovators, or buyers looking to build equity. Featuring 3 bedrooms and 2 bathrooms, the home sits on a solid footprint with a traditional layout that provides a strong foundation for renovation or reimagining. While the property does require significant updates and repairs, its location and structure make it an ideal candidate for a fix-and-flip, rental investment, or long-term hold. The surrounding community is known for its mature trees, stable values, and convenient access to local amenities, schools, and
Key facts
- Mature trees
- 0.33 acre lot
- Built 1964
Tags
Neighborhood map
What this means for you Summary
Snapshot
- This is a 3-bed/2.0-bath single-family listed at $90k.
Deal economics
- At list price, monthly cash flow is $363 ($4k/yr) — positive.
- The deal already cash-flows at list — no discount required.
- Meets the 1% rule at list price ($1k rent vs $90k).
- Cap rate 11.1% vs local median 6.0% in Rockingham — top-decile yield for the area; either an underpriced asset or a hidden risk that comps aren't pricing in. Stress-test before assuming the spread holds.
Location & tenants
- Location reads 63/100 on livability (#403 in NC) — a middle-class / working-renter tenant base. Strengths: cost of living A+, housing A, health & safety B+; Watch: crime F, amenities F, commute F.
- Richmond County Schools (town): math 30% / reading 36% proficiency, ranked #139 of 178 in NC (top 78%) — families likely to look elsewhere, expect single-tenant / working-renter base with shorter leases; 70% free/reduced lunch — lower-income household profile, screen leases tightly.
- Zoned schools: Richmond Senior High (math 58% / reading 38%, grade D, #329 of 535 statewide, top 62%, 1,286 students, 99% FRL) — zoned schools average 99% FRL vs 70% district-wide (30 pts higher); higher-poverty schools than district average — tighter screening recommended.
- Zoned-school proficiency averages 48% at this address vs 33% district-wide (+15 pts) — the actual schools serving this property are materially stronger than the Richmond County Schools average implies; a family-tenant draw the district grade alone would hide.
- Market conditions: 1 active listings in the ZIP; 54 units permitted in Richmond County in 2024 (0 in 5+ unit buildings).
Forward outlook
- In year one you build about $3k of equity ($622 loan paydown + $3k appreciation (3.0% local appreciation)).
- Richmond County population projected at -22% by 2050 — secular population decline; favor cash flow + early exit over multi-decade hold.
- At projected returns (3.0% appreciation + 3.0% rent growth), your $25k cash investment doubles in ~4 years — after that, you're playing with house money.
- By year 10, paydown + projected appreciation supports a ~$32k cash-out refi (75% LTV) — recoverable capital for the next deal without selling this one.
Negotiation context
- Only 2 days on market — expect competitive offers; lowballing is unlikely to land.
Risks & watch-outs
- Climate carrying-cost: major wind risk, 61% chance of damaging wind over 30y; moderate wildfire risk; extreme-heat days projected 7→16/yr by 2055 (HVAC capex compounding) — expect insurance premiums to compound above CPI over the hold.
Questions for the listing agent
- Built in 1964 — when were the roof, HVAC, electrical panel, plumbing, and water heater last replaced?
- Is there a deadline driving the sale (1031 exchange, divorce, estate, relocation)? That informs how much negotiation room exists.
- Schools are D-rated, which usually means shorter tenancies and higher turnover. Who's the typical renter profile here, and what's been the actual vacancy rate?
- Crime grade is F in this area — have there been break-ins, vandalism, or insurance claims at this property in the last 3 years? What carrier currently insures it and at what premium?
- What's the average days-on-market for RENTAL listings here right now (not sales)? A rising rental-DOM trend means longer vacancies and softer asking-rent achievability than the comps imply.
- What's the recent tenant-quality profile in this submarket — average credit score on applications, eviction rate, late-payment / NSF rate, and stable-employment percentage? A property-management company in the area should have these aggregated.
- How much new for-sale + rental construction is in the pipeline within 1–3 miles? Heavy new supply typically softens prices + rents 12–24 months out; constrained supply supports both.
Investment metrics
- 1% rule
- 1.30% ✓
- Cap rate
- 11.14%
- Cash-on-cash
- 17.32%
- DSCR
- 1.77
- GRM
- 6.4
CMA / ARV
- ARV (on-the-fly)
- $199,368
- Comps found
- 7
Show comp detail 7 sales within ~0.75 mi
| Address | Dist | Beds/Ba | Sqft | Sold | Price | $/sf | Match |
|---|---|---|---|---|---|---|---|
| 105 W Temple Ave | 0.00mi | 3/2.0 | 1,404 (0%) | 0mo | $75,000 | $53 | 100 |
| 1110 Richmond Rd | 0.20mi | 3/2.0 | 1,376 (-2%) | 11mo | $249,900 | $182 | 78 |
| 160 Evergreen Ct | 0.20mi | 3/2.0 | 1,488 (+6%) | 7mo | $230,000 | $155 | 75 |
| 1007 Campbell Dr | 0.35mi | 4/2.0 (+1) | 1,354 (-4%) | 18mo | $155,000 | $114 | 58 |
| 948 Montclair Ave | 0.35mi | 3/2.0 | 1,285 (-8%) | 15mo | $182,000 | $142 | 57 |
| 933 Montclair Ave | 0.43mi | 3/1.5 | 1,311 (-7%) | 13mo | $130,000 | $99 | 56 |
| 804 Aspen Ln | 0.50mi | 3/2.0 | 1,225 (-13%) | 17mo | $195,000 | $159 | 41 |
Match score weights: distance 35% · size 25% · config 20% · recency 20%. Top-matched comps best support the ARV.
Projected returns pro-forma
3.0% appreciation · 3.0% rent growth · sell at horizon
- IRR
- 23.8%
- Equity multiple
- 2.35×
- Total profit
- $33,948
- Equity at exit
- $40,423
- IRR
- 24.6%
- Equity multiple
- 4.51×
- Total profit
- $88,413
- Equity at exit
- $62,297
Cash invested: $25,172 (down + closing). Projections, not guarantees.
Landlord ↔ Tenant lean methodology
- Overall (STATE)
- 85 Strongly Landlord-Friendly
- State North Carolina
- 85 Strongly Landlord-Friendly · R+3
- County
- — inherits STATE
- City
- — inherits STATE
ZIP-level market 28380
- Active inventory
- 1
- Price-to-rent
- 6.4×
Monthly cashflow live
- Estimated rent
- $1,170 medium interval (Pro) →
- Mortgage (P&I)
- −$471
- Tax from tax record
- −$52 /mo · $628/yr
- Insurance
- −$37
- HOA
- −$0
- Vacancy / Maint / Mgmt
- −$246
- Net cashflow
- $363
Break-even live
Sensitivity live
| Price | -10% $414 | -5% $389 | +0% $363 | +5% $338 | +10% $312 |
|---|---|---|---|---|---|
| Rent | -10% $271 | -5% $317 | +0% $363 | +5% $410 | +10% $456 |
| Rate | -1.0pp $409 | -0.5pp $386 | base $363 | +0.5pp $340 | +1.0pp $316 |
UW: 25.0% down · 7.5% · 30yr · 1.5% tax · 5.0% vac · 8.0% maint · 8.0% mgmt
Financing live
Cash to close
- Down payment
- $22,475
- Closing costs
- $2,697
- Reserves months
- —
- Total cash needed
- —
Loan-product check · same deal, 3 products live
Conventional
25% down · 7.5% · 30yr
- Down + closing
- —
- Monthly P&I
- —
- Monthly cashflow
- —
- DSCR
- —
- Eligible?
- —
Personal DTI + credit; lowest rate.
DSCR
20% down · 8.5% · 30yr
- Down + closing
- —
- Monthly P&I
- —
- Monthly cashflow
- —
- DSCR
- —
- Eligible?
- —
No personal income docs; deal must DSCR.
Hard money
10% down · 12.0% · 12mo
- Down + closing
- —
- Monthly P&I
- —
- Monthly cashflow
- —
- DSCR
- —
- Eligible?
- —
Short-term bridge; refi at stabilization.
Listing history 2 events
-
2026-04-25status Pending
-
2026-04-23$89,900 Active
ⓘ Source: listings_history table (triggers on properties + properties_extension) + one-shot
backfill from property_details.listing_events for pre-trigger history.
Tax reassessment forecast NC · Resets to sale price
- Current annual tax
- $628 · $52/mo
- Projected year-2 tax
- $737 · $61/mo
- Expected delta
- +$109/yr (+$9/mo · 17.4%)
ⓘ Screening estimate from a state-policy table — verify with the county assessor before closing.
Climate risk First Street
- Flood 1/10 Low FEMA zone X (unshaded) · 0% chance over 30 yrs
- Wildfire 5/10 Major
- Heat 8/10 Severe 7 d/yr ≥109°F today · 16 d/yr by 30 yrs out
- Wind 6/10 Major 61% chance of damaging wind over 30 yrs
- Air quality 1/10 Low 0 unhealthy d/yr today · 0 by 30 yrs out
Nearby sold comps map
Loading sold comps map…
Walkable amenities ~0.75 mi
Loading nearby amenities…
Taxation est. · year 1
- Rental income
- $14,043
- − Mortgage interest
- −$5,036
- − Property taxes
- −$628
- − Insurance
- −$450
- − Repairs & maintenance
- −$1,123
- − Management
- −$1,123
- − Depreciation
- −$2,615
- Taxable income
- $3,068
- Est. tax owed @ 24.0%
- −$736
- After-tax cash flow
- $3,623/yr
For passive investors: Depreciation is non-cash, so a rental often shows a tax loss while cash-flowing — sheltering income. Rental losses are passive: they offset passive income freely, and up to $25,000/yr can offset ordinary (W-2) income if you actively participate and your MAGI is under $100k (phasing out to $0 by $150k); unused losses carry forward. On sale, claimed depreciation is recaptured at up to 25%, and gains may owe capital-gains tax (a 1031 exchange can defer both). Figures are a year-1 estimate at your 24.0% rate — not tax advice; consult a CPA.
Schools (NCES district)
- District
- Richmond County Schools
- NCES district ID
- 3703870
- Math proficiency
- 30% ▼ -12.00%
- Reading proficiency
- 36% ▼ -3.00%
- Median HH income
- $32,224
- Composite
- 26.97/100
- National rank
- #7076
- State rank
- #139 of 178 in NC
Livability — Rockingham
- Score
- 63/100
- State rank
- #403
- US rank
- #15356
Category grades
Schools grade is shown separately in the Schools card above.
Census & demographics
- Census place
- Rockingham, NC
Population outlook (Richmond County) Hauer SSP2
- Today (2025)
- 42,892 people
- By 2030
- 41,257 · -3.8%
- By 2040
- 37,629 · -12.3%
- By 2050
- 33,655 · -21.5%
- By 2075
- 23,992 · -44.1%
- By 2100
- 14,782 · -65.5%
Not yet ingested
- Political lean
- —
- Race & ethnicity
- —
- Common origin
- —
- Civics
- —
Market trends
- HPI YoY
- —
- Current HPI
- —
- Rent YoY
- —
- Metro
- —
- State GDP YoY
- ▲ 3.28%
- F500 in state
- 26
Industry mix (Fortune 500 HQ in NC)
| Industry | F500 HQs | Revenue |
|---|---|---|
| Financial Services | 2 | $213B |
|
||
| Retail | 2 | $95B |
|
||
| Industrial Conglomerate | 1 | $38B |
|
||
| Metals / Steel | 1 | $35B |
|
||
| Utilities | 1 | $30B |
|
||
| Industrial Machinery | 1 | $19B |
|
||
Price history
2 events — show timeline
- 2026-04-25 Pending — CANOPYMLS as Distributed by MLS Grid
- 2026-04-23 Listed $89,900 CANOPYMLS as Distributed by MLS Grid
Property tax history
-0.1%/yrLatest (2025): $628 · -2.1% YoY. Source: county tax records.
Cash-flow waterfall
monthlySold comps — $/sqft
last 12 mo · ≤1 miLoading sold comps…