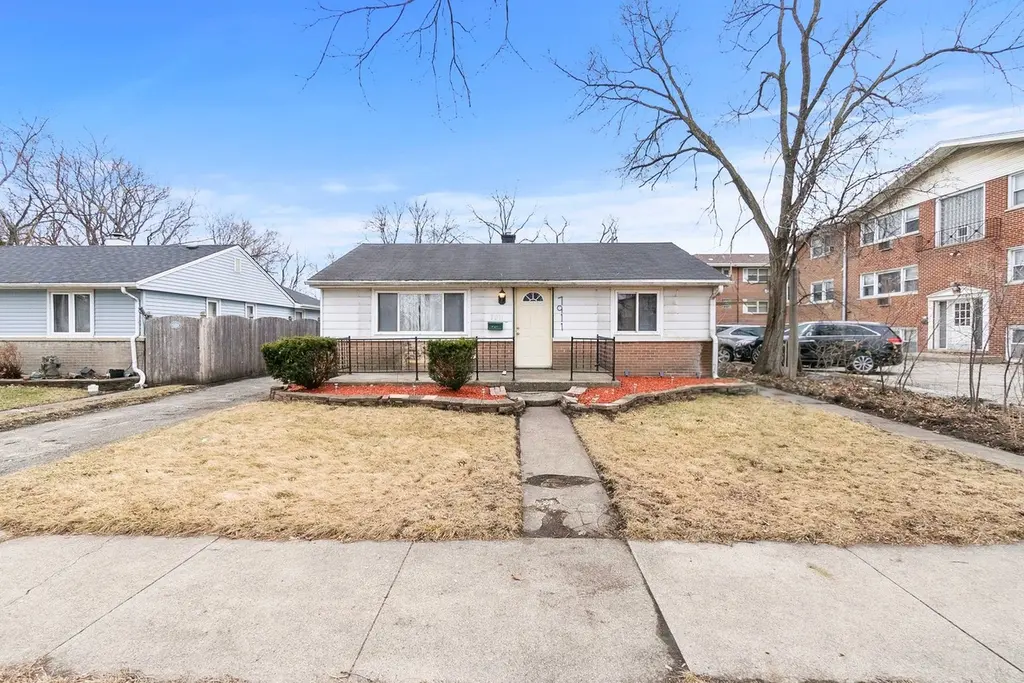
7911 45th St · Lyons, IL
Flood risk 1/10 · Minimal
- FEMA flood zone
- X (unshaded)
- Chance of flooding over 30 yrs
- 0.0%
- Est. flood insurance / yr
- $473 – $860
Fire risk 1/10 · Minimal
- Est. fire insurance / yr
- $804 – $1,492
Heat risk 3/10 · Minor
- Hot days now (above 101°F)
- 7 days/yr
- Hot days in 30 yrs
- 15 days/yr
Wind risk 2/10 · Minimal
- Chance of severe wind over 30 yrs
- 1.0%
Air-quality risk 4/10 · Minor
- Unhealthy air days now
- 3 days/yr
- Unhealthy air days in 30 yrs
- 5 days/yr
Risk factors via First Street. Map © Google.
Why this score? — see what drove the C grade
The composite is a weighted blend of 9 inputs, each scored 0–100. Each bar is that input's sub-score; the figure is the points it added to the 100-point composite (weight × sub-score).
- Cash flow +19.3/30.0
- ARV discount +15.0/15.0
- DSCR +6.1/10.0
- 1% rule +5.9/10.0
- Livability +4.0/5.0
- Rent growth +2.5/5.0
- Condition / age +2.5/5.0
- Schools +1.1/10.0
- Appreciation +0.0/10.0
$174,600
🖨 Deal sheet 📄 Offer letter ✓ Due diligence
Listing remarks
CALLING ALL REHABBERS AND INVESTORS!! THIS GEN IS READY FOR YOUR FINISHING TOUCHES. THIS 3 BEDROOM / 1 BATH HOME WITH A LOT OF APPTOX 9,071 SQ FT. AND AN ATTACHED GARAGE THIS GEM IS A MUST SEE!! THIS HOME IS NEAR SCHOOLS AND NEAR PUBLIC TRANSPORTATION, I55 AND 290. BRING YOUR VISION TO REALITY. SOLD AS IS.
Key facts
- 9,261 sq ft lot
- Garage
- Built 1950
Property features AI
Finance
- Other: Parcel number available; Directions: At 45th and old route 66
- HOA & community: No master association fee required
Exterior
- Parking: Attached garage with asphalt driveway; 1 garage space (1 total parking space)
- Utilities: Public water; Public sewer
- Home design: Detached single-family home; One-story layout; Fee simple ownership
- Construction: Brick construction; Asphalt roof; Concrete perimeter foundation; Built approximately 71–80 years ago; Built before 1978
- Exterior features: Lot dimensions approximately 49 x 189; Lot less than 0.25 acre; School bus service and commuter bus access
Interior
- Kitchen: Kitchen (main level) — 15 x 9
- Bedrooms: Master bedroom (main level) — 10 x 11; Bedroom 2 (main level) — 10 x 10; Bedroom 3 (main level) — 10 x 8
- Bathrooms: 1 full bathroom
- Heating & cooling: Natural gas heating; Central air conditioning
- Interior features: 7 total rooms; Dining room combined with living room
- Laundry & utility: Laundry room (main level) — 8 x 6
Neighborhood map
What this means for you Summary
Snapshot
- This is a 3-bed/1.0-bath single-family listed at $175k.
Deal economics
- At list price, monthly cash flow is $193 ($2k/yr) — positive.
- The deal already cash-flows at list — no discount required.
- Meets the 1% rule at list price ($2k rent vs $175k).
- Recommended offer: $164k (6.0% below list) — sets the bar for market timing.
- Cap rate 7.6% vs local median 4.2% in Lyons — top-decile yield for the area; either an underpriced asset or a hidden risk that comps aren't pricing in. Stress-test before assuming the spread holds.
Location & tenants
- Location reads 79/100 on livability (#126 in IL, #2,222 nationally) — a middle-class / working-renter tenant base. Strengths: commute A+, cost of living A+, housing A+; Watch: schools F.
- J S Morton Hsd 201 (suburban): math 9% / reading 14% proficiency, ranked #557 of 620 in IL (top 90%) — low school quality limits family demand, transient renter base, plan for 1-2y turnover.
- Market conditions: 36 active listings in the ZIP; 12 comparable units currently listed for rent nearby; rentals at typical pace (median 21d on market — plan ~3-4 weeks tenant-placement turnaround); 6,272 units permitted in Cook County in 2024 (4,658 in 5+ unit buildings).
Forward outlook
- Local home prices are declining (-3.0%/yr); year-one equity from $1k of loan paydown is wiped out by about $5k of value loss. Plan a longer hold.
Negotiation context
- It's been on market 88 days — a 6% lower offer ($164k) is reasonable based on typical stale-listing flexibility.
- 8 sale attempts with the ask held roughly flat each time — persistent listings suggest the price (not the market) is what's stuck; bring a comps-based counter.
- Current owner paid $130k; 34% above their basis — modest negotiation headroom, anchor on the comps not their cost.
Risks & watch-outs
- Watch-outs: built in 1950 — expect roof / HVAC / electrical / plumbing capex.
Questions for the listing agent
- It's been on market 88 days. Have you received any prior offers? Is the seller open to a 6% concession, seller financing, or rate buy-down credit?
- Built in 1950 — when were the roof, HVAC, electrical panel, plumbing, and water heater last replaced?
- Why hasn't it sold? Are there any deal-killer items the seller is aware of (foundation, flood, title, zoning, code violations)?
- Is there a deadline driving the sale (1031 exchange, divorce, estate, relocation)? That informs how much negotiation room exists.
- Schools are F-rated, which usually means shorter tenancies and higher turnover. Who's the typical renter profile here, and what's been the actual vacancy rate?
- What's the average days-on-market for RENTAL listings here right now (not sales)? A rising rental-DOM trend means longer vacancies and softer asking-rent achievability than the comps imply.
- What's the recent tenant-quality profile in this submarket — average credit score on applications, eviction rate, late-payment / NSF rate, and stable-employment percentage? A property-management company in the area should have these aggregated.
- How much new for-sale + rental construction is in the pipeline within 1–3 miles? Heavy new supply typically softens prices + rents 12–24 months out; constrained supply supports both.
Investment metrics
- 1% rule
- 1.09% ✓
- Cap rate
- 7.62%
- Cash-on-cash
- 4.73%
- DSCR
- 1.21
- GRM
- 7.6
CMA / ARV
- ARV (on-the-fly)
- $287,254
- Comps found
- 12
Show comp detail 12 sales within ~0.75 mi
| Address | Dist | Beds/Ba | Sqft | Sold | Price | $/sf | Match |
|---|---|---|---|---|---|---|---|
| 4343 Amelia Ave | 0.17mi | 3/1.0 | 1,272 (+7%) | 6mo | $265,000 | $208 | 75 |
| 7857 45th Pl | 0.09mi | 2/1.0 (-1) | 1,269 (+7%) | 5mo | $185,000 | $146 | 75 |
| 8110 46th St | 0.28mi | 3/1.0 | 1,202 (+1%) | 12mo | $360,000 | $300 | 74 |
| 4346 Amelia Ave | 0.15mi | 3/2.0 | 1,103 (-7%) | 10mo | $330,000 | $299 | 69 |
| 4205 S Center Ave | 0.40mi | 3/2.0 | 1,244 (+5%) | 4mo | $325,000 | $261 | 66 |
| 4617 Joliet Ave | 0.16mi | 4/2.0 (+1) | 1,302 (+10%) | 2mo | $315,000 | $242 | 65 |
| 4236 Fishermans Ter | 0.46mi | 3/1.0 | 1,116 (-6%) | 12mo | $327,000 | $293 | 59 |
| 8033 45th Ct | 0.19mi | 2/1.0 (-1) | 1,325 (+12%) | 12mo | $265,000 | $200 | 56 |
| 7825 41st Pl | 0.49mi | 3/1.0 | 1,050 (-12%) | 4mo | $152,250 | $145 | 54 |
| 4147 Gage Ave | 0.44mi | 4/2.0 (+1) | 1,296 (+9%) | 6mo | $325,000 | $251 | 50 |
| 8034 W 42nd St | 0.41mi | 4/2.0 (+1) | 1,056 (-11%) | 6mo | $175,000 | $166 | 49 |
| 8330 45th St | 0.55mi | 3/2.0 | 1,361 (+15%) | 5mo | $300,000 | $220 | 42 |
Match score weights: distance 35% · size 25% · config 20% · recency 20%. Top-matched comps best support the ARV.
Projected returns pro-forma
-3.0% appreciation · 3.0% rent growth · sell at horizon
- IRR
- -8.9%
- Equity multiple
- 0.67×
- Total profit
- $-15,913
- Equity at exit
- $26,033
- IRR
- 0.7%
- Equity multiple
- 1.05×
- Total profit
- $2,353
- Equity at exit
- $15,096
Cash invested: $48,888 (down + closing). Projections, not guarantees.
Landlord ↔ Tenant lean methodology
- Overall (STATE)
- 43 Moderately Tenant-Leaning
- State Illinois
- 43 Moderately Tenant-Leaning · D+7
- County
- — inherits STATE
- City
- — inherits STATE
ZIP-level market 60534
- Home prices YoY
- -26.6%
- Active inventory
- 36
- Price-to-rent
- 7.6×
Monthly cashflow live
- Estimated rent
- $1,911 high interval (Pro) →
- Mortgage (P&I)
- −$916
- Tax from tax record
- −$328 /mo · $3,941/yr
- Insurance
- −$73
- HOA
- −$0
- Vacancy / Maint / Mgmt
- −$401
- Net cashflow
- $193
Break-even live
UW: 25.0% down · 7.5% · 30yr · 1.5% tax · 5.0% vac · 8.0% maint · 8.0% mgmt
Financing live
Cash to close
- Down payment
- $43,650
- Closing costs
- $5,238
- Reserves months
- —
- Total cash needed
- —
Loan-product check · same deal, 3 products live
Conventional
25% down · 7.5% · 30yr
- Down + closing
- —
- Monthly P&I
- —
- Monthly cashflow
- —
- DSCR
- —
- Eligible?
- —
Personal DTI + credit; lowest rate.
DSCR
20% down · 8.5% · 30yr
- Down + closing
- —
- Monthly P&I
- —
- Monthly cashflow
- —
- DSCR
- —
- Eligible?
- —
No personal income docs; deal must DSCR.
Hard money
10% down · 12.0% · 12mo
- Down + closing
- —
- Monthly P&I
- —
- Monthly cashflow
- —
- DSCR
- —
- Eligible?
- —
Short-term bridge; refi at stabilization.
Rent comps 12 comps
| Address | Beds | Baths | Sqft | Rent | $/sqft | DOM | Units | Dist |
|---|---|---|---|---|---|---|---|---|
| 4337 Prescott Ave Apt 1B Lyons, IL | 2.0 | 1.0 | 850 | $1,650 | $1.94 | 20d | 1 | 0.21mi |
| 4337 Prescott Ave Unit 2C Lyons, IL | 2.0 | 1.0 | 850 | $1,595 | $1.88 | 20d | 1 | 0.21mi |
| 4235 Harlem Ave Unit 5 Berwyn, IL | 2.0 | 1.0 | 780 | $1,425 | $1.83 | 3d | 1 | 0.95mi |
| 4227 S Harlem Ave Unit 1 Berwyn, IL | 2.0 | 1.0 | 1000 | $1,650 | $1.65 | 1d | 1 | 0.96mi |
| 4205 S Harlem Ave Berwyn, IL | 3.0 | 2.0 | 1440 | $1,900 | $1.32 | 24d | 1 | 0.98mi |
| 7335 Oakwood Ave Unit 2F Lyons, IL | 2.0 | 2.0 | 800 | $1,850 | $2.31 | 14d | 1 | 0.99mi |
| 5205 S 73rd Ct Unit 1 Summit, IL | 2.0 | 1.0 | 800 | $1,550 | $1.94 | 24d | 1 | 1.12mi |
| 7535 W Hanover St #1 Summit Argo, IL | 3.0 | 1.0 | 1100 | $1,900 | $1.73 | 24d | 1 | 1.15mi |
| 7228 38th Pl Apt 2S Lyons, IL | 2.0 | 1.0 | 900 | $1,595 | $1.77 | 20d | 1 | 1.20mi |
| 4605 Prairie Ave Brookfield, IL | 3.0 | 2.0 | 1100 | $3,200 | $2.91 | 10d | 1 | 1.26mi |
| 112 E Quincy St Riverside, IL | 3.0 | 2.0 | 1400 | $2,950 | $2.11 | 20d | 1 | 1.35mi |
| 4000 Forest Ave Unit 6 Brookfield, IL | 3.0 | 2.0 | 1150 | $4,000 | $3.48 | 10d | 1 | 1.40mi |
Listing history 32 events
-
2026-06-18days on market $174,600 Active 88 DOM
-
2026-06-17days on market $174,600 Active 87 DOM
-
2026-06-16days on market $174,600 Active 86 DOM
-
2026-06-15days on market $174,600 Active 85 DOM
-
2026-06-13days on market $174,600 Active 83 DOM
-
2026-06-09days on market $174,600 Active 79 DOM
-
2026-06-08days on market $174,600 Active 78 DOM
-
2026-06-07days on market $174,600 Active 77 DOM
-
2026-06-04days on market $174,600 Active 74 DOM
-
2026-06-03days on market $174,600 Active 73 DOM
-
2026-06-02days on market $174,600 Active 72 DOM
-
2026-06-01days on market $174,600 Active 71 DOM
-
2026-05-31days on market $174,600 Active 70 DOM
-
2026-04-21status Active
-
2026-03-24historical Contingent - Continue to Show
-
2026-03-22$174,600 Active
-
2026-03-20historical
-
2026-02-22price
-
2026-02-13Active
-
2026-02-13historical
-
2025-12-29price
-
2025-12-08Active
-
2025-06-20historical
-
2025-05-29price
-
2025-05-29status Active
-
2025-04-30historical Contingent - Continue to Show
-
2025-04-14status Active
-
2025-04-11historical Contingent - Continue to Show
-
2025-03-27status Active
-
2025-03-27historical
-
2025-03-21Active
-
2001-06-07soldstatus $130,000
ⓘ Source: listings_history table (triggers on properties + properties_extension) + one-shot
backfill from property_details.listing_events for pre-trigger history.
Tax reassessment forecast IL · Partial reset (capped growth)
- Current annual tax
- $3,941 · $328/mo
- Projected year-2 tax
- $3,952 · $329/mo
- Expected delta
- +$11/yr (+$1/mo · 0.3%)
ⓘ Screening estimate from a state-policy table — verify with the county assessor before closing.
Climate risk First Street
- Flood 1/10 Low FEMA zone X (unshaded) · 0% chance over 30 yrs
- Wildfire 1/10 Low
- Heat 3/10 Moderate 7 d/yr ≥101°F today · 15 d/yr by 30 yrs out
- Wind 2/10 Low 100% chance of damaging wind over 30 yrs
- Air quality 4/10 Moderate 3 unhealthy d/yr today · 5 by 30 yrs out
Nearby sold comps map
Loading sold comps map…
Walkable amenities ~0.75 mi
Loading nearby amenities…
Taxation est. · year 1
- Rental income
- $22,932
- − Mortgage interest
- −$9,780
- − Property taxes
- −$3,941
- − Insurance
- −$873
- − Repairs & maintenance
- −$1,835
- − Management
- −$1,835
- − Depreciation
- −$5,079
- Taxable loss
- −$411
- Est. tax savings @ 24.0%
- +$99
- After-tax cash flow
- $2,413/yr
For passive investors: Depreciation is non-cash, so a rental often shows a tax loss while cash-flowing — sheltering income. Rental losses are passive: they offset passive income freely, and up to $25,000/yr can offset ordinary (W-2) income if you actively participate and your MAGI is under $100k (phasing out to $0 by $150k); unused losses carry forward. On sale, claimed depreciation is recaptured at up to 25%, and gains may owe capital-gains tax (a 1031 exchange can defer both). Figures are a year-1 estimate at your 24.0% rate — not tax advice; consult a CPA.
Schools (NCES district)
- District
- J S Morton Hsd 201
- NCES district ID
- 1726880
- Math proficiency
- 9% ▲ 1.00%
- Reading proficiency
- 14% ▼ -1.00%
- Median HH income
- $48,698
- Composite
- 10.73/100
- National rank
- #9768
- State rank
- #557 of 620 in IL
Livability — Lyons
- Score
- 79/100
- State rank
- #126
- US rank
- #2222
Category grades
Schools grade is shown separately in the Schools card above.
Census & demographics
- Census place
- Lyons, IL
- City population
- 10,362
- Population (ZIP)
- 10,362
Population outlook (Cook County) Hauer SSP2
- Today (2025)
- 5,347,519 people
- By 2030
- 5,357,703 · +0.2%
- By 2040
- 5,324,924 · -0.4%
- By 2050
- 5,230,762 · -2.2%
- By 2075
- 4,785,735 · -10.5%
- By 2100
- 4,188,836 · -21.7%
Race, ethnicity, and origin ACS 2023
- Neighborhood character
- Diverse neighborhood (Simpson 0.55)
- Race & ethnicity
- Hispanic / Latino 49% White 46% Two or more races 8% Black 3% Asian 2%
- Hispanic origin (detail)
- Mexican 38% Puerto Rican 6%
- Common ancestry
- Romanian 17% Italian 1% Lithuanian 1%
- Foreign-born
- 24% · Canada, Vietnam, Jamaica
- Languages at home
- 54% English-only · Spanish 36% Russian/Polish/Slavic 6% Other Indo-European 3%
Political lean MEDSL · Cook
- 2024 margin
- Solid D (+42.0) · D 70.4% · R 28.4% · Other 1.2%
- 2008→2024 swing
- -11.4pp toward R · 2008: 53.4pp · 2024: 42.0pp
- All cycles
- 2024: D+42.0 2020: D+50.3 2016: D+53.0 2012: D+49.4 2008: D+53.4
Not yet ingested
- Civics
- —
Market trends
- HPI YoY
- ▼ -88.39%
- Current HPI
- 243.8425
- Rent YoY
- —
- Metro
- —
- State GDP YoY
- ▲ 1.59%
- F500 in state
- 60
Industry mix (Fortune 500 HQ in IL)
| Industry | F500 HQs | Revenue |
|---|---|---|
| Insurance | 4 | $201B |
|
||
| Consumer Goods | 4 | $87B |
|
||
| Industrial Machinery | 3 | $64B |
|
||
| Healthcare | 2 | $55B |
|
||
| Retail / Pharmacy | 1 | $148B |
|
||
| Agriculture / Food | 1 | $86B |
|
||
Price history
+34.3% since first listed19 events — show timeline
- 2026-04-21 Relisted — MRED as Distributed by MLS Grid
- 2026-03-24 Contingent — MRED as Distributed by MLS Grid
- 2026-03-22 Listed $174,600 MRED as Distributed by MLS Grid
- 2026-03-20 Listing Removed — MRED as Distributed by MLS Grid
- 2026-02-22 Price Changed — MRED as Distributed by MLS Grid
- 2026-02-13 Listing Removed — MRED as Distributed by MLS Grid
- 2026-02-13 Listed — MRED as Distributed by MLS Grid
- 2025-12-29 Price Changed — MRED as Distributed by MLS Grid
- 2025-12-08 Listed — MRED as Distributed by MLS Grid
- 2025-06-20 Listing Removed — MRED as Distributed by MLS Grid
- 2025-05-29 Price Changed — MRED as Distributed by MLS Grid
- 2025-05-29 Relisted — MRED as Distributed by MLS Grid
- 2025-04-30 Contingent — MRED as Distributed by MLS Grid
- 2025-04-14 Relisted — MRED as Distributed by MLS Grid
- 2025-04-11 Contingent — MRED as Distributed by MLS Grid
- 2025-03-27 Relisted — MRED as Distributed by MLS Grid
- 2025-03-27 Listing Removed — MRED as Distributed by MLS Grid
- 2025-03-21 Listed — MRED as Distributed by MLS Grid
- 2001-06-07 Sold (Public Records) $130,000 Public Records
Property tax history
+7.9%/yrLatest (2023): $3,941 · +22.7% YoY. Source: county tax records.
Cash-flow waterfall
monthlySold comps — $/sqft
last 12 mo · ≤1 miLoading sold comps…