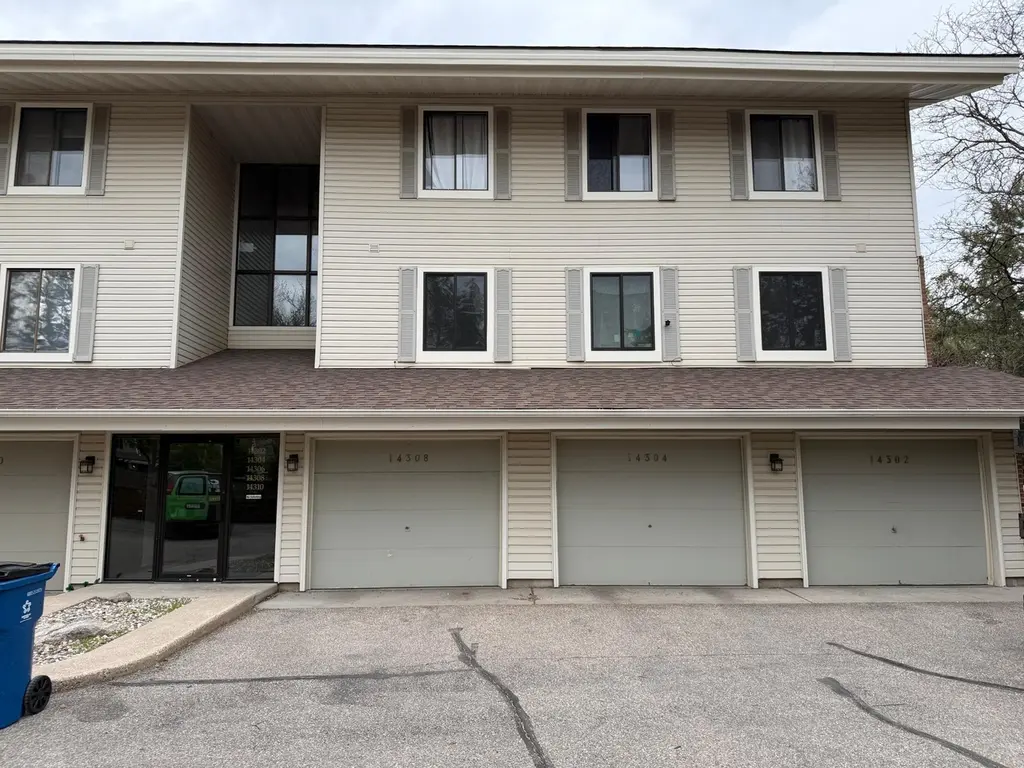
14302 Fairway Dr · Eden Prairie, MN
Flood risk 1/10 · Minimal
- FEMA flood zone
- X (unshaded)
- Chance of flooding over 30 yrs
- 0.0%
- Est. flood insurance / yr
- $507 – $1,088
Fire risk 1/10 · Minimal
- Est. fire insurance / yr
- $888 – $1,650
Heat risk 2/10 · Minimal
- Hot days now (above 99°F)
- 7 days/yr
- Hot days in 30 yrs
- 14 days/yr
Wind risk 2/10 · Minimal
- Chance of severe wind over 30 yrs
- —
Air-quality risk 2/10 · Minimal
- Unhealthy air days now
- 1 days/yr
- Unhealthy air days in 30 yrs
- 2 days/yr
Risk factors via First Street. Map © Google.
Why this score? — see what drove the D grade
The composite is a weighted blend of 9 inputs, each scored 0–100. Each bar is that input's sub-score; the figure is the points it added to the 100-point composite (weight × sub-score).
- ARV discount +15.0/15.0
- Cash flow +6.2/30.0
- Schools +6.0/10.0
- Livability +4.2/5.0
- 1% rule +4.0/10.0
- Rent growth +3.2/5.0
- Condition / age +2.5/5.0
- DSCR +0.5/10.0
- Appreciation +0.0/10.0
$234,900
🖨 Deal sheet 📄 Offer letter ✓ Due diligence
Key facts
- $551 HOA
- Garage
- Built 1973
Neighborhood map
What this means for you Summary
Snapshot
- This is a 3-bed/2.0-bath condo listed at $235k.
Deal economics
- At list price, monthly cash flow is $-426 ($-5k/yr) — negative.
- To cash-flow at today's rent, offer at most $160k (32.0% below list).
- To meet the 1% rule (rent ≥ 1% of price), the offer needs to be $210k (10.5% below list).
- Recommended offer: $160k (32.0% below list) — sets the bar for cash-flow.
- Cap rate 4.1% vs local median 2.6% in Eden Prairie — top-decile yield for the area; either an underpriced asset or a hidden risk that comps aren't pricing in. Stress-test before assuming the spread holds.
Location & tenants
- Location reads 85/100 on livability (#21 in MN, #575 nationally) — a professional / high-income tenant draw. Strengths: schools A+, crime A+, commute A+; Watch: amenities F, cost of living F.
- Eden Prairie Public School District (urban): math 61% / reading 70% proficiency, ranked #13 of 301 in MN (top 4%) — acceptable for families but not a draw, mixed tenant base, ~2y average lease; only 17% free/reduced lunch — higher-income household profile.
- Market conditions: Rents rising (+2.7%/yr); 63 active listings in the ZIP; 17 comparable units currently listed for rent nearby; rentals leasing fast (median 3d on market — plan ~1-2 weeks tenant-placement turnaround); solid renter incomes; 4,651 units permitted in Hennepin County in 2024 (2,443 in 5+ unit buildings).
Forward outlook
- Local home prices are declining (-3.0%/yr); year-one equity from $2k of loan paydown is wiped out by about $7k of value loss. Plan a longer hold.
- Hennepin County population projected at +30% by 2050 — long-run rental-demand tailwind backs the buy-and-hold thesis.
Negotiation context
- It's been on market 36 days — a 3% lower offer ($228k) is reasonable based on typical stale-listing flexibility.
- Current owner paid $162k; 45% above their basis — modest negotiation headroom, anchor on the comps not their cost.
Risks & watch-outs
- Watch-outs: HOA is 26% of rent.
Questions for the listing agent
- What do current leases actually rent for vs. the listed asking? Can we see a recent rent roll and the last 12 months of T-12 income?
- It's been on market 36 days. Have you received any prior offers? Is the seller open to a 32% concession, seller financing, or rate buy-down credit?
- Built in 1973 — when were the roof, HVAC, electrical panel, plumbing, and water heater last replaced?
- What does the HOA fee cover, when was the last increase, and are there any pending special assessments or reserve-fund shortfalls?
- Any open or pending special assessments — roof, HVAC, plumbing, elevator, façade? What's the per-unit balance and payoff schedule, and is the seller paying it off at close or rolling it to the buyer?
- Is there a deadline driving the sale (1031 exchange, divorce, estate, relocation)? That informs how much negotiation room exists.
- Schools are A-rated — typically a magnet for longer-tenancy family renters. What's the average tenant stay here, and is there a school-zone premium baked into asking?
- The area grade is low — what's the realistic commute time and amenity access for the typical tenant pool here? Any planned neighborhood developments (good or bad) we should know about?
- What's the average days-on-market for RENTAL listings here right now (not sales)? A rising rental-DOM trend means longer vacancies and softer asking-rent achievability than the comps imply.
- What's the recent tenant-quality profile in this submarket — average credit score on applications, eviction rate, late-payment / NSF rate, and stable-employment percentage? A property-management company in the area should have these aggregated.
- How much new apartment / multifamily construction is in the pipeline within 1–3 miles? Heavy new supply (>2% of stock underway) typically softens rents 12–24 months out; light construction supports rent growth.
Investment metrics
- 1% rule
- 0.90% ✗
- Cap rate
- 4.12%
- Cash-on-cash
- -7.77%
- DSCR
- 0.65
- GRM
- 9.3
CMA / ARV
- ARV (median comp)
- $326,405
- List price
- $234,900
- Delta
- -28.03%
- Verdict
- UNDERPRICED
- Comps
- 3 within 1.0 mi
Projected returns pro-forma
-3.0% appreciation · 2.69% rent growth · sell at horizon
- IRR
- -30.2%
- Equity multiple
- 0.00×
- Total profit
- $-65,542
- Equity at exit
- $35,024
- IRR
- -32.9%
- Equity multiple
- -0.42×
- Total profit
- $-93,399
- Equity at exit
- $20,310
Cash invested: $65,772 (down + closing). Projections, not guarantees.
Landlord ↔ Tenant lean methodology
- Overall (STATE)
- 46 Balanced
- State Minnesota
- 46 Balanced · D+2
- County
- — inherits STATE
- City
- — inherits STATE
ZIP-level market 55344
- Rents YoY
- 2.7%
- Active inventory
- 63
- Price-to-rent
- 9.3×
Monthly cashflow live
- Estimated rent
- $2,103 high interval (Pro) →
- Mortgage (P&I)
- −$1,232
- Tax from tax record
- −$207 /mo · $2,484/yr
- Insurance
- −$98
- HOA
- −$551
- Vacancy / Maint / Mgmt
- −$442
- Net cashflow
- $-426
Break-even live
UW: 25.0% down · 7.5% · 30yr · 1.5% tax · 5.0% vac · 8.0% maint · 8.0% mgmt
Financing live
Cash to close
- Down payment
- $58,725
- Closing costs
- $7,047
- Reserves months
- —
- Total cash needed
- —
Loan-product check · same deal, 3 products live
Conventional
25% down · 7.5% · 30yr
- Down + closing
- —
- Monthly P&I
- —
- Monthly cashflow
- —
- DSCR
- —
- Eligible?
- —
Personal DTI + credit; lowest rate.
DSCR
20% down · 8.5% · 30yr
- Down + closing
- —
- Monthly P&I
- —
- Monthly cashflow
- —
- DSCR
- —
- Eligible?
- —
No personal income docs; deal must DSCR.
Hard money
10% down · 12.0% · 12mo
- Down + closing
- —
- Monthly P&I
- —
- Monthly cashflow
- —
- DSCR
- —
- Eligible?
- —
Short-term bridge; refi at stabilization.
Rent comps 17 comps
| Address | Beds | Baths | Sqft | Rent | $/sqft | DOM | Units | Dist |
|---|---|---|---|---|---|---|---|---|
| 14315 Fairway Dr Unit 14315 Eden Prairie, MN | 2.0 | 2.0 | 1256 | $1,750 | $1.39 | 44d | 1 | 0.05mi |
| 14247 Valley View Rd Eden Prairie, MN | 1.0–3.0 | 1.0–2.0 | 1003 | $2,075 | $2.07 | 2d | 11 | 0.16mi |
| 14301 Martin Dr Eden Prairie, MN | 2.0 | 1.0–2.0 | 829 | $2,210 | $2.66 | 3d | 14 | 0.22mi |
| 13517 Zenith Ln Unit 13517 Eden Prairie, MN | 2.0 | 1.5 | 935 | $2,000 | $2.14 | 44d | 1 | 0.46mi |
| 13517 Zenith Ln Eden Prairie, MN | 2.0 | 1.5 | 934 | $2,050 | $2.19 | 44d | 1 | 0.47mi |
| 13570 Technology Dr #2202 Eden Prairie, MN | 2.0 | 2.0 | 1243 | $1,850 | $1.49 | 13d | 1 | 0.73mi |
| 15598 Garfield Cir Eden Prairie, MN | 4.0 | 2.0 | 1600 | $2,995 | $1.87 | 18d | 1 | 0.81mi |
| 12900 Technology Dr Eden Prairie, MN | 2.0 | 1.0–2.0 | 1143 | $3,510 | $3.07 | 2d | 8 | 0.98mi |
| 14030 Chestnut Dr Eden Prairie, MN | 3.0 | 1.0–2.0 | 990 | $2,140 | $2.16 | 3d | 21 | 1.01mi |
| 13905 Chestnut Dr Eden Prairie, MN | 1.0–3.0 | 1.0–2.0 | 1035 | $2,330 | $2.25 | 2d | 29 | 1.10mi |
| 14017 Chestnut Dr Eden Prairie, MN | 1.0–2.0 | 1.0 | 886 | $1,499 | $1.69 | 24d | 3 | 1.11mi |
| 16315 Wagner Way Eden Prairie, MN | 1.0–2.0 | 1.0–2.0 | 824 | $1,975 | $2.40 | 3d | 11 | 1.16mi |
| 13588 Carmody Dr Eden Prairie, MN | 2.0 | 1.5 | 1525 | $2,300 | $1.51 | 18d | 1 | 1.29mi |
| 6502 Kingfisher Ln Eden Prairie, MN | 2.0–3.0 | 1.5–2.5 | 1293 | $2,895 | $2.24 | 2d | 5 | 1.36mi |
| 8075 Eden Prairie Rd Eden Prairie, MN | 1.0–2.0 | 1.0–2.0 | 778 | $2,605 | $3.35 | 2d | 27 | 1.37mi |
| 12300 Singletree Ln Eden Prairie, MN | 1.0–2.0 | 1.0–2.0 | 1090 | $2,449 | $2.25 | 3d | 28 | 1.42mi |
| 8300 Commonwealth Dr Eden Prairie, MN | 2.0 | 1.0–2.5 | 1015 | $4,517 | $4.45 | 2d | 7 | 1.50mi |
HOA detail condo
- Monthly dues
- $551 · $6,612/yr
- Assessments
- None detected in remarks — confirm with the listing agent.
Listing history 19 events
-
2026-06-18price $234,900 Active 36 DOM
-
2026-06-18days on market $239,900 Active 36 DOM
-
2026-06-17days on market $239,900 Active 35 DOM
-
2026-06-16days on market $239,900 Active 34 DOM
-
2026-06-15days on market $239,900 Active 33 DOM
-
2026-06-13pricedays on market $239,900 Active 31 DOM
-
2026-06-09days on market $244,900 Active 27 DOM
-
2026-06-08days on market $244,900 Active 26 DOM
-
2026-06-07pricedays on market $244,900 Active 25 DOM
-
2026-06-04days on market $249,900 Active 22 DOM
-
2026-06-03days on market $249,900 Active 21 DOM
-
2026-06-02days on market $249,900 Active 20 DOM
-
2026-06-01days on market $249,900 Active 19 DOM
-
2026-05-31days on market $249,900 Active 18 DOM
-
2026-05-14$269,900 Active
-
2026-05-12historical $269,900
-
2026-04-20soldstatus $162,000
-
1995-04-06soldstatus $89,000
-
1993-02-16soldstatus $71,000
ⓘ Source: listings_history table (triggers on properties + properties_extension) + one-shot
backfill from property_details.listing_events for pre-trigger history.
Tax reassessment forecast MN · Partial reset (capped growth)
- Current annual tax
- $2,484 · $207/mo
- Projected year-2 tax
- $2,558 · $213/mo
- Expected delta
- +$73/yr (+$6/mo · 2.9%)
ⓘ Screening estimate from a state-policy table — verify with the county assessor before closing.
Climate risk First Street
- Flood 1/10 Low FEMA zone X (unshaded) · 0% chance over 30 yrs
- Wildfire 1/10 Low
- Heat 2/10 Low 7 d/yr ≥99°F today · 14 d/yr by 30 yrs out
- Wind 2/10 Low
- Air quality 2/10 Low 1 unhealthy d/yr today · 2 by 30 yrs out
Nearby sold comps map
Loading sold comps map…
Walkable amenities ~0.75 mi
Loading nearby amenities…
Taxation est. · year 1
- Rental income
- $25,240
- − Mortgage interest
- −$13,158
- − Property taxes
- −$2,484
- − Insurance
- −$1,174
- − Repairs & maintenance
- −$2,019
- − Management
- −$2,019
- − HOA
- −$6,612
- − Depreciation
- −$6,833
- Taxable loss
- −$9,061
- Est. tax savings @ 24.0%
- +$2,175
- After-tax cash flow
- $-2,939/yr
For passive investors: Depreciation is non-cash, so a rental often shows a tax loss while cash-flowing — sheltering income. Rental losses are passive: they offset passive income freely, and up to $25,000/yr can offset ordinary (W-2) income if you actively participate and your MAGI is under $100k (phasing out to $0 by $150k); unused losses carry forward. On sale, claimed depreciation is recaptured at up to 25%, and gains may owe capital-gains tax (a 1031 exchange can defer both). Figures are a year-1 estimate at your 24.0% rate — not tax advice; consult a CPA.
Schools (NCES district)
- District
- Eden Prairie Public School District
- NCES district ID
- 2714220
- Math proficiency
- 61% ▼ -8.00%
- Reading proficiency
- 70% ▼ -3.00%
- Median HH income
- $95,212
- Composite
- 59.93/100
- National rank
- #879
- State rank
- #13 of 301 in MN
Livability — Eden Prairie
- Score
- 85/100
- State rank
- #21
- US rank
- #575
Category grades
Schools grade is shown separately in the Schools card above.
Census & demographics
- Census place
- Eden Prairie, MN
- County
- Hennepin County · 1,150,272 people
- City population
- 44,463
- Metro
- Minneapolis-St. Paul-Bloomington, MN-WI
- Population (ZIP)
- 14,034
- Household income
- $89,565
- Rent vs Own
- Severe rent burden
- 909.0
Population outlook (Hennepin County) Hauer SSP2
- Today (2025)
- 1,405,227 people
- By 2030
- 1,492,650 · +6.2%
- By 2040
- 1,660,157 · +18.1%
- By 2050
- 1,823,498 · +29.8%
- By 2075
- 2,221,283 · +58.1%
- By 2100
- 2,509,976 · +78.6%
Race, ethnicity, and origin ACS 2023
- Neighborhood character
- Diverse neighborhood (Simpson 0.64)
- Race & ethnicity
- White 54% Asian 21% Black 13% Hispanic / Latino 7% Two or more races 6%
- Hispanic origin (detail)
- Mexican 3%
- Common ancestry
- Portuguese 9% Romanian 3% Scottish 2%
- Foreign-born
- 24% · Canada, Jamaica, China
- Languages at home
- 68% English-only · Other Indo-European 9% Other Asian/Pacific 7% Spanish 5%
Political lean MEDSL · Hennepin
- 2024 margin
- Solid D (+42.6) · D 70.2% · R 27.5% · Other 2.3%
- 2008→2024 swing
- +14.0pp toward D · 2008: 28.6pp · 2024: 42.6pp
- All cycles
- 2024: D+42.6 2020: D+43.2 2016: D+35.3 2012: D+27.1 2008: D+28.6
Not yet ingested
- Civics
- —
Market trends
- HPI YoY
- ▼ -108.33%
- Current HPI
- 201.1272
- Rent YoY
- ▲ 2.69%
- Metro
- Minneapolis-St. Paul-Bloomington, MN-WI
- State GDP YoY
- ▲ 2.41%
- F500 in state
- 34
Industry mix (Fortune 500 HQ in MN)
| Industry | F500 HQs | Revenue |
|---|---|---|
| Healthcare | 2 | $407B |
|
||
| Retail | 2 | $150B |
|
||
| Consumer Goods | 2 | $32B |
|
||
| Industrial Machinery | 2 | $6B |
|
||
| Agriculture | 1 | $40B |
|
||
| Healthcare / Medical Devices | 1 | $32B |
|
||
Price history
+280.1% since first listed5 events — show timeline
- 2026-05-14 Listed $269,900 NORTHSTARMLS as Distributed by MLS Grid
- 2026-05-12 Coming Soon $269,900 NORTHSTARMLS as Distributed by MLS Grid
- 2026-04-20 Sold (Public Records) $162,000 Public Records
- 1995-04-06 Sold (Public Records) $89,000 Public Records
- 1993-02-16 Sold (Public Records) $71,000 Public Records
Property tax history
+3.8%/yrLatest (2025): $2,484 · +4.3% YoY. Source: county tax records.
Cash-flow waterfall
monthlySold comps — $/sqft
last 12 mo · ≤1 miLoading sold comps…