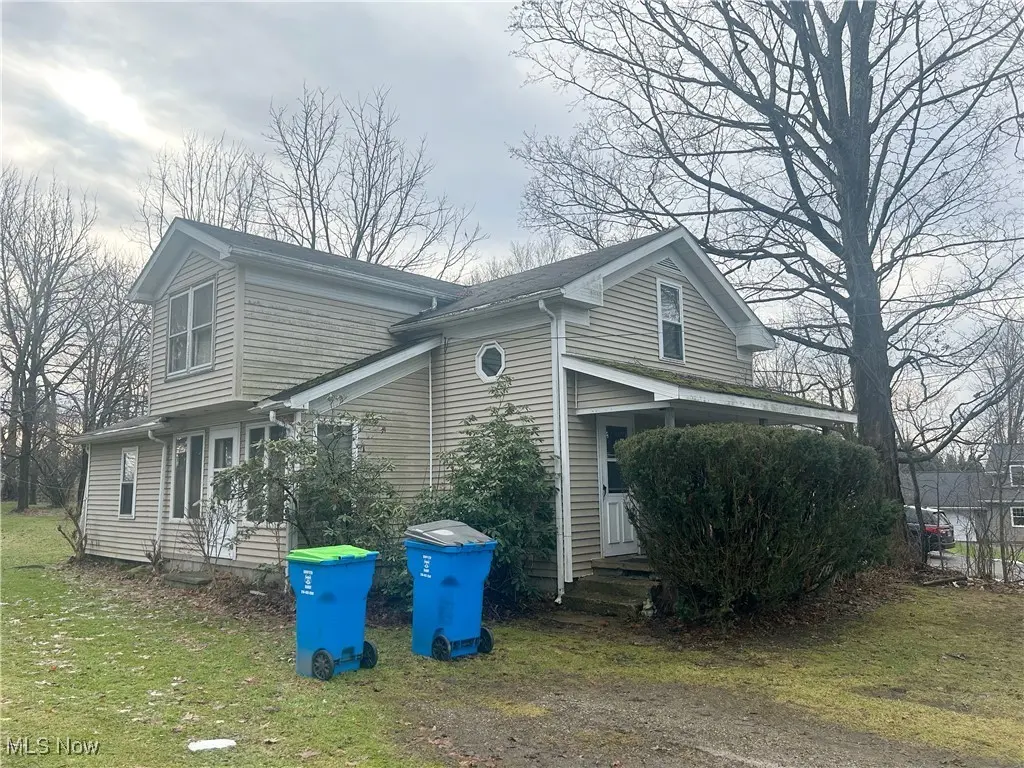
13661 W Spring St · Burton, OH
Flood risk 1/10 · Minimal
- FEMA flood zone
- X (unshaded)
- Chance of flooding over 30 yrs
- 0.0%
- Est. flood insurance / yr
- $473 – $860
Fire risk 1/10 · Minimal
- Est. fire insurance / yr
- $713 – $1,323
Heat risk 2/10 · Minimal
- Hot days now (above 96°F)
- 7 days/yr
- Hot days in 30 yrs
- 16 days/yr
Wind risk 1/10 · Minimal
- Chance of severe wind over 30 yrs
- —
Air-quality risk 3/10 · Minor
- Unhealthy air days now
- 2 days/yr
- Unhealthy air days in 30 yrs
- 4 days/yr
Risk factors via First Street. Map © Google.
Why this score? — see what drove the B+ grade
The composite is a weighted blend of 9 inputs, each scored 0–100. Each bar is that input's sub-score; the figure is the points it added to the 100-point composite (weight × sub-score).
- Cash flow +30.0/30.0
- ARV discount +15.0/15.0
- DSCR +10.0/10.0
- 1% rule +9.3/10.0
- Schools +4.9/10.0
- Livability +3.9/5.0
- Rent growth +2.5/5.0
- Condition / age +2.5/5.0
- Appreciation +0.0/10.0
$160,000
🖨 Deal sheet (PDF) 📄 Offer letter ✓ Due diligence
Listing remarks MLS
Great opportunity in Burton Village! This long-time family-owned century home offers 3 bedrooms and 1 bath in the Berkshire School District, situated on a quiet dead-end street on a spacious half-acre lot. The living room features large windows and a unique dividing wall that opens to the dining room, which provides access to the enclosed porch. The main level also includes a laundry room, one bedroom, the full bath, and a rear storage room. With some TLC, this home has the potential to shine as a charming personal residence or a nice rental investment. A one-year home warranty is included with the purchase.
Key facts
- Enclosed porch
- Unique dividing wall
- Rear storage room
Tags
Neighborhood map
What this means for you Summary
Snapshot
- This is a 3-bed/1.0-bath single-family listed at $160k.
Deal economics
- At list price, monthly cash flow is $804 ($10k/yr) — positive.
- The deal already cash-flows at list — no discount required.
- Meets the 1% rule at list price ($2k rent vs $160k).
- Recommended offer: $141k (12.0% below list) — sets the bar for market timing.
Location & tenants
- Location reads 78/100 on livability (#172 in OH, #2,708 nationally) — a middle-class / working-renter tenant base. Strengths: crime A+, cost of living A+, housing A+; Watch: amenities F, commute F.
- Berkshire Local (town): math 52% / reading 60% proficiency, ranked #335 of 656 in OH (top 51%) — acceptable for families but not a draw, mixed tenant base, ~2y average lease; only 19% free/reduced lunch — higher-income household profile.
- Market conditions: 20 active listings in the ZIP; solid renter incomes; 220 units permitted in Geauga County in 2024 (0 in 5+ unit buildings).
- This rent runs 35% of the median local income ($79k/yr) — at the standard rent-burdened threshold; future hikes will face affordability resistance.
Forward outlook
- Local home prices are declining (-3.0%/yr); year-one equity from $1k of loan paydown is wiped out by about $5k of value loss. Plan a longer hold.
- Geauga County population projected to shrink 7% by 2050 — rents likely to lag national; underwrite the cash flow, not the appreciation.
- At projected returns (-3.0% appreciation + 3.0% rent growth), your $45k cash investment doubles in ~6 years — after that, you're playing with house money.
Negotiation context
- It's been on market 163 days — a 12% lower offer ($141k) is reasonable based on typical stale-listing flexibility.
Risks & watch-outs
- Watch-outs: built in 1909 — expect roof / HVAC / electrical / plumbing capex.
Questions for the listing agent
- It's been on market 163 days. Have you received any prior offers? Is the seller open to a 12% concession, seller financing, or rate buy-down credit?
- Built in 1909 — when were the roof, HVAC, electrical panel, plumbing, and water heater last replaced?
- Why hasn't it sold? Are there any deal-killer items the seller is aware of (foundation, flood, title, zoning, code violations)?
- Is there a deadline driving the sale (1031 exchange, divorce, estate, relocation)? That informs how much negotiation room exists.
- Schools are A-rated — typically a magnet for longer-tenancy family renters. What's the average tenant stay here, and is there a school-zone premium baked into asking?
- What's the average days-on-market for RENTAL listings here right now (not sales)? A rising rental-DOM trend means longer vacancies and softer asking-rent achievability than the comps imply.
- What's the recent tenant-quality profile in this submarket — average credit score on applications, eviction rate, late-payment / NSF rate, and stable-employment percentage? A property-management company in the area should have these aggregated.
- How much new for-sale + rental construction is in the pipeline within 1–3 miles? Heavy new supply typically softens prices + rents 12–24 months out; constrained supply supports both.
Investment metrics
- 1% rule
- 1.43% ✓
- Cap rate
- 12.33%
- Cash-on-cash
- 21.54%
- DSCR
- 1.96
- GRM
- 5.8
CMA / ARV
- ARV (median comp)
- $246,318
- List price
- $160,000
- Delta
- -35.04%
- Verdict
- UNDERPRICED
- Comps
- 20 within 1.0 mi
Show comp detail 6 sales within ~0.75 mi
| Address | Dist | Beds/Ba | Sqft | Sold | Price | $/sf | Match |
|---|---|---|---|---|---|---|---|
| 13621 W Spring St | 0.06mi | 3/1.0 | 1,652 (+11%) | 13mo | $190,000 | $115 | 68 |
| 14028 Goodwin St | 0.66mi | 3/1.5 | 1,514 (+2%) | 6mo | $218,000 | $144 | 59 |
| 13757 Carlton St | 0.43mi | 4/1.0 (+1) | 1,492 (+0%) | 22mo | $300,000 | $201 | 56 |
| 14492 Garden St | 0.14mi | 3/2.0 | 1,694 (+14%) | 15mo | $255,000 | $151 | 53 |
| 14734 S Cheshire St | 0.44mi | 4/3.0 (+1) | 1,537 (+3%) | 15mo | $250,000 | $163 | 48 |
| 13595 Carlton St | 0.40mi | 3/1.5 | 1,640 (+10%) | 16mo | $198,000 | $121 | 48 |
Match score weights: distance 35% · size 25% · config 20% · recency 20%. Top-matched comps best support the ARV.
Projected returns pro-forma
-3.0% appreciation · 3.0% rent growth · sell at horizon
- IRR
- 14.1%
- Equity multiple
- 1.56×
- Total profit
- $25,274
- Equity at exit
- $23,857
- IRR
- 22.9%
- Equity multiple
- 2.96×
- Total profit
- $87,868
- Equity at exit
- $13,834
Cash invested: $44,800 (down + closing). Projections, not guarantees.
Landlord ↔ Tenant lean methodology
- Overall (STATE)
- 73 Landlord-Friendly
- State Ohio
- 73 Landlord-Friendly · R+6
- County
- — inherits STATE
- City
- — inherits STATE
ZIP-level market 44021
- Home prices YoY
- -26.7%
- Active inventory
- 20
- Price-to-rent
- 5.8×
Monthly cashflow live
- Estimated rent
- $2,295 medium interval (Pro) →
- Mortgage (P&I)
- −$839
- Tax from tax record
- −$103 /mo · $1,233/yr
- Insurance
- −$67
- HOA
- −$0
- Vacancy / Maint / Mgmt
- −$482
- Net cashflow
- $804
Break-even live
Sensitivity live
| Price | -10% $895 | -5% $850 | +0% $804 | +5% $759 | +10% $714 |
|---|---|---|---|---|---|
| Rent | -10% $623 | -5% $714 | +0% $804 | +5% $895 | +10% $986 |
| Rate | -1.0pp $885 | -0.5pp $845 | base $804 | +0.5pp $763 | +1.0pp $721 |
UW: 25.0% down · 7.5% · 30yr · 1.5% tax · 5.0% vac · 8.0% maint · 8.0% mgmt
Financing live
Cash to close
- Down payment
- $40,000
- Closing costs
- $4,800
- Reserves months
- —
- Total cash needed
- —
Loan-product check · same deal, 3 products live
Conventional
25% down · 7.5% · 30yr
- Down + closing
- —
- Monthly P&I
- —
- Monthly cashflow
- —
- DSCR
- —
- Eligible?
- —
Personal DTI + credit; lowest rate.
DSCR
20% down · 8.5% · 30yr
- Down + closing
- —
- Monthly P&I
- —
- Monthly cashflow
- —
- DSCR
- —
- Eligible?
- —
No personal income docs; deal must DSCR.
Hard money
10% down · 12.0% · 12mo
- Down + closing
- —
- Monthly P&I
- —
- Monthly cashflow
- —
- DSCR
- —
- Eligible?
- —
Short-term bridge; refi at stabilization.
Listing history 19 events
-
2026-06-21days on market $160,000 Active 163 DOM
-
2026-06-21days on market $160,000 Active 162 DOM
-
2026-06-18days on market $160,000 Active 160 DOM
-
2026-06-17days on market $160,000 Active 159 DOM
-
2026-06-16days on market $160,000 Active 158 DOM
-
2026-06-15days on market $160,000 Active 157 DOM
-
2026-06-13days on market $160,000 Active 155 DOM
-
2026-06-12days on market $160,000 Active 154 DOM
-
2026-06-09days on market $160,000 Active 151 DOM
-
2026-06-08days on market $160,000 Active 150 DOM
-
2026-06-07days on market $160,000 Active 149 DOM
-
2026-06-07days on market $160,000 Active 148 DOM
-
2026-06-04days on market $160,000 Active 145 DOM
-
2026-06-02days on market $160,000 Active 144 DOM
-
2026-06-01days on market $160,000 Active 143 DOM
-
2026-05-31days on market $160,000 Active 142 DOM
-
2026-05-08price $160,000 615-char remark
Show marketing remark (615 chars)
Great opportunity in Burton Village! This long-time family-owned century home offers 3 bedrooms and 1 bath in the Berkshire School District, situated on a quiet dead-end street on a spacious half-acre lot. The living room features large windows and a unique dividing wall that opens to the dining room, which provides access to the enclosed porch. The main level also includes a laundry room, one bedroom, the full bath, and a rear storage room. With some TLC, this home has the potential to shine as a charming personal residence or a nice rental investment. A one-year home warranty is included with the purchase.
-
2026-03-03price $175,000 615-char remark
Show marketing remark (615 chars)
Great opportunity in Burton Village! This long-time family-owned century home offers 3 bedrooms and 1 bath in the Berkshire School District, situated on a quiet dead-end street on a spacious half-acre lot. The living room features large windows and a unique dividing wall that opens to the dining room, which provides access to the enclosed porch. The main level also includes a laundry room, one bedroom, the full bath, and a rear storage room. With some TLC, this home has the potential to shine as a charming personal residence or a nice rental investment. A one-year home warranty is included with the purchase.
-
2026-01-08$190,000 Active 615-char remark
Show marketing remark (615 chars)
Great opportunity in Burton Village! This long-time family-owned century home offers 3 bedrooms and 1 bath in the Berkshire School District, situated on a quiet dead-end street on a spacious half-acre lot. The living room features large windows and a unique dividing wall that opens to the dining room, which provides access to the enclosed porch. The main level also includes a laundry room, one bedroom, the full bath, and a rear storage room. With some TLC, this home has the potential to shine as a charming personal residence or a nice rental investment. A one-year home warranty is included with the purchase.
ⓘ Source: listings_history table (triggers on properties + properties_extension) + one-shot
backfill from property_details.listing_events for pre-trigger history.
Tax reassessment forecast OH · Partial reset (capped growth)
- Current annual tax
- $1,233 · $103/mo
- Projected year-2 tax
- $1,865 · $155/mo
- Expected delta
- +$631/yr (+$53/mo · 51.2%)
ⓘ Screening estimate from a state-policy table — verify with the county assessor before closing.
Climate risk First Street
- Flood 1/10 Low FEMA zone X (unshaded) · 0% chance over 30 yrs
- Wildfire 1/10 Low
- Heat 2/10 Low 7 d/yr ≥96°F today · 16 d/yr by 30 yrs out
- Wind 1/10 Low
- Air quality 3/10 Moderate 2 unhealthy d/yr today · 4 by 30 yrs out
Nearby sold comps map
Loading sold comps map…
Walkable amenities ~0.75 mi
Loading nearby amenities…
Taxation est. · year 1
- Rental income
- $27,536
- − Mortgage interest
- −$8,962
- − Property taxes
- −$1,233
- − Insurance
- −$800
- − Repairs & maintenance
- −$2,203
- − Management
- −$2,203
- − Depreciation
- −$4,655
- Taxable income
- $7,480
- Est. tax owed @ 24.0%
- −$1,795
- After-tax cash flow
- $7,856/yr
For passive investors: Depreciation is non-cash, so a rental often shows a tax loss while cash-flowing — sheltering income. Rental losses are passive: they offset passive income freely, and up to $25,000/yr can offset ordinary (W-2) income if you actively participate and your MAGI is under $100k (phasing out to $0 by $150k); unused losses carry forward. On sale, claimed depreciation is recaptured at up to 25%, and gains may owe capital-gains tax (a 1031 exchange can defer both). Figures are a year-1 estimate at your 24.0% rate — not tax advice; consult a CPA.
Schools (NCES district)
- District
- Berkshire Local
- NCES district ID
- 3904716
- Math proficiency
- 52% ▼ -17.00%
- Reading proficiency
- 60% ▼ -6.00%
- Median HH income
- $58,347
- Composite
- 48.53/100
- National rank
- #2117
- State rank
- #335 of 656 in OH
Livability — Burton
- Score
- 78/100
- State rank
- #172
- US rank
- #2708
Category grades
Schools grade is shown separately in the Schools card above.
Census & demographics
- Census place
- Burton, OH
- County
- Geauga · 90,510 people
- Metro
- Cleveland, OH
- Population (ZIP)
- 5,739
- Household income
- $79,359
- Rent vs Own
- Severe rent burden
- 7.9
Population outlook (Geauga County) Hauer SSP2
- Today (2025)
- 94,919 people
- By 2030
- 94,804 · -0.1%
- By 2040
- 92,641 · -2.4%
- By 2050
- 88,198 · -7.1%
- By 2075
- 79,080 · -16.7%
- By 2100
- 60,856 · -35.9%
Race, ethnicity, and origin ACS 2023
- Neighborhood character
- Predominantly White (98%)
- Race & ethnicity
- White 98%
- Common ancestry
- Polish 13% Romanian 6% Slovak 3%
- Foreign-born
- 0%
- Languages at home
- 79% English-only · German/W. Germanic 19% Spanish 1%
Political lean MEDSL · Geauga
- 2024 margin
- Strong R (+24.1) · D 37.5% · R 61.7%
- 2008→2024 swing
- -8.8pp toward R · 2008: -15.4pp · 2024: -24.1pp
- All cycles
- 2024: R+24.1 2020: R+23.1 2016: R+25.5 2012: R+21.6 2008: R+15.4
Not yet ingested
- Civics
- —
Market trends
- HPI YoY
- ▼ -75.64%
- Current HPI
- 207.6825
- Rent YoY
- —
- Metro
- —
- State GDP YoY
- ▲ 1.98%
- F500 in state
- 48
Industry mix (Fortune 500 HQ in OH)
| Industry | F500 HQs | Revenue |
|---|---|---|
| Insurance | 3 | $145B |
|
||
| Industrial Machinery | 3 | $49B |
|
||
| Financial Services | 3 | $24B |
|
||
| Consumer Goods | 2 | $93B |
|
||
| Aerospace / Defense | 2 | $47B |
|
||
| Utilities | 2 | $33B |
|
||
Price history
-15.8% since first listed3 events — show timeline
- 2026-05-08 Price Changed $160,000 MLSNOW
- 2026-03-03 Price Changed $175,000 MLSNOW
- 2026-01-08 Listed $190,000 MLSNOW
Property tax history
+0.5%/yrLatest (2025): $1,233 · -1.6% YoY. Source: county tax records.
Cash-flow waterfall
monthlySold comps — $/sqft
last 12 mo · ≤1 miLoading sold comps…