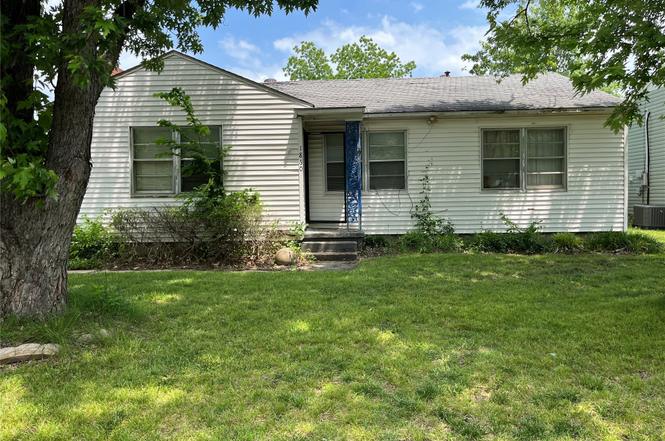
1860 S Armstrong Ave · Bartlesville, OK
Flood risk 1/10 · Minimal
- FEMA flood zone
- X (unshaded)
- Chance of flooding over 30 yrs
- 0.0%
- Est. flood insurance / yr
- $507 – $1,088
Fire risk 7/10 · Major
- Est. fire insurance / yr
- $2,463 – $4,575
Heat risk 6/10 · Moderate
- Hot days now (above 113°F)
- 7 days/yr
- Hot days in 30 yrs
- 18 days/yr
Wind risk 2/10 · Minimal
- Chance of severe wind over 30 yrs
- 4.0%
Air-quality risk 2/10 · Minimal
- Unhealthy air days now
- 1 days/yr
- Unhealthy air days in 30 yrs
- 3 days/yr
Risk factors via First Street. Map © Google.
Why this score? — see what drove the C+ grade
The composite is a weighted blend of 9 inputs, each scored 0–100. Each bar is that input's sub-score; the figure is the points it added to the 100-point composite (weight × sub-score).
- Cash flow +27.8/30.0
- Appreciation +10.0/10.0
- DSCR +9.8/10.0
- 1% rule +6.4/10.0
- Livability +3.2/5.0
- Schools +2.6/10.0
- Rent growth +2.5/5.0
- Condition / age +2.5/5.0
- ARV discount +0.0/15.0
$110,000
🖨 Deal sheet 📄 Offer letter ✓ Due diligence
Listing remarks MLS
The property is being sold " As Is" and the sellers are only accepting cash offers. This 3 bed 1.5 bath located in the heart of Bartlesville has endless opportunities. It is a great investment opportunity to either flip or rent! This property comes with a detached garage and 1,078 sqft of livable space. The sellers will be entertaining all offers!
Key facts
- Fully renovated
- Brand new roof
- New flooring
Tags
Property features AI
Exterior
- Parking: Detached garage (1 car)
- Security: No safety shelter
- Utilities: Cable available; Electricity available; Natural gas available; Phone service available; Public water; Public sewer
- Home design: Single-story home; Faces west; Crawlspace foundation
- Construction: Vinyl siding with wood frame construction; Asphalt/fiberglass roof; Built per public records
- Exterior features: Concrete driveway; Patio; Porch; Privacy fencing
Interior
- Flooring: Carpet
- Bathrooms: 1 full bathroom; 1 half bathroom
- Heating & cooling: Electric heating available; Gas heating available
- Interior features: Aluminum frame windows; Laminate countertops
- Laundry & utility: No hot water (appliance note)
Neighborhood map
What this means for you Summary
Snapshot
- This is a 3-bed/1.5-bath single-family listed at $110k.
Deal economics
- At list price, monthly cash flow is $336 ($4k/yr) — positive.
- The deal already cash-flows at list — no discount required.
- Meets the 1% rule at list price ($1k rent vs $110k).
- Recommended offer: $103k (6.0% below list) — sets the bar for market timing.
- Cap rate 10.0% vs local median 4.7% in Bartlesville — top-decile yield for the area; either an underpriced asset or a hidden risk that comps aren't pricing in. Stress-test before assuming the spread holds.
Location & tenants
- Location reads 64/100 on livability (#175 in OK) — a middle-class / working-renter tenant base. Strengths: cost of living A+, housing A+; Watch: employment C-, schools D+, crime D+.
- Bartlesville (town): math 30% / reading 29% proficiency, ranked #59 of 270 in OK (top 22%) — low school quality limits family demand, transient renter base, plan for 1-2y turnover.
- Market conditions: 137 active listings in the ZIP; 1 comparable units currently listed for rent nearby; 46 units permitted in Washington County in 2024 (0 in 5+ unit buildings).
Forward outlook
- In year one you build about $12k of equity ($761 loan paydown + $11k appreciation (10.0% local appreciation)).
- Washington County population projected at +12% by 2050 — modest demand growth; plan on rents tracking national, not racing it.
- At projected returns (10.0% appreciation + 3.0% rent growth), your $31k cash investment doubles in ~2 years — after that, you're playing with house money.
- By year 4, paydown + projected appreciation supports a ~$42k cash-out refi (75% LTV) — recoverable capital for the next deal without selling this one.
Negotiation context
- It's been on market 65 days — a 6% lower offer ($103k) is reasonable based on typical stale-listing flexibility.
- 4 sale attempts since 17y ago; this cycle's ask has dropped $10k (8%) from the opening price — seller is motivated, your offer sets the floor, not the list.
- Current owner paid $34k; list at $110k implies a 224% gain — meaningful room to come down on a strong offer.
Risks & watch-outs
- Watch-outs: built in 1951 — expect roof / HVAC / electrical / plumbing capex.
- Climate carrying-cost: major wildfire risk; extreme-heat days projected 7→18/yr by 2055 (HVAC capex compounding) — expect insurance premiums to compound above CPI over the hold.
Questions for the listing agent
- It's been on market 65 days. Have you received any prior offers? Is the seller open to a 6% concession, seller financing, or rate buy-down credit?
- Built in 1951 — when were the roof, HVAC, electrical panel, plumbing, and water heater last replaced?
- Why hasn't it sold? Are there any deal-killer items the seller is aware of (foundation, flood, title, zoning, code violations)?
- Is there a deadline driving the sale (1031 exchange, divorce, estate, relocation)? That informs how much negotiation room exists.
- Schools are D-rated, which usually means shorter tenancies and higher turnover. Who's the typical renter profile here, and what's been the actual vacancy rate?
- Crime grade is D in this area — have there been break-ins, vandalism, or insurance claims at this property in the last 3 years? What carrier currently insures it and at what premium?
- What's the average days-on-market for RENTAL listings here right now (not sales)? A rising rental-DOM trend means longer vacancies and softer asking-rent achievability than the comps imply.
- What's the recent tenant-quality profile in this submarket — average credit score on applications, eviction rate, late-payment / NSF rate, and stable-employment percentage? A property-management company in the area should have these aggregated.
- How much new for-sale + rental construction is in the pipeline within 1–3 miles? Heavy new supply typically softens prices + rents 12–24 months out; constrained supply supports both.
Investment metrics
- 1% rule
- 1.14% ✓
- Cap rate
- 9.96%
- Cash-on-cash
- 13.10%
- DSCR
- 1.58
- GRM
- 7.3
CMA / ARV
- ARV (on-the-fly)
- $91,630
- Comps found
- 12
Show comp detail 12 sales within ~0.75 mi
| Address | Dist | Beds/Ba | Sqft | Sold | Price | $/sf | Match |
|---|---|---|---|---|---|---|---|
| 1835 S Armstrong Ave | 0.10mi | 2/1.0 (-1) | 1,050 (-3%) | 6mo | $110,900 | $106 | 79 |
| 1945 S Santa Fe Ave | 0.09mi | 3/1.5 | 1,131 (+5%) | 12mo | $117,000 | $103 | 78 |
| 1548 S Oak Ave | 0.43mi | 3/1.0 | 1,046 (-3%) | 10mo | $60,000 | $57 | 64 |
| 1562 S Hickory Ave | 0.45mi | 3/1.0 | 1,145 (+6%) | 3mo | $47,000 | $41 | 64 |
| 1623 SW Jennings | 0.32mi | 2/1.0 (-1) | 976 (-10%) | 1mo | $31,500 | $32 | 62 |
| 1635 S Maple Ave | 0.31mi | 2/1.0 (-1) | 1,192 (+11%) | 2mo | $85,000 | $71 | 59 |
| 1600 S Elm Ave | 0.44mi | 3/1.0 | 1,184 (+10%) | 5mo | $84,000 | $71 | 56 |
| 1409 S Osage Ave | 0.66mi | 2/1.0 (-1) | 1,014 (-6%) | 5mo | $94,995 | $94 | 48 |
| 1601 Colorado Ave | 0.63mi | 3/1.0 | 944 (-12%) | 0mo | $38,000 | $40 | 48 |
| 1424 S Penn Ave | 0.73mi | 3/1.0 | 1,016 (-6%) | 10mo | $106,950 | $105 | 46 |
| 2261 SE Osage Ave | 0.68mi | 3/1.0 | 989 (-8%) | 9mo | $105,000 | $106 | 45 |
| 1326 S Armstrong Ave | 0.72mi | 3/1.0 | 1,232 (+14%) | 6mo | $104,166 | $85 | 36 |
Match score weights: distance 35% · size 25% · config 20% · recency 20%. Top-matched comps best support the ARV.
Projected returns pro-forma
10.0% appreciation · 3.0% rent growth · sell at horizon
- IRR
- 33.9%
- Equity multiple
- 3.64×
- Total profit
- $81,277
- Equity at exit
- $99,097
- IRR
- 29.2%
- Equity multiple
- 8.22×
- Total profit
- $222,416
- Equity at exit
- $213,706
Cash invested: $30,800 (down + closing). Projections, not guarantees.
Landlord ↔ Tenant lean methodology
- Overall (STATE)
- 83 Strongly Landlord-Friendly
- State Oklahoma
- 83 Strongly Landlord-Friendly · R+20
- County
- — inherits STATE
- City
- — inherits STATE
ZIP-level market 74003
- Home prices YoY
- 5.0%
- Active inventory
- 137
- Price-to-rent
- 7.3×
Monthly cashflow live
- Estimated rent
- $1,254 medium interval (Pro) →
- Mortgage (P&I)
- −$577
- Tax from tax record
- −$32 /mo · $385/yr
- Insurance
- −$46
- HOA
- −$0
- Vacancy / Maint / Mgmt
- −$263
- Net cashflow
- $336
Break-even live
UW: 25.0% down · 7.5% · 30yr · 1.5% tax · 5.0% vac · 8.0% maint · 8.0% mgmt
Financing live
Cash to close
- Down payment
- $27,500
- Closing costs
- $3,300
- Reserves months
- —
- Total cash needed
- —
Loan-product check · same deal, 3 products live
Conventional
25% down · 7.5% · 30yr
- Down + closing
- —
- Monthly P&I
- —
- Monthly cashflow
- —
- DSCR
- —
- Eligible?
- —
Personal DTI + credit; lowest rate.
DSCR
20% down · 8.5% · 30yr
- Down + closing
- —
- Monthly P&I
- —
- Monthly cashflow
- —
- DSCR
- —
- Eligible?
- —
No personal income docs; deal must DSCR.
Hard money
10% down · 12.0% · 12mo
- Down + closing
- —
- Monthly P&I
- —
- Monthly cashflow
- —
- DSCR
- —
- Eligible?
- —
Short-term bridge; refi at stabilization.
Rent comps 1 comps
| Address | Beds | Baths | Sqft | Rent | $/sqft | DOM | Units | Dist |
|---|---|---|---|---|---|---|---|---|
| 821 S Johnstone Ave Bartlesville, OK | 1.0–2.0 | 1.0–2.0 | 888 | $1,521 | $1.71 | 23d | 1 | 1.12mi |
Listing history 11 events
-
2026-05-23status Pending
-
2026-04-28status Active
-
2026-04-15status Pending
-
2026-04-10price $110,000
-
2026-03-06$120,000 Active
-
2024-06-05soldstatus $34,000 Closed 359-char remark
Show marketing remark (359 chars)
The property is being sold " As Is" and the sellers are only accepting cash offers. This 3 bed 1.5 bath located in the heart of Bartlesville has endless opportunities. It is a great investment opportunity to either flip or rent! This property comes with a detached garage and 1,078 sqft of livable space. The sellers will be entertaining all offers!
-
2024-05-21status Pending 359-char remark
Show marketing remark (359 chars)
The property is being sold " As Is" and the sellers are only accepting cash offers. This 3 bed 1.5 bath located in the heart of Bartlesville has endless opportunities. It is a great investment opportunity to either flip or rent! This property comes with a detached garage and 1,078 sqft of livable space. The sellers will be entertaining all offers!
-
2024-05-21$35,000 Active 359-char remark
Show marketing remark (359 chars)
The property is being sold " As Is" and the sellers are only accepting cash offers. This 3 bed 1.5 bath located in the heart of Bartlesville has endless opportunities. It is a great investment opportunity to either flip or rent! This property comes with a detached garage and 1,078 sqft of livable space. The sellers will be entertaining all offers!
-
2010-05-01historical
-
2009-10-30$52,500
-
1996-12-05soldstatus $32,500
ⓘ Source: listings_history table (triggers on properties + properties_extension) + one-shot
backfill from property_details.listing_events for pre-trigger history.
Tax reassessment forecast OK · Resets to sale price
- Current annual tax
- $385 · $32/mo
- Projected year-2 tax
- $990 · $82/mo
- Expected delta
- +$605/yr (+$50/mo · 157.1%)
ⓘ Screening estimate from a state-policy table — verify with the county assessor before closing.
Climate risk First Street
- Flood 1/10 Low FEMA zone X (unshaded) · 0% chance over 30 yrs
- Wildfire 7/10 Severe
- Heat 6/10 Major 7 d/yr ≥113°F today · 18 d/yr by 30 yrs out
- Wind 2/10 Low 4% chance of damaging wind over 30 yrs
- Air quality 2/10 Low 1 unhealthy d/yr today · 3 by 30 yrs out
Nearby sold comps map
Loading sold comps map…
Walkable amenities ~0.75 mi
Loading nearby amenities…
Taxation est. · year 1
- Rental income
- $15,053
- − Mortgage interest
- −$6,162
- − Property taxes
- −$385
- − Insurance
- −$550
- − Repairs & maintenance
- −$1,204
- − Management
- −$1,204
- − Depreciation
- −$3,200
- Taxable income
- $2,348
- Est. tax owed @ 24.0%
- −$563
- After-tax cash flow
- $3,471/yr
For passive investors: Depreciation is non-cash, so a rental often shows a tax loss while cash-flowing — sheltering income. Rental losses are passive: they offset passive income freely, and up to $25,000/yr can offset ordinary (W-2) income if you actively participate and your MAGI is under $100k (phasing out to $0 by $150k); unused losses carry forward. On sale, claimed depreciation is recaptured at up to 25%, and gains may owe capital-gains tax (a 1031 exchange can defer both). Figures are a year-1 estimate at your 24.0% rate — not tax advice; consult a CPA.
Schools (NCES district)
- District
- Bartlesville
- NCES district ID
- 4003630
- Math proficiency
- 30% ▼ -13.00%
- Reading proficiency
- 29% ▼ -10.00%
- Median HH income
- $48,889
- Composite
- 25.69/100
- National rank
- #7389
- State rank
- #59 of 270 in OK
Livability — Bartlesville
- Score
- 64/100
- State rank
- #175
- US rank
- #13940
Category grades
Schools grade is shown separately in the Schools card above.
Census & demographics
- Census place
- Bartlesville, OK
- County
- Washington County · 41,935 people
- City population
- 41,935
- Metro
- Bartlesville, OK
- Population (ZIP)
- 14,024
- Household income
- $47,168
- Rent vs Own
- Severe rent burden
- 395.0
Population outlook (Washington County) Hauer SSP2
- Today (2025)
- 54,946 people
- By 2030
- 56,249 · +2.4%
- By 2040
- 58,867 · +7.1%
- By 2050
- 61,600 · +12.1%
- By 2075
- 69,355 · +26.2%
- By 2100
- 73,067 · +33.0%
Race, ethnicity, and origin ACS 2023
- Neighborhood character
- Predominantly White (69%)
- Race & ethnicity
- White 69% Two or more races 14% Hispanic / Latino 7% Native American 7% Black 4%
- Hispanic origin (detail)
- Mexican 6%
- Common ancestry
- Slovak 2% Lithuanian 2% Italian 2%
- Foreign-born
- 2% · Canada
- Languages at home
- 96% English-only · Spanish 4%
Political lean MEDSL · Washington
- 2024 margin
- Solid R (+47.6) · D 25.0% · R 72.7% · Other 2.4%
- 2008→2024 swing
- -3.1pp toward R · 2008: -44.6pp · 2024: -47.6pp
- All cycles
- 2024: R+47.6 2020: R+48.0 2016: R+48.5 2012: R+47.8 2008: R+44.6
Not yet ingested
- Civics
- —
Market trends
- HPI YoY
- ▲ 14.78%
- Current HPI
- 309.9534
- Rent YoY
- —
- Metro
- Bartlesville, OK
- State GDP YoY
- ▲ 1.55%
- F500 in state
- 6
Industry mix (Fortune 500 HQ in OK)
| Industry | F500 HQs | Revenue |
|---|---|---|
| Energy | 3 | $48B |
|
||
Price history
+238.5% since first listed11 events — show timeline
- 2026-05-23 Pending — MLS Technology, Inc.
- 2026-04-28 Relisted — MLS Technology, Inc.
- 2026-04-15 Pending — MLS Technology, Inc.
- 2026-04-10 Price Changed $110,000 MLS Technology, Inc.
- 2026-03-06 Listed $120,000 MLS Technology, Inc.
- 2024-06-05 Sold (MLS) $34,000 MLS Technology, Inc.
- 2024-05-21 Pending — MLS Technology, Inc.
- 2024-05-21 Listed $35,000 MLS Technology, Inc.
- 2010-05-01 Listing Removed — MLS Technology, Inc.
- 2009-10-30 Listed $52,500 MLS Technology, Inc.
- 1996-12-05 Sold (Public Records) $32,500 Public Records
Property tax history
+1.4%/yrLatest (2025): $385 · -15.4% YoY. Source: county tax records.
Cash-flow waterfall
monthlySold comps — $/sqft
last 12 mo · ≤1 miLoading sold comps…