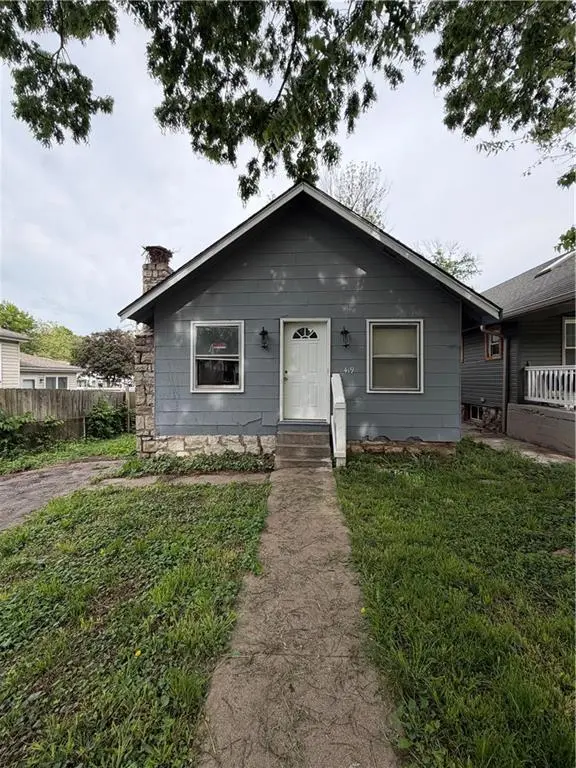
419 N Elmwood Ave · Kansas City, MO
Flood risk 6/10 · Moderate
- FEMA flood zone
- X (unshaded)
- Chance of flooding over 30 yrs
- 0.73%
- Est. flood insurance / yr
- $507 – $1,088
Fire risk 3/10 · Minor
- Est. fire insurance / yr
- $1,054 – $1,958
Heat risk 4/10 · Minor
- Hot days now (above 107°F)
- 7 days/yr
- Hot days in 30 yrs
- 17 days/yr
Wind risk 2/10 · Minimal
- Chance of severe wind over 30 yrs
- —
Air-quality risk 3/10 · Minor
- Unhealthy air days now
- 2 days/yr
- Unhealthy air days in 30 yrs
- 3 days/yr
Risk factors via First Street. Map © Google.
Why this score? — see what drove the B- grade
The composite is a weighted blend of 9 inputs, each scored 0–100. Each bar is that input's sub-score; the figure is the points it added to the 100-point composite (weight × sub-score).
- Cash flow +30.0/30.0
- 1% rule +10.0/10.0
- DSCR +10.0/10.0
- ARV discount +7.5/15.0
- Livability +3.9/5.0
- Rent growth +2.5/5.0
- Condition / age +2.5/5.0
- Schools +1.5/10.0
- Appreciation +0.0/10.0
$50,000
🖨 Deal sheet (PDF) 📄 Offer letter ✓ Due diligence
Listing remarks MLS
Great for a re habber- PRICE REFLECTS CONDITION OF HOME
Key facts
- Large dining rooms
- Off street parking
- Eat in kitchen
Tags
Property features AI
Finance
- Other: Living area reported as 1,888 total; Above-grade finished area and below-grade finished area reported from public records; Age: 101 years or more
- Financial info: Tax annual amount reported
Exterior
- Parking: Off-street parking
- Utilities: City/public water (verify); Public sewer; Cable, fiber, and high-speed internet available
- Home design: Single-family residence; Bungalow/Ranch floor plan; Fixer condition; Residential property
- Construction: Asbestos construction materials; Composition roof; Partial stone/rock basement with walk-up and walk-out access
- Exterior features: City lot; Not in a flood plain; Directions: Just south of Gladstone Blvd.
Interior
- Kitchen: Eat-in kitchen
- Bedrooms: 2 bedrooms (includes main-floor primary bedroom)
- Flooring: Wood flooring
- Bathrooms: 1 full bathroom
- Heating & cooling: Forced air heating; Electric cooling
- Interior features: Fireplace in the living room; Eat-in kitchen and formal dining area; Main-floor bedroom and main-floor primary bedroom
- Laundry & utility: Laundry in basement
Neighborhood map
What this means for you Summary
Snapshot
- This is a 2-bed/1.0-bath single-family listed at $50k.
Deal economics
- At list price, monthly cash flow is $607 ($7k/yr) — positive.
- The deal already cash-flows at list — no discount required.
- Meets the 1% rule at list price ($1k rent vs $50k).
- Cap rate 20.9% vs local median 3.9% in Kansas City — top-decile yield for the area; either an underpriced asset or a hidden risk that comps aren't pricing in. Stress-test before assuming the spread holds.
Location & tenants
- Location reads 78/100 on livability (#28 in MO, #2,671 nationally) — a middle-class / working-renter tenant base. Strengths: amenities A+, commute A+, cost of living A+; Watch: crime F.
- Kansas City 33 (urban): math 12% / reading 24% proficiency, ranked #308 of 324 in MO (top 95%) — low school quality limits family demand, transient renter base, plan for 1-2y turnover; 75% free/reduced lunch — lower-income household profile, screen leases tightly.
- Zoned schools: Gladstone Elementary (math 17% / reading 27%, grade F, #910 of 1,115 statewide, top 83%, 372 students, 99% FRL); Northeast Middle School (math 4% / reading 9%, grade F, #384 of 391 statewide, top 98%, 555 students, 100% FRL); Northeast High (math 2% / reading 22%, grade F, #497 of 521 statewide, top 96%, 657 students, 100% FRL) — zoned schools average 99% FRL vs 75% district-wide (24 pts higher); higher-poverty schools than district average — tighter screening recommended.
- Market conditions: 61 active listings in the ZIP; 22 comparable units currently listed for rent nearby; rentals at typical pace (median 25d on market — plan ~3-4 weeks tenant-placement turnaround); 4,002 units permitted in Jackson County in 2024 (2,271 in 5+ unit buildings).
Forward outlook
- Local home prices are declining (-3.0%/yr); year-one equity from $346 of loan paydown is wiped out by about $2k of value loss. Plan a longer hold.
- Jackson County population projected at +4% by 2050 — modest demand growth; plan on rents tracking national, not racing it.
- At projected returns (-3.0% appreciation + 3.0% rent growth), your $14k cash investment doubles in ~3 years — after that, you're playing with house money.
Negotiation context
- Only 4 days on market — expect competitive offers; lowballing is unlikely to land.
- 3 sale attempts since 18y ago with the ask held roughly flat each time — persistent listings suggest the price (not the market) is what's stuck; bring a comps-based counter.
Risks & watch-outs
- Watch-outs: built in 1924 — expect roof / HVAC / electrical / plumbing capex.
- Climate carrying-cost: major flood risk — expect insurance premiums to compound above CPI over the hold.
Questions for the listing agent
- Built in 1924 — when were the roof, HVAC, electrical panel, plumbing, and water heater last replaced?
- Is there a deadline driving the sale (1031 exchange, divorce, estate, relocation)? That informs how much negotiation room exists.
- Crime grade is F in this area — have there been break-ins, vandalism, or insurance claims at this property in the last 3 years? What carrier currently insures it and at what premium?
- What's the average days-on-market for RENTAL listings here right now (not sales)? A rising rental-DOM trend means longer vacancies and softer asking-rent achievability than the comps imply.
- What's the recent tenant-quality profile in this submarket — average credit score on applications, eviction rate, late-payment / NSF rate, and stable-employment percentage? A property-management company in the area should have these aggregated.
- How much new for-sale + rental construction is in the pipeline within 1–3 miles? Heavy new supply typically softens prices + rents 12–24 months out; constrained supply supports both.
Investment metrics
- 1% rule
- 2.43% ✓
- Cap rate
- 20.85%
- Cash-on-cash
- 52.00%
- DSCR
- 3.31
- GRM
- 3.4
CMA / ARV
- ARV (median comp)
- $202,171
- List price
- $50,000
- Delta
- -75.27%
- Verdict
- UNDERPRICED
- Comps
- 20 within 1.0 mi
Show comp detail 12 sales within ~0.75 mi
| Address | Dist | Beds/Ba | Sqft | Sold | Price | $/sf | Match |
|---|---|---|---|---|---|---|---|
| 422 N Kensington Ave | 0.16mi | 2/1.0 | 1,201 (+7%) | 0mo | $179,000 | $149 | 80 |
| 409 N Elmwood Ave | 0.01mi | 3/1.0 (+1) | 1,214 (+8%) | 7mo | $215,000 | $177 | 75 |
| 410 N Lawn Ave | 0.03mi | 3/1.0 (+1) | 1,230 (+10%) | 8mo | $190,000 | $154 | 70 |
| 443 N Quincy Ave | 0.32mi | 2/1.0 | 1,000 (-11%) | 1mo | $169,000 | $169 | 66 |
| 137 Chelsea Ave | 0.47mi | 2/1.0 | 1,190 (+6%) | 6mo | $69,900 | $59 | 63 |
| 110 N Monroe Ave | 0.61mi | 3/1.0 (+1) | 1,112 (-1%) | 7mo | $85,000 | $76 | 59 |
| 4024 Morrell St | 0.50mi | 3/1.0 (+1) | 1,156 (+3%) | 9mo | $97,000 | $84 | 59 |
| 3906 Windsor Ave | 0.50mi | 3/2.0 (+1) | 1,194 (+7%) | 3mo | $129,900 | $109 | 54 |
| 447 N Hardesty Ave | 0.50mi | 2/1.0 | 976 (-13%) | 4mo | $187,000 | $192 | 52 |
| 314 N Topping Ave | 0.74mi | 2/1.5 | 1,032 (-8%) | 3mo | $124,900 | $121 | 48 |
| 5217 Wilburn Ct | 0.48mi | 3/1.5 (+1) | 1,248 (+11%) | 8mo | $189,900 | $152 | 45 |
| 3618 Anderson Ave | 0.71mi | 3/1.0 (+1) | 1,219 (+9%) | 8mo | $99,000 | $81 | 41 |
Match score weights: distance 35% · size 25% · config 20% · recency 20%. Top-matched comps best support the ARV.
Projected returns pro-forma
-3.0% appreciation · 3.0% rent growth · sell at horizon
- IRR
- 50.0%
- Equity multiple
- 3.18×
- Total profit
- $30,562
- Equity at exit
- $7,455
- IRR
- 55.4%
- Equity multiple
- 6.46×
- Total profit
- $76,465
- Equity at exit
- $4,323
Cash invested: $14,000 (down + closing). Projections, not guarantees.
Landlord ↔ Tenant lean methodology
- Overall (STATE)
- 81 Strongly Landlord-Friendly
- State Missouri
- 81 Strongly Landlord-Friendly · R+10
- County
- — inherits STATE
- City
- — inherits STATE
ZIP-level market 64123
- Home prices YoY
- -8.3%
- Active inventory
- 61
- Price-to-rent
- 3.4×
Monthly cashflow live
- Estimated rent
- $1,216 high interval (Pro) →
- Mortgage (P&I)
- −$262
- Tax from tax record
- −$71 /mo · $850/yr
- Insurance
- −$21
- HOA
- −$0
- Vacancy / Maint / Mgmt
- −$255
- Net cashflow
- $607
Break-even live
Sensitivity live
| Price | -10% $635 | -5% $621 | +0% $607 | +5% $593 | +10% $578 |
|---|---|---|---|---|---|
| Rent | -10% $511 | -5% $559 | +0% $607 | +5% $655 | +10% $703 |
| Rate | -1.0pp $632 | -0.5pp $619 | base $607 | +0.5pp $594 | +1.0pp $581 |
UW: 25.0% down · 7.5% · 30yr · 1.5% tax · 5.0% vac · 8.0% maint · 8.0% mgmt
Financing live
Cash to close
- Down payment
- $12,500
- Closing costs
- $1,500
- Reserves months
- —
- Total cash needed
- —
Loan-product check · same deal, 3 products live
Conventional
25% down · 7.5% · 30yr
- Down + closing
- —
- Monthly P&I
- —
- Monthly cashflow
- —
- DSCR
- —
- Eligible?
- —
Personal DTI + credit; lowest rate.
DSCR
20% down · 8.5% · 30yr
- Down + closing
- —
- Monthly P&I
- —
- Monthly cashflow
- —
- DSCR
- —
- Eligible?
- —
No personal income docs; deal must DSCR.
Hard money
10% down · 12.0% · 12mo
- Down + closing
- —
- Monthly P&I
- —
- Monthly cashflow
- —
- DSCR
- —
- Eligible?
- —
Short-term bridge; refi at stabilization.
Rent comps 22 comps
| Address | Beds | Baths | Sqft | Rent | $/sqft | DOM | Units | Dist |
|---|---|---|---|---|---|---|---|---|
| 5213 Wilburn Ct Kansas City, MO | 3.0 | 1.0 | 1274 | $1,375 | $1.08 | 23d | 1 | 0.45mi |
| 3921 Norledge Ave Unit 2E Kansas City, MO | 2.0 | 1.0 | 900 | $950 | $1.06 | 45d | 1 | 0.45mi |
| 3913 Scarritt Ave Apt 2W Kansas City, MO | 1.0 | 1.0 | 700 | $800 | $1.14 | 4d | 1 | 0.50mi |
| 445 N Lawndale Ave Kansas City, MO | 2.0 | 1.0 | 700 | $1,200 | $1.71 | 25d | 1 | 0.66mi |
| 3523 Saint John Ave Kansas City, MO | 3.0 | 1.0 | 1500 | $995 | $0.66 | 25d | 1 | 0.74mi |
| 135 Lawndale Ave Kansas City, MO | 3.0 | 2.0 | 920 | $1,500 | $1.63 | 9d | 1 | 0.81mi |
| 203 N Indiana Ave Unit 209 Indiana Kansas City, MO | 2.0 | 1.0 | 1500 | $1,400 | $0.93 | 45d | 1 | 0.82mi |
| 216 N Wheeling Ave Kansas City, MO | 3.0 | 2.0 | 1474 | $1,495 | $1.01 | 18d | 1 | 0.92mi |
| 216 N Wheeling Ave Kansas City, MO | 3.0 | 2.0 | 1474 | $1,495 | $1.01 | 21d | 1 | 0.92mi |
| 3423 Garner Ave Unit B Kansas City, MO | 2.0 | 1.0 | 800 | $900 | $1.12 | 45d | 1 | 1.00mi |
| 303 White Ave Unit 2 Kansas City, MO | 2.0 | 1.0 | 1060 | $950 | $0.90 | 12d | 1 | 1.00mi |
| 301 Benton Blvd Unit 2 Kansas City, MO | 2.0 | 1.0 | 850 | $1,025 | $1.21 | 25d | 1 | 1.03mi |
| 301 Benton Blvd Unit 3 Kansas City, MO | 2.0 | 1.0 | 850 | $970 | $1.14 | 9d | 1 | 1.03mi |
| 815 Elmwood Ave Kansas City, MO | 3.0 | 1.5 | 1302 | $1,600 | $1.23 | 16d | 1 | 1.10mi |
| 301 Bellefontaine Ave Unit B Kansas City, MO | 1.0 | 1.0 | 700 | $850 | $1.21 | 18d | 1 | 1.14mi |
| 311 Bellefontaine Ave Kansas City, MO | 3.0 | 2.0 | 1360 | $2,200 | $1.62 | 45d | 1 | 1.16mi |
| 3435 E 7th St Kansas City, MO | 2.0 | 1.0 | 970 | $949 | $0.98 | 9d | 1 | 1.20mi |
| 504 Bellefontaine Ave Unit 2 Kansas City, MO | 2.0 | 2.0 | 1500 | $1,300 | $0.87 | 45d | 1 | 1.29mi |
| 412 Montgall Ave Unit 412 Kansas City, MO | 2.0 | 2.0 | 900 | $1,200 | $1.33 | 45d | 1 | 1.33mi |
| 414 Prospect Ave Unit 1 Kansas City, MO | 2.0 | 1.0 | 900 | $1,295 | $1.44 | 9d | 1 | 1.41mi |
| 901 Benton Blvd Unit 7 Kansas City, MO | 2.0 | 1.0 | 1100 | $1,202 | $1.09 | 45d | 1 | 1.43mi |
| 513 Prospect Ave Unit 6 Kansas City, MO | 1.0 | 1.0 | 700 | $795 | $1.14 | 25d | 1 | 1.44mi |
Listing history 7 events
-
2026-05-05status Pending 487-char remark
-
2026-05-01$50,000 Active 487-char remark
-
2011-11-18soldstatus 55-char remark
Show marketing remark (55 chars)
Great for a re habber- PRICE REFLECTS CONDITION OF HOME
-
2011-11-10$13,900 55-char remark
Show marketing remark (55 chars)
Great for a re habber- PRICE REFLECTS CONDITION OF HOME
-
2008-06-13soldstatus
Show marketing remark (128 chars)
take a look at this bungalow. sold as-is/where is condition, special addendums applies, must be approved buyer or verified cash.
-
2008-03-05$17,900
Show marketing remark (128 chars)
take a look at this bungalow. sold as-is/where is condition, special addendums applies, must be approved buyer or verified cash.
-
1994-11-08soldstatus
ⓘ Source: listings_history table (triggers on properties + properties_extension) + one-shot
backfill from property_details.listing_events for pre-trigger history.
Tax reassessment forecast MO · Resets to sale price
- Current annual tax
- $850 · $71/mo
- Projected year-2 tax
- $850 · $71/mo
- Expected delta
- $0/yr ($0/mo · 0.0%)
ⓘ Screening estimate from a state-policy table — verify with the county assessor before closing.
Climate risk First Street
- Flood 6/10 Major FEMA zone X (unshaded) · 73% chance over 30 yrs
- Wildfire 3/10 Moderate
- Heat 4/10 Moderate 7 d/yr ≥107°F today · 17 d/yr by 30 yrs out
- Wind 2/10 Low
- Air quality 3/10 Moderate 2 unhealthy d/yr today · 3 by 30 yrs out
Nearby sold comps map
Loading sold comps map…
Walkable amenities ~0.75 mi
Loading nearby amenities…
Taxation est. · year 1
- Rental income
- $14,591
- − Mortgage interest
- −$2,801
- − Property taxes
- −$850
- − Insurance
- −$250
- − Repairs & maintenance
- −$1,167
- − Management
- −$1,167
- − Depreciation
- −$1,455
- Taxable income
- $6,901
- Est. tax owed @ 24.0%
- −$1,656
- After-tax cash flow
- $5,624/yr
For passive investors: Depreciation is non-cash, so a rental often shows a tax loss while cash-flowing — sheltering income. Rental losses are passive: they offset passive income freely, and up to $25,000/yr can offset ordinary (W-2) income if you actively participate and your MAGI is under $100k (phasing out to $0 by $150k); unused losses carry forward. On sale, claimed depreciation is recaptured at up to 25%, and gains may owe capital-gains tax (a 1031 exchange can defer both). Figures are a year-1 estimate at your 24.0% rate — not tax advice; consult a CPA.
Schools (NCES district)
- District
- Kansas City 33
- NCES district ID
- 2916400
- Math proficiency
- 12% ▼ -8.00%
- Reading proficiency
- 24% ▬ 0.00%
- Median HH income
- $35,227
- Composite
- 14.8/100
- National rank
- #9387
- State rank
- #308 of 324 in MO
Livability — Kansas City
- Score
- 78/100
- State rank
- #28
- US rank
- #2671
Category grades
Schools grade is shown separately in the Schools card above.
Census & demographics
- Census place
- Kansas City, MO
- County
- Jackson County · 687,798 people
- City population
- 439,467
- Metro
- Kansas City, MO-KS
- Population (ZIP)
- 11,833
- Household income
- $54,443
- Rent vs Own
- Severe rent burden
- 338.0
Population outlook (Jackson County) Hauer SSP2
- Today (2025)
- 719,589 people
- By 2030
- 731,456 · +1.6%
- By 2040
- 746,689 · +3.8%
- By 2050
- 749,289 · +4.1%
- By 2075
- 736,227 · +2.3%
- By 2100
- 668,210 · -7.1%
Race, ethnicity, and origin ACS 2023
- Neighborhood character
- Diverse neighborhood (Simpson 0.64)
- Race & ethnicity
- Hispanic / Latino 48% White 34% Two or more races 25% Black 10% Asian 5% Native American 2%
- Hispanic origin (detail)
- Mexican 37% Puerto Rican 1% Cuban 3%
- Common ancestry
- Italian 2% Arab 2% Romanian 1%
- Foreign-born
- 22% · Canada, Vietnam, Philippines
- Languages at home
- 58% English-only · Spanish 35% Arabic 2% Vietnamese 1%
Political lean MEDSL · Jackson
- 2024 margin
- D (+19.3) · D 58.9% · R 39.5% · Other 1.6%
- 2008→2024 swing
- -6.1pp toward R · 2008: 25.4pp · 2024: 19.3pp
- All cycles
- 2024: D+19.3 2020: D+22.0 2016: D+16.6 2012: D+19.0 2008: D+25.4
Not yet ingested
- Civics
- —
Market trends
- HPI YoY
- ▼ -35.35%
- Current HPI
- 392.4402
- Rent YoY
- —
- Metro
- Kansas City, MO-KS
- State GDP YoY
- ▲ 1.84%
- F500 in state
- 20
Industry mix (Fortune 500 HQ in MO)
| Industry | F500 HQs | Revenue |
|---|---|---|
| Healthcare | 1 | $163B |
|
||
| Insurance | 1 | $21B |
|
||
| Industrial Technology | 1 | $17B |
|
||
| Retail | 1 | $16B |
|
||
| Industrial Distribution | 1 | $10B |
|
||
| Utilities | 1 | $9B |
|
||
Price history
+179.3% since first listed8 events — show timeline
- 2026-06-10 Sold (MLS) — Heartland MLS as Distributed by MLS Grid
- 2026-05-05 Pending — Heartland MLS as Distributed by MLS Grid
- 2026-05-01 Listed $50,000 Heartland MLS as Distributed by MLS Grid
- 2011-11-18 Sold (MLS) — Heartland MLS as Distributed by MLS Grid
- 2011-11-10 Listed $13,900 Heartland MLS as Distributed by MLS Grid
- 2008-06-13 Sold (MLS) — Heartland MLS as Distributed by MLS Grid
- 2008-03-05 Listed $17,900 Heartland MLS as Distributed by MLS Grid
- 1994-11-08 Sold (Public Records) — Public Records
Property tax history
+4.7%/yrLatest (2025): $850 · +22.2% YoY. Source: county tax records.
Cash-flow waterfall
monthlySold comps — $/sqft
last 12 mo · ≤1 miLoading sold comps…