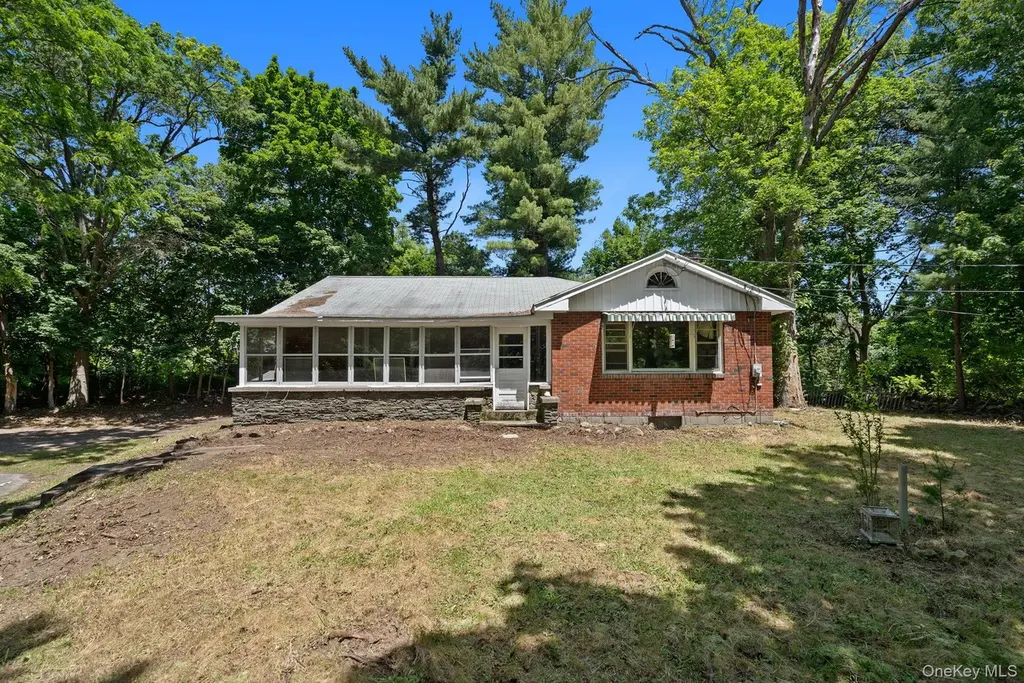
687 Route 52 · Beacon, NY
Flood risk 1/10 · Minimal
- FEMA flood zone
- X (unshaded)
- Chance of flooding over 30 yrs
- 0.0%
- Est. flood insurance / yr
- $473 – $860
Fire risk 3/10 · Minor
- Est. fire insurance / yr
- $691 – $1,283
Heat risk 5/10 · Moderate
- Hot days now (above 98°F)
- 7 days/yr
- Hot days in 30 yrs
- 15 days/yr
Wind risk 4/10 · Minor
- Chance of severe wind over 30 yrs
- 15.0%
Air-quality risk 2/10 · Minimal
- Unhealthy air days now
- 2 days/yr
- Unhealthy air days in 30 yrs
- 2 days/yr
Risk factors via First Street. Map © Google.
Why this score? — see what drove the C- grade
The composite is a weighted blend of 9 inputs, each scored 0–100. Each bar is that input's sub-score; the figure is the points it added to the 100-point composite (weight × sub-score).
- Cash flow +15.4/30.0
- ARV discount +7.5/15.0
- 1% rule +6.5/10.0
- Schools +5.1/10.0
- Rent growth +4.8/5.0
- DSCR +4.7/10.0
- Livability +4.3/5.0
- Condition / age +2.5/5.0
- Appreciation +0.0/10.0
$250,000
🖨 Deal sheet 📄 Offer letter ✓ Due diligence
Listing remarks
Opportunity awaits in this charming Beacon property! Featuring 3 bedrooms and 1,552 square feet, this home is ready for its next chapter and offers plenty of potential for updates and personalization. Situated on a spacious lot with convenient access to major commuter routes, Metro-North, shopping, dining, and all the attractions that make Beacon one of the Hudson Valley's most sought-after communities. Whether you're looking to renovate, invest, or create your dream home, this property provides a solid foundation and endless possibilities. Being sold as-is.
Key facts
- 0.33 acre lot
- Garage
- Built 1952
Property features AI
Exterior
- Parking: Driveway; 1-car garage
- Utilities: Septic tank; Water connected
- Home design: Single family residence
- Construction: Brick exterior
- Exterior features: Brick construction; Not waterfront
Interior
- Kitchen: Appliances: Other
- Bedrooms: Total rooms: 5
- Bathrooms: 1 full bathroom
- Heating & cooling: Oil heating; No central air conditioning
- Interior features: First-floor bedroom; First-floor full bathroom; Full unfinished walk-out basement; Pull-down attic stairs
- Laundry & utility: Basement utility space
Neighborhood map
What this means for you Summary
Snapshot
- This is a 3-bed/1.0-bath single-family listed at $250k.
Deal economics
- At list price, monthly cash flow is $96 ($1k/yr) — positive.
- The deal already cash-flows at list — no discount required.
- Meets the 1% rule at list price ($3k rent vs $250k).
- Cap rate 6.8% vs local median 2.7% in Beacon — top-decile yield for the area; either an underpriced asset or a hidden risk that comps aren't pricing in. Stress-test before assuming the spread holds.
Location & tenants
- Location reads 86/100 on livability (#20 in NY, #385 nationally) — a professional / high-income tenant draw. Strengths: crime A+, commute A+, employment A+; Watch: cost of living F.
- Beacon City School District (suburban): math 56% / reading 56% proficiency, ranked #304 of 755 in NY (top 40%) — acceptable for families but not a draw, mixed tenant base, ~2y average lease.
- Zoned schools: Glenham School (362 students, 40% FRL); Rombout Middle School (math 64% / reading 70%, grade A-, #101 of 729 statewide, top 15%, 615 students, 51% FRL); Beacon High School (math 90%, 830 students, 47% FRL).
- Market conditions: Rents rising fast (+9.1%/yr); 109 active listings in the ZIP; solid renter incomes; 620 units permitted in Dutchess County in 2024 (242 in 5+ unit buildings).
- This rent runs 37% of the median local income ($92k/yr) — at the standard rent-burdened threshold; future hikes will face affordability resistance.
Forward outlook
- Local home prices are declining (-3.0%/yr); year-one equity from $2k of loan paydown is wiped out by about $8k of value loss. Plan a longer hold.
- Dutchess County population projected at -11% by 2050 — secular population decline; favor cash flow + early exit over multi-decade hold.
- At projected returns (-3.0% appreciation + 8.0% rent growth), your $70k cash investment doubles in ~10 years — after that, you're playing with house money.
Negotiation context
- Only 6 days on market — expect competitive offers; lowballing is unlikely to land.
- Current owner paid $155k; list at $250k implies a 61% gain — meaningful room to come down on a strong offer.
Risks & watch-outs
- Watch-outs: property tax is 3.7% of price; built in 1952 — expect roof / HVAC / electrical / plumbing capex.
- Climate carrying-cost: extreme-heat days projected 7→15/yr by 2055 (HVAC capex compounding) — expect insurance premiums to compound above CPI over the hold.
Questions for the listing agent
- Built in 1952 — when were the roof, HVAC, electrical panel, plumbing, and water heater last replaced?
- Property tax is high relative to price — has the assessment been appealed recently, and will the sale trigger a re-assessment?
- Is there a deadline driving the sale (1031 exchange, divorce, estate, relocation)? That informs how much negotiation room exists.
- What's the average days-on-market for RENTAL listings here right now (not sales)? A rising rental-DOM trend means longer vacancies and softer asking-rent achievability than the comps imply.
- What's the recent tenant-quality profile in this submarket — average credit score on applications, eviction rate, late-payment / NSF rate, and stable-employment percentage? A property-management company in the area should have these aggregated.
- How much new for-sale + rental construction is in the pipeline within 1–3 miles? Heavy new supply typically softens prices + rents 12–24 months out; constrained supply supports both.
Investment metrics
- 1% rule
- 1.15% ✓
- Cap rate
- 6.75%
- Cash-on-cash
- 1.64%
- DSCR
- 1.07
- GRM
- 7.2
CMA / ARV
- ARV (on-the-fly)
- $513,712
- Comps found
- 8
Show comp detail 8 sales within ~0.75 mi
| Address | Dist | Beds/Ba | Sqft | Sold | Price | $/sf | Match |
|---|---|---|---|---|---|---|---|
| 6 Siscar Pl | 0.17mi | 3/1.0 | 1,484 (-4%) | 7mo | $425,000 | $286 | 79 |
| 15 Lucas Ln | 0.20mi | 4/1.5 (+1) | 1,600 (+3%) | 13mo | $530,000 | $331 | 68 |
| 14 Park Ln | 0.58mi | 3/2.0 | 1,386 (-11%) | 8mo | $485,000 | $350 | 44 |
| 9 Stewart Ave | 0.70mi | 4/1.5 (+1) | 1,440 (-7%) | 8mo | $495,000 | $344 | 42 |
| 4 York St | 0.74mi | 2/1.0 (-1) | 1,659 (+7%) | 13mo | $459,000 | $277 | 39 |
| 140-142 Belvedere Rd | 0.70mi | 3/2.0 | 1,440 (-7%) | 22mo | $484,500 | $336 | 33 |
| 28 Putnam Rd | 0.73mi | 3/2.0 | 1,672 (+8%) | 20mo | $385,000 | $230 | 33 |
| 30 Kip Dr | 0.74mi | 4/1.0 (+1) | 1,724 (+11%) | 17mo | $477,500 | $277 | 28 |
Match score weights: distance 35% · size 25% · config 20% · recency 20%. Top-matched comps best support the ARV.
Projected returns pro-forma
-3.0% appreciation · 8.0% rent growth · sell at horizon
- IRR
- -6.8%
- Equity multiple
- 0.73×
- Total profit
- $-18,835
- Equity at exit
- $37,276
- IRR
- 9.1%
- Equity multiple
- 1.89×
- Total profit
- $62,166
- Equity at exit
- $21,615
Cash invested: $70,000 (down + closing). Projections, not guarantees.
Landlord ↔ Tenant lean methodology
- Overall (STATE)
- 15 Strongly Tenant-Friendly
- State New York
- 15 Strongly Tenant-Friendly · D+10
- County
- — inherits STATE
- City
- — inherits STATE
ZIP-level market 12508
- Home prices YoY
- -30.1%
- Rents YoY
- 9.1%
- Active inventory
- 109
- Price-to-rent
- 7.2×
Monthly cashflow live
- Estimated rent
- $2,885 medium interval (Pro) →
- Mortgage (P&I)
- −$1,311
- Tax from tax record
- −$768 /mo · $9,216/yr
- Insurance
- −$104
- HOA
- −$0
- Vacancy / Maint / Mgmt
- −$606
- Net cashflow
- $96
Break-even live
UW: 25.0% down · 7.5% · 30yr · 1.5% tax · 5.0% vac · 8.0% maint · 8.0% mgmt
Financing live
Cash to close
- Down payment
- $62,500
- Closing costs
- $7,500
- Reserves months
- —
- Total cash needed
- —
Loan-product check · same deal, 3 products live
Conventional
25% down · 7.5% · 30yr
- Down + closing
- —
- Monthly P&I
- —
- Monthly cashflow
- —
- DSCR
- —
- Eligible?
- —
Personal DTI + credit; lowest rate.
DSCR
20% down · 8.5% · 30yr
- Down + closing
- —
- Monthly P&I
- —
- Monthly cashflow
- —
- DSCR
- —
- Eligible?
- —
No personal income docs; deal must DSCR.
Hard money
10% down · 12.0% · 12mo
- Down + closing
- —
- Monthly P&I
- —
- Monthly cashflow
- —
- DSCR
- —
- Eligible?
- —
Short-term bridge; refi at stabilization.
Listing history 7 events
-
2026-06-15days on market $250,000 Active 6 DOM
-
2026-06-14days on market $250,000 Active 4 DOM
-
2026-06-10statusdays on market $250,000 Active 1 DOM
-
2026-06-09days on market $250,000 Coming Soon 3 DOM
-
2026-06-08days on market $250,000 Coming Soon 2 DOM
-
2026-06-07remarks 564-char remark
-
2026-06-07$250,000 Coming Soon 1 DOM
ⓘ Source: listings_history table (triggers on properties + properties_extension) + one-shot
backfill from property_details.listing_events for pre-trigger history.
Tax reassessment forecast NY · Partial reset (capped growth)
- Current annual tax
- $9,216 · $768/mo
- Projected year-2 tax
- $9,216 · $768/mo
- Expected delta
- $0/yr ($0/mo · 0.0%)
ⓘ Screening estimate from a state-policy table — verify with the county assessor before closing.
Climate risk First Street
- Flood 1/10 Low FEMA zone X (unshaded) · 0% chance over 30 yrs
- Wildfire 3/10 Moderate
- Heat 5/10 Major 7 d/yr ≥98°F today · 15 d/yr by 30 yrs out
- Wind 4/10 Moderate 15% chance of damaging wind over 30 yrs
- Air quality 2/10 Low 2 unhealthy d/yr today · 2 by 30 yrs out
Nearby sold comps map
Loading sold comps map…
Walkable amenities ~0.75 mi
Loading nearby amenities…
Taxation est. · year 1
- Rental income
- $34,618
- − Mortgage interest
- −$14,004
- − Property taxes
- −$9,216
- − Insurance
- −$1,250
- − Repairs & maintenance
- −$2,769
- − Management
- −$2,769
- − Depreciation
- −$7,273
- Taxable loss
- −$2,663
- Est. tax savings @ 24.0%
- +$639
- After-tax cash flow
- $1,790/yr
For passive investors: Depreciation is non-cash, so a rental often shows a tax loss while cash-flowing — sheltering income. Rental losses are passive: they offset passive income freely, and up to $25,000/yr can offset ordinary (W-2) income if you actively participate and your MAGI is under $100k (phasing out to $0 by $150k); unused losses carry forward. On sale, claimed depreciation is recaptured at up to 25%, and gains may owe capital-gains tax (a 1031 exchange can defer both). Figures are a year-1 estimate at your 24.0% rate — not tax advice; consult a CPA.
Schools (NCES district)
- District
- Beacon City School District
- NCES district ID
- 3604140
- Math proficiency
- 56% ▬ 0.00%
- Reading proficiency
- 56% ▲ 1.00%
- Median HH income
- $68,602
- Composite
- 51.31/100
- National rank
- #3722
- State rank
- #304 of 755 in NY
Livability — Beacon
- Score
- 86/100
- State rank
- #20
- US rank
- #385
Category grades
Schools grade is shown separately in the Schools card above.
Census & demographics
- County
- Dutchess County · 188,048 people
- City population
- 19,566
- Metro
- Poughkeepsie-Newburgh-Middletown, NY
- Population (ZIP)
- 19,566
- Household income
- $92,461
- Rent vs Own
- Severe rent burden
- 815.0
Population outlook (Dutchess County) Hauer SSP2
- Today (2025)
- 291,768 people
- By 2030
- 287,131 · -1.6%
- By 2040
- 274,881 · -5.8%
- By 2050
- 259,971 · -10.9%
- By 2075
- 235,366 · -19.3%
- By 2100
- 208,786 · -28.4%
Race, ethnicity, and origin ACS 2023
- Neighborhood character
- Majority White (64%)
- Race & ethnicity
- White 64% Hispanic / Latino 19% Black 12% Two or more races 9% Asian 2%
- Hispanic origin (detail)
- Mexican 2% Puerto Rican 9% Dominican 1%
- Common ancestry
- Lithuanian 3% Romanian 2% Slovak 2%
- Foreign-born
- 10% · Canada, Jamaica, Vietnam
- Languages at home
- 84% English-only · Spanish 11% Other Indo-European 2%
Political lean MEDSL · Dutchess
- 2024 margin
- Lean D (+5.4) · D 52.7% · R 47.3%
- 2008→2024 swing
- -3.2pp toward R · 2008: 8.6pp · 2024: 5.4pp
- All cycles
- 2024: D+5.4 2020: D+9.6 2016: R+1.1 2012: D+6.6 2008: D+8.6
Not yet ingested
- Civics
- —
Market trends
- HPI YoY
- ▼ -174.01%
- Current HPI
- 403.174
- Rent YoY
- ▲ 9.07%
- Metro
- Poughkeepsie-Newburgh-Middletown, NY
- State GDP YoY
- ▲ 2.60%
- F500 in state
- 92
Industry mix (Fortune 500 HQ in NY)
| Industry | F500 HQs | Revenue |
|---|---|---|
| Financial Services | 10 | $950B |
|
||
| Consumer Goods | 9 | $162B |
|
||
| Insurance | 4 | $225B |
|
||
| Telecommunications | 2 | $144B |
|
||
| Pharmaceuticals | 2 | $112B |
|
||
| Media / Entertainment | 2 | $69B |
|
||
Price history
+61.3% since first listed2 events — show timeline
- 2026-06-07 Coming Soon $250,000 OneKey® MLS as Distributed by MLS Grid
- 2026-05-18 Sold (Public Records) $155,000 Public Records
Property tax history
+8.1%/yrLatest (2025): $9,216 · +10.3% YoY. Source: county tax records.
Cash-flow waterfall
monthlySold comps — $/sqft
last 12 mo · ≤1 miLoading sold comps…