 🔨 Auction
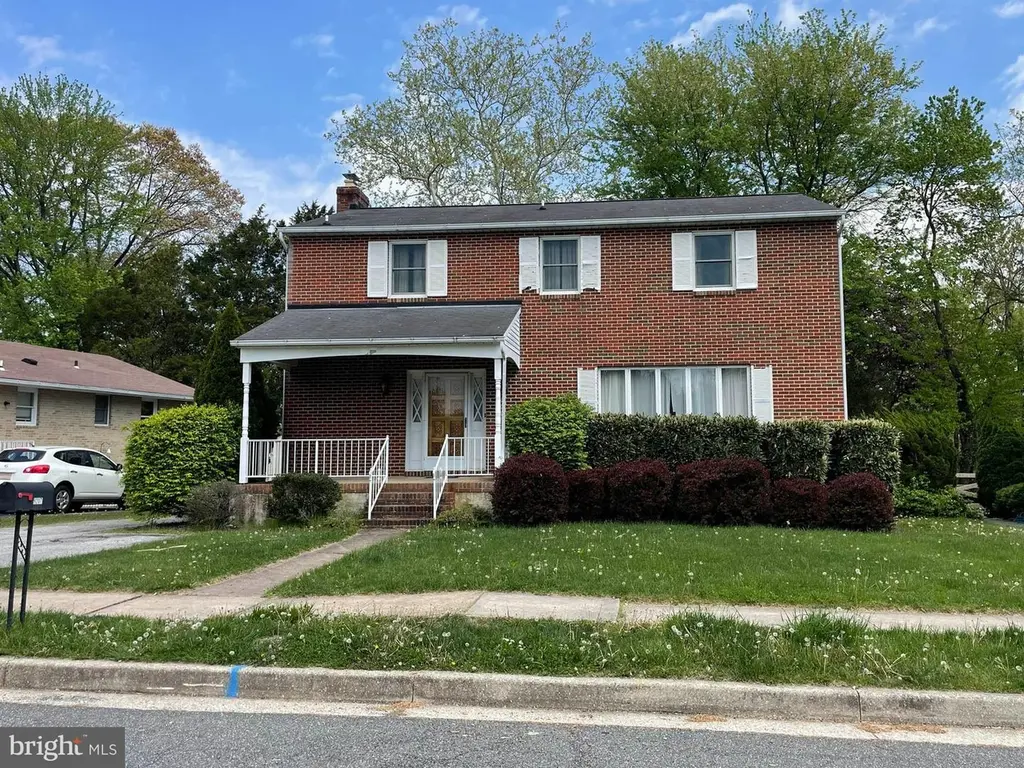
9207 Gardenia Rd · Perry Hall, MD
Flood risk 1/10 · Minimal
- FEMA flood zone
- X (unshaded)
- Chance of flooding over 30 yrs
- 0.0%
- Est. flood insurance / yr
- $473 – $860
Fire risk 1/10 · Minimal
- Est. fire insurance / yr
- $755 – $1,403
Heat risk 7/10 · Major
- Hot days now (above 105°F)
- 7 days/yr
- Hot days in 30 yrs
- 15 days/yr
Wind risk 6/10 · Moderate
- Chance of severe wind over 30 yrs
- 27.0%
Air-quality risk 4/10 · Minor
- Unhealthy air days now
- 5 days/yr
- Unhealthy air days in 30 yrs
- 7 days/yr
Risk factors via First Street. Map © Google.
Why this score? — see what drove the F grade
The composite is a weighted blend of 9 inputs, each scored 0–100. Each bar is that input's sub-score; the figure is the points it added to the 100-point composite (weight × sub-score).
- ARV discount +7.5/15.0
- Cash flow +6.1/30.0
- Livability +4.4/5.0
- Rent growth +3.8/5.0
- Condition / age +2.5/5.0
- Schools +2.3/10.0
- 1% rule +0.9/10.0
- DSCR +0.5/10.0
- Appreciation +0.0/10.0
$100,000
🖨 Deal sheet 📄 Offer letter ✓ Due diligence
Listing remarks
REAL ESTATE AUCTION ON SITE WEDNESDAY, MAY 20, 2026 AT 11:00 AM!! List price is opening bid only. A $25,000 deposit, payable by cashier’s check, will be required of the purchaser at time and place of sale. Court ordered auction - No pre-auction offers will be considered. The property is improved by a TWO STORY BRICK DETACHED HOME, built in 1974, containing 2,146 square feet of living area above grade, and 1,073 square feet of basement space, according to public tax records. Features include driveway and asphalt parking area, covered front and rear porches, wood windows, asphalt shingle roof and all brick exterior. Interior arranged as follows: living room, dining room, powder room, ki
Key facts
- Wood windows
- Asphalt shingle roof
- All brick exterior
Tags
Property features AI
Finance
- Other: Above-grade finished area and below-grade finished/unfinished areas recorded by assessor; Ground rent paid annually
Exterior
- Parking: Driveway
- Utilities: Public water; Public sewer; Electric cooling fuel; Natural gas for heating and hot water
- Home design: Detached structure; Brick construction; Asphalt shingle roof; Wood-frame windows; Fee simple ownership
- Construction: Brick construction; Other foundation; Detached design
- Exterior features: Porch(es)
Interior
- Kitchen: Wall oven and double oven; Dishwasher
- Bedrooms: Four bedrooms on the upper level (includes master bedroom)
- Flooring: Hardwood floors; Carpet
- Bathrooms: Two full bathrooms; Two half bathrooms (one on main level, one on lower level)
- Heating & cooling: Forced air heating (natural gas); Central air conditioning (electric); Natural gas hot water
- Interior features: Two fireplaces; Master bath; Partially finished basement with workshop, storage shelving and connecting stairway; Living room, dining room, family room, breakfast room
- Laundry & utility: Utility room; Sump pump
Neighborhood map
What this means for you Summary
Snapshot
- This is a 4-bed/2.5-bath single-family listed at $100k.
Deal economics
- At list price, monthly cash flow is $-881 ($-11k/yr) — negative.
- The deal already cash-flows at list — no discount required.
- Meets the 1% rule at list price ($3k rent vs $100k).
- Recommended offer: $98k (1.5% below list) — sets the bar for market timing.
Location & tenants
- Location reads 87/100 on livability (#8 in MD, #313 nationally) — a professional / high-income tenant draw. Strengths: employment A+, housing A+, health & safety A+; Watch: cost of living C-, crime D-.
- Baltimore County Public Schools (suburban): math 15% / reading 34% proficiency, ranked #11 of 24 in MD (top 46%) — low school quality limits family demand, transient renter base, plan for 1-2y turnover.
- Market conditions: Rents rising fast (+5.3%/yr); 132 active listings in the ZIP; 7 comparable units currently listed for rent nearby; rentals at typical pace (median 15d on market — plan ~3-4 weeks tenant-placement turnaround); solid renter incomes; 1,511 units permitted in Baltimore County in 2024 (643 in 5+ unit buildings).
- This rent runs 36% of the median local income ($95k/yr) — at the standard rent-burdened threshold; future hikes will face affordability resistance.
Forward outlook
- Local home prices are declining (-3.0%/yr); year-one equity from $3k of loan paydown is wiped out by about $14k of value loss. Plan a longer hold.
- Baltimore County population projected at +12% by 2050 — modest demand growth; plan on rents tracking national, not racing it.
Negotiation context
- It's been on market 26 days — a 2% lower offer ($98k) is reasonable based on typical stale-listing flexibility.
- Current owner paid $46k; list at $100k implies a 117% gain — meaningful room to come down on a strong offer.
Risks & watch-outs
- Watch-outs: property tax is 5.0% of price.
- Climate carrying-cost: major wind risk, 27% chance of damaging wind over 30y; extreme-heat days projected 7→15/yr by 2055 (HVAC capex compounding) — expect insurance premiums to compound above CPI over the hold.
Questions for the listing agent
- What do current leases actually rent for vs. the listed asking? Can we see a recent rent roll and the last 12 months of T-12 income?
- Built in 1974 — when were the roof, HVAC, electrical panel, plumbing, and water heater last replaced?
- Property tax is high relative to price — has the assessment been appealed recently, and will the sale trigger a re-assessment?
- Is there a deadline driving the sale (1031 exchange, divorce, estate, relocation)? That informs how much negotiation room exists.
- Schools are A-rated — typically a magnet for longer-tenancy family renters. What's the average tenant stay here, and is there a school-zone premium baked into asking?
- Crime grade is D in this area — have there been break-ins, vandalism, or insurance claims at this property in the last 3 years? What carrier currently insures it and at what premium?
- The area grade is low — what's the realistic commute time and amenity access for the typical tenant pool here? Any planned neighborhood developments (good or bad) we should know about?
- What's the average days-on-market for RENTAL listings here right now (not sales)? A rising rental-DOM trend means longer vacancies and softer asking-rent achievability than the comps imply.
- What's the recent tenant-quality profile in this submarket — average credit score on applications, eviction rate, late-payment / NSF rate, and stable-employment percentage? A property-management company in the area should have these aggregated.
- How much new for-sale + rental construction is in the pipeline within 1–3 miles? Heavy new supply typically softens prices + rents 12–24 months out; constrained supply supports both.
Investment metrics
- 1% rule
- 0.59% ✗
- Cap rate
- 4.08%
- Cash-on-cash
- -7.91%
- DSCR
- 0.65
- GRM
- 14.1
CMA / ARV
- ARV (median comp)
- $477,218
- List price
- $100,000
- Delta
- -79.05%
- Verdict
- UNDERPRICED
- Comps
- 20 within 1.0 mi
Show comp detail 12 sales within ~0.75 mi
| Address | Dist | Beds/Ba | Sqft | Sold | Price | $/sf | Match |
|---|---|---|---|---|---|---|---|
| 1 Dovefield Rd | 0.20mi | 4/3.5 | 2,698 (+2%) | 15mo | $565,000 | $209 | 71 |
| 9209 Ramblebrook Rd | 0.15mi | 4/3.5 | 2,816 (+6%) | 9mo | $515,000 | $183 | 71 |
| 4415 Fieldgreen Rd | 0.37mi | 4/3.0 | 2,520 (-5%) | 5mo | $485,000 | $192 | 69 |
| 9216 Carlisle Ave | 0.36mi | 4/3.0 | 2,578 (-3%) | 11mo | $462,500 | $179 | 68 |
| 4516 E Joppa Rd | 0.15mi | 3/1.0 (-1) | 2,400 (-9%) | 2mo | $285,000 | $119 | 64 |
| 4225 Chapel Rd | 0.66mi | 4/3.0 | 2,606 (-2%) | 9mo | $470,000 | $180 | 57 |
| 9228 Bowline Rd | 0.54mi | 4/2.5 | 2,364 (-11%) | 1mo | $446,000 | $189 | 56 |
| 9116 Kilbride | 0.46mi | 4/3.5 | 2,496 (-6%) | 14mo | $425,000 | $170 | 53 |
| 9414 Horn Ave | 0.38mi | 3/2.5 (-1) | 2,266 (-14%) | 4mo | $510,000 | $225 | 50 |
| 9109 Yvonne Ave | 0.50mi | 4/2.0 | 2,411 (-9%) | 13mo | $475,000 | $197 | 49 |
| 36 Robin Lynne Ct | 0.47mi | 4/3.5 | 2,844 (+8%) | 15mo | $530,000 | $186 | 49 |
| 5 Trumpet Ct | 0.61mi | 4/2.5 | 2,426 (-8%) | 18mo | $545,000 | $225 | 42 |
Match score weights: distance 35% · size 25% · config 20% · recency 20%. Top-matched comps best support the ARV.
Projected returns pro-forma
-3.0% appreciation · 5.34% rent growth · sell at horizon
- IRR
- -27.9%
- Equity multiple
- 0.05×
- Total profit
- $-126,716
- Equity at exit
- $71,155
- IRR
- -20.0%
- Equity multiple
- -0.15×
- Total profit
- $-153,582
- Equity at exit
- $41,261
Cash invested: $133,621 (down + closing). Projections, not guarantees.
Landlord ↔ Tenant lean methodology
- Overall (STATE)
- 27 Tenant-Leaning
- State Maryland
- 27 Tenant-Leaning · D+14
- County
- — inherits STATE
- City
- — inherits STATE
ZIP-level market 21236
- Rents YoY
- 5.3%
- Active inventory
- 132
- Price-to-rent
- 2.9×
Monthly cashflow live
- Estimated rent
- $2,826 high interval (Pro) →
- Mortgage (P&I)
- −$2,503
- Tax from tax record
- −$413 /mo · $4,953/yr
- Insurance
- −$199
- HOA
- −$0
- Vacancy / Maint / Mgmt
- −$594
- Net cashflow
- $-881
Break-even live
UW: 25.0% down · 7.5% · 30yr · 1.5% tax · 5.0% vac · 8.0% maint · 8.0% mgmt
Financing live
Cash to close
- Down payment
- $119,304
- Closing costs
- $14,317
- Reserves months
- —
- Total cash needed
- —
Loan-product check · same deal, 3 products live
Conventional
25% down · 7.5% · 30yr
- Down + closing
- —
- Monthly P&I
- —
- Monthly cashflow
- —
- DSCR
- —
- Eligible?
- —
Personal DTI + credit; lowest rate.
DSCR
20% down · 8.5% · 30yr
- Down + closing
- —
- Monthly P&I
- —
- Monthly cashflow
- —
- DSCR
- —
- Eligible?
- —
No personal income docs; deal must DSCR.
Hard money
10% down · 12.0% · 12mo
- Down + closing
- —
- Monthly P&I
- —
- Monthly cashflow
- —
- DSCR
- —
- Eligible?
- —
Short-term bridge; refi at stabilization.
Rent comps 7 comps
| Address | Beds | Baths | Sqft | Rent | $/sqft | DOM | Units | Dist |
|---|---|---|---|---|---|---|---|---|
| 23 Glasshouse Garth Nottingham, MD | 3.0 | 2.5 | 2032 | $2,800 | $1.38 | 23d | 1 | 0.24mi |
| 4117 Baker Ln Nottingham, MD | 4.0 | 4.0 | 3100 | $2,800 | $0.90 | 17d | 1 | 0.93mi |
| 5039 Strawbridge Ter Perry Hall, MD | 3.0 | 2.5 | 2422 | $900 | $0.37 | 11d | 1 | 1.20mi |
| 5077 Cameo Ter Unit 1546334P Perry Hall, MD | 3.0 | 2.0 | 2023 | $4,193 | $2.07 | 14d | 1 | 1.23mi |
| 23 Beloak Ct Nottingham, MD | 3.0 | 2.5 | 1760 | $2,350 | $1.34 | 5d | 1 | 1.25mi |
| 5109 Strawbridge Ter #5109 Perry Hall, MD | 3.0 | 2.5 | 2048 | $2,900 | $1.42 | 14d | 1 | 1.26mi |
| 9 Hurst Ct Nottingham, MD | 4.0 | 3.5 | 2000 | $2,600 | $1.30 | 23d | 1 | 1.49mi |
Listing history 3 events
-
2026-04-24$100,000 Active 1013-char remark
-
1988-12-27soldstatus $46,000
-
1974-12-11soldstatus $59,000
ⓘ Source: listings_history table (triggers on properties + properties_extension) + one-shot
backfill from property_details.listing_events for pre-trigger history.
Tax reassessment forecast MD · Partial reset (capped growth)
- Current annual tax
- $4,953 · $413/mo
- Projected year-2 tax
- $4,953 · $413/mo
- Expected delta
- $0/yr ($0/mo · 0.0%)
ⓘ Screening estimate from a state-policy table — verify with the county assessor before closing.
Climate risk First Street
- Flood 1/10 Low FEMA zone X (unshaded) · 0% chance over 30 yrs
- Wildfire 1/10 Low
- Heat 7/10 Severe 7 d/yr ≥105°F today · 15 d/yr by 30 yrs out
- Wind 6/10 Major 27% chance of damaging wind over 30 yrs
- Air quality 4/10 Moderate 5 unhealthy d/yr today · 7 by 30 yrs out
Nearby sold comps map
Loading sold comps map…
Walkable amenities ~0.75 mi
Loading nearby amenities…
Taxation est. · year 1
- Rental income
- $33,918
- − Mortgage interest
- −$26,732
- − Property taxes
- −$4,953
- − Insurance
- −$2,386
- − Repairs & maintenance
- −$2,713
- − Management
- −$2,713
- − Depreciation
- −$13,883
- Taxable loss
- −$19,462
- Est. tax savings @ 24.0%
- +$4,671
- After-tax cash flow
- $-5,904/yr
For passive investors: Depreciation is non-cash, so a rental often shows a tax loss while cash-flowing — sheltering income. Rental losses are passive: they offset passive income freely, and up to $25,000/yr can offset ordinary (W-2) income if you actively participate and your MAGI is under $100k (phasing out to $0 by $150k); unused losses carry forward. On sale, claimed depreciation is recaptured at up to 25%, and gains may owe capital-gains tax (a 1031 exchange can defer both). Figures are a year-1 estimate at your 24.0% rate — not tax advice; consult a CPA.
Schools (NCES district)
- District
- Baltimore County Public Schools
- NCES district ID
- 2400120
- Math proficiency
- 15% ▼ -16.00%
- Reading proficiency
- 34% ▼ -5.00%
- Median HH income
- $66,746
- Composite
- 23.17/100
- National rank
- #7948
- State rank
- #11 of 24 in MD
Livability — Perry Hall
- Score
- 87/100
- State rank
- #8
- US rank
- #313
Category grades
Schools grade is shown separately in the Schools card above.
Census & demographics
- Census place
- Perry Hall, MD
- County
- Baltimore County · 769,527 people
- City population
- 15,501
- Metro
- Baltimore-Columbia-Towson, MD
- Population (ZIP)
- 39,514
- Household income
- $95,149
- Rent vs Own
- Severe rent burden
- 1476.0
Population outlook (Baltimore County) Hauer SSP2
- Today (2025)
- 885,518 people
- By 2030
- 909,272 · +2.7%
- By 2040
- 951,547 · +7.5%
- By 2050
- 990,955 · +11.9%
- By 2075
- 1,086,411 · +22.7%
- By 2100
- 1,135,078 · +28.2%
Race, ethnicity, and origin ACS 2023
- Neighborhood character
- Diverse neighborhood (Simpson 0.63)
- Race & ethnicity
- White 56% Black 19% Asian 16% Hispanic / Latino 6% Two or more races 5%
- Hispanic origin (detail)
- Mexican 1% Puerto Rican 1%
- Common ancestry
- Romanian 5% Lithuanian 2% Italian 1%
- Foreign-born
- 17% · Canada, South Korea, Vietnam
- Languages at home
- 79% English-only · Other Indo-European 8% Spanish 3% Tagalog/Filipino 2%
Political lean MEDSL · Baltimore
- 2024 margin
- Strong D (+24.5) · D 61.0% · R 36.5% · Other 2.5%
- 2008→2024 swing
- +9.9pp toward D · 2008: 14.6pp · 2024: 24.5pp
- All cycles
- 2024: D+24.5 2020: D+27.0 2016: D+17.4 2012: D+16.4 2008: D+14.6
Not yet ingested
- Civics
- —
Market trends
- HPI YoY
- ▼ -268.43%
- Current HPI
- 244.9907
- Rent YoY
- ▲ 5.34%
- Metro
- Baltimore-Columbia-Towson, MD
- State GDP YoY
- ▲ 2.97%
- F500 in state
- 12
Industry mix (Fortune 500 HQ in MD)
| Industry | F500 HQs | Revenue |
|---|---|---|
| Aerospace / Defense | 1 | $71B |
|
||
| Utilities | 1 | $25B |
|
||
| Hotels | 1 | $24B |
|
||
| Consumer Goods | 1 | $7B |
|
||
| Real Estate | 1 | $6B |
|
||
| Chemicals | 1 | $2B |
|
||
Price history
+69.5% since first listed4 events — show timeline
- 2026-05-20 Pending — BRIGHT MLS
- 2026-04-24 Listed $100,000 BRIGHT MLS
- 1988-12-27 Sold (Public Records) $46,000 Public Records
- 1974-12-11 Sold (Public Records) $59,000 Public Records
Property tax history
+1.9%/yrLatest (2025): $4,953 · +0.0% YoY. Source: county tax records.
Cash-flow waterfall
monthlySold comps — $/sqft
last 12 mo · ≤1 miLoading sold comps…