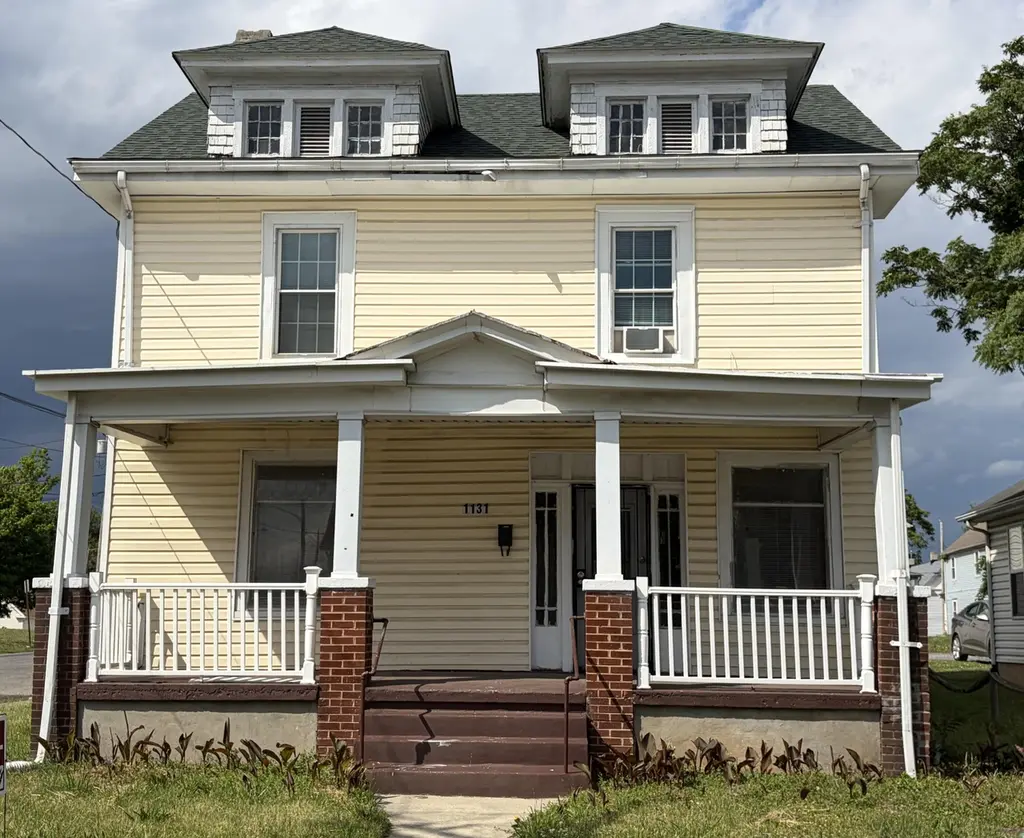
1131 Loudon Ave NW · Roanoke, VA
Flood risk 1/10 · Minimal
- FEMA flood zone
- X (unshaded)
- Chance of flooding over 30 yrs
- 0.0%
- Est. flood insurance / yr
- $507 – $1,088
Fire risk 1/10 · Minimal
- Est. fire insurance / yr
- $666 – $1,236
Heat risk 5/10 · Moderate
- Hot days now (above 101°F)
- 7 days/yr
- Hot days in 30 yrs
- 18 days/yr
Wind risk 2/10 · Minimal
- Chance of severe wind over 30 yrs
- 1.0%
Air-quality risk 1/10 · Minimal
- Unhealthy air days now
- 0 days/yr
- Unhealthy air days in 30 yrs
- 0 days/yr
Risk factors via First Street. Map © Google.
Why this score? — see what drove the D+ grade
The composite is a weighted blend of 9 inputs, each scored 0–100. Each bar is that input's sub-score; the figure is the points it added to the 100-point composite (weight × sub-score).
- Cash flow +19.5/30.0
- DSCR +6.2/10.0
- 1% rule +4.3/10.0
- Schools +4.1/10.0
- Rent growth +3.9/5.0
- Livability +3.7/5.0
- Condition / age +2.5/5.0
- ARV discount +1.2/15.0
- Appreciation +0.0/10.0
$180,000
🖨 Deal sheet 📄 Offer letter ✓ Due diligence
Listing remarks
Classic 4-square home on corner lot in the heart of Roanoke. This has a spacious interior with a wide stairway and generous sized bedrooms. It is move-in ready. Recent updates include a newer roof and a convenient rear entry laundry room located off the back entrance. Enjoy a covered front porch and rear off street parking. Perfect as a primary residence or a strong investment opportunity. Don't miss the added advantage of owner financing that can make homeownership or investing more attainable.
Key facts
- Covered front porch
- Newer roof
- Spacious interior
Tags
Property features AI
Exterior
- Parking: Off-street parking
- Home design: Residential property; Built in 1925
- Construction: Crawl space basement
- Exterior features: Front porch
Interior
- Bedrooms: 4 bedrooms
- Flooring: Laminate flooring; Vinyl flooring; Wood flooring
- Bathrooms: 1 full bathroom; 1 half bathroom
- Heating & cooling: Forced air gas heating; Has cooling
- Interior features: Wood doors; Storm windows; Storage
Neighborhood map
What this means for you Summary
Snapshot
- This is a 4-bed/1.0-bath single-family listed at $180k.
Deal economics
- At list price, monthly cash flow is $204 ($2k/yr) — positive.
- The deal already cash-flows at list — no discount required.
- To meet the 1% rule (rent ≥ 1% of price), the offer needs to be $167k (7.3% below list).
- Recommended offer: $167k (7.3% below list) — sets the bar for 1% rule.
- Cap rate 7.7% vs local median 4.2% in Roanoke — top-decile yield for the area; either an underpriced asset or a hidden risk that comps aren't pricing in. Stress-test before assuming the spread holds.
Location & tenants
- Location reads 73/100 on livability (#163 in VA) — a middle-class / working-renter tenant base. Strengths: cost of living A+, health & safety A+, housing A; Watch: amenities C-, employment D, crime F.
- Roanoke City Public School District (urban): math 40% / reading 58% proficiency, ranked #102 of 131 in VA (top 78%) — families likely to look elsewhere, expect single-tenant / working-renter base with shorter leases; 67% free/reduced lunch — lower-income household profile, screen leases tightly.
- Zoned schools: Highland Park Elementary (math 57% / reading 67%, grade B, #480 of 1,108 statewide, top 46%, 398 students, 100% FRL); James Madison Middle (math 41% / reading 68%, grade B-, #194 of 342 statewide, top 60%, 580 students, 96% FRL) — zoned schools average 98% FRL vs 67% district-wide (31 pts higher); higher-poverty schools than district average — tighter screening recommended.
- Market conditions: Rents rising fast (+5.7%/yr); 151 active listings in the ZIP; 13 comparable units currently listed for rent nearby; rentals lingering (median 44d on market — plan ~5-8 weeks vacancy on turnover, expect pricing pressure); 54% of comp listings sitting > 30 days — soft ceiling on asking rent; 113 units permitted in Roanoke city in 2024 (0 in 5+ unit buildings).
- This rent runs 42% of the median local income ($47k/yr) — at the standard rent-burdened threshold; future hikes will face affordability resistance.
Forward outlook
- Local home prices are declining (-3.0%/yr); year-one equity from $1k of loan paydown is wiped out by about $5k of value loss. Plan a longer hold.
- Roanoke County population projected at +11% by 2050 — modest demand growth; plan on rents tracking national, not racing it.
Negotiation context
- It's been on market 35 days — a 3% lower offer ($175k) is reasonable based on typical stale-listing flexibility.
- 5 sale attempts since 13y ago with the ask held roughly flat each time — persistent listings suggest the price (not the market) is what's stuck; bring a comps-based counter.
- Current owner paid $20k; list at $180k implies a 800% gain — meaningful room to come down on a strong offer.
Risks & watch-outs
- Watch-outs: built in 1925 — expect roof / HVAC / electrical / plumbing capex.
- Climate carrying-cost: extreme-heat days projected 7→18/yr by 2055 (HVAC capex compounding) — expect insurance premiums to compound above CPI over the hold.
Questions for the listing agent
- It's been on market 35 days. Have you received any prior offers? Is the seller open to a 7% concession, seller financing, or rate buy-down credit?
- Built in 1925 — when were the roof, HVAC, electrical panel, plumbing, and water heater last replaced?
- Is there a deadline driving the sale (1031 exchange, divorce, estate, relocation)? That informs how much negotiation room exists.
- Schools are A-rated — typically a magnet for longer-tenancy family renters. What's the average tenant stay here, and is there a school-zone premium baked into asking?
- Crime grade is F in this area — have there been break-ins, vandalism, or insurance claims at this property in the last 3 years? What carrier currently insures it and at what premium?
- The area grade is low — what's the realistic commute time and amenity access for the typical tenant pool here? Any planned neighborhood developments (good or bad) we should know about?
- What's the average days-on-market for RENTAL listings here right now (not sales)? A rising rental-DOM trend means longer vacancies and softer asking-rent achievability than the comps imply.
- What's the recent tenant-quality profile in this submarket — average credit score on applications, eviction rate, late-payment / NSF rate, and stable-employment percentage? A property-management company in the area should have these aggregated.
- How much new for-sale + rental construction is in the pipeline within 1–3 miles? Heavy new supply typically softens prices + rents 12–24 months out; constrained supply supports both.
Investment metrics
- 1% rule
- 0.93% ✗
- Cap rate
- 7.65%
- Cash-on-cash
- 4.86%
- DSCR
- 1.22
- GRM
- 9.0
CMA / ARV
- ARV (median comp)
- $157,983
- List price
- $180,000
- Delta
- 13.94%
- Verdict
- OVERPRICED
- Comps
- 20 within 1.0 mi
Show comp detail 12 sales within ~0.75 mi
| Address | Dist | Beds/Ba | Sqft | Sold | Price | $/sf | Match |
|---|---|---|---|---|---|---|---|
| 1229 Loudon Ave NW | 0.09mi | 4/2.0 | 1,790 (+8%) | 2mo | $180,000 | $101 | 76 |
| 1230 Orange Ave NW | 0.31mi | 4/2.0 | 1,736 (+5%) | 2mo | $110,000 | $63 | 72 |
| 806 Fairfax Ave NW | 0.33mi | 4/2.0 | 1,694 (+2%) | 10mo | $210,000 | $124 | 68 |
| 711 Mcdowell Ave NW | 0.49mi | 4/2.0 | 1,600 (-3%) | 1mo | $121,000 | $76 | 67 |
| 1506 Rorer Ave SW | 0.58mi | 4/1.5 | 1,660 (+0%) | 7mo | $140,000 | $84 | 64 |
| 515 Patton Ave NW | 0.56mi | 3/1.0 (-1) | 1,602 (-3%) | 5mo | $68,500 | $43 | 60 |
| 1115 Orange Ave NW | 0.33mi | 3/1.5 (-1) | 1,487 (-10%) | 6mo | $100,835 | $68 | 56 |
| 821 12th St NW | 0.37mi | 3/1.0 (-1) | 1,508 (-9%) | 9mo | $85,500 | $57 | 56 |
| 1721 Hanover Ave NW | 0.62mi | 4/1.0 | 1,785 (+8%) | 10mo | $179,500 | $101 | 49 |
| 1211 Hanover Ave NW | 0.39mi | 3/2.0 (-1) | 1,461 (-12%) | 8mo | $67,000 | $46 | 47 |
| 1632 Carroll Ave NW | 0.69mi | 4/2.0 | 1,812 (+10%) | 6mo | $215,000 | $119 | 43 |
| 1218 Grayson Ave NW | 0.62mi | 3/1.0 (-1) | 1,414 (-14%) | 10mo | $172,620 | $122 | 34 |
Match score weights: distance 35% · size 25% · config 20% · recency 20%. Top-matched comps best support the ARV.
Projected returns pro-forma
-3.0% appreciation · 5.71% rent growth · sell at horizon
- IRR
- -6.0%
- Equity multiple
- 0.77×
- Total profit
- $-11,538
- Equity at exit
- $26,839
- IRR
- 6.4%
- Equity multiple
- 1.53×
- Total profit
- $26,766
- Equity at exit
- $15,563
Cash invested: $50,400 (down + closing). Projections, not guarantees.
Landlord ↔ Tenant lean methodology
- Overall (STATE)
- 55 Moderately Landlord-Leaning
- State Virginia
- 55 Moderately Landlord-Leaning · D+2
- County
- — inherits STATE
- City
- — inherits STATE
ZIP-level market 24017
- Home prices YoY
- -28.3%
- Rents YoY
- 5.7%
- Active inventory
- 151
- Price-to-rent
- 9.0×
Monthly cashflow live
- Estimated rent
- $1,669 high interval (Pro) →
- Mortgage (P&I)
- −$944
- Tax from tax record
- −$96 /mo · $1,148/yr
- Insurance
- −$75
- HOA
- −$0
- Vacancy / Maint / Mgmt
- −$351
- Net cashflow
- $204
Break-even live
UW: 25.0% down · 7.5% · 30yr · 1.5% tax · 5.0% vac · 8.0% maint · 8.0% mgmt
Financing live
Cash to close
- Down payment
- $45,000
- Closing costs
- $5,400
- Reserves months
- —
- Total cash needed
- —
Loan-product check · same deal, 3 products live
Conventional
25% down · 7.5% · 30yr
- Down + closing
- —
- Monthly P&I
- —
- Monthly cashflow
- —
- DSCR
- —
- Eligible?
- —
Personal DTI + credit; lowest rate.
DSCR
20% down · 8.5% · 30yr
- Down + closing
- —
- Monthly P&I
- —
- Monthly cashflow
- —
- DSCR
- —
- Eligible?
- —
No personal income docs; deal must DSCR.
Hard money
10% down · 12.0% · 12mo
- Down + closing
- —
- Monthly P&I
- —
- Monthly cashflow
- —
- DSCR
- —
- Eligible?
- —
Short-term bridge; refi at stabilization.
Rent comps 13 comps
| Address | Beds | Baths | Sqft | Rent | $/sqft | DOM | Units | Dist |
|---|---|---|---|---|---|---|---|---|
| 821 12th St NW Roanoke, VA | 3.0 | 2.0 | 1508 | $1,625 | $1.08 | 43d | 1 | 0.39mi |
| 1017 Ferdinand Ave SW Roanoke, VA | 4.0 | 2.5 | 2248 | $1,795 | $0.80 | 43d | 1 | 0.65mi |
| 333 Harrison Ave NW Roanoke, VA | 3.0 | 2.0 | 1186 | $1,123 | $0.95 | 21d | 1 | 0.67mi |
| 401 Rutherford Ave NW Roanoke, VA | 3.0 | 1.0 | 1064 | $1,450 | $1.36 | 43d | 1 | 0.68mi |
| 1115 Grayson Ave NW Roanoke, VA | 4.0 | 2.0 | 1094 | $2,300 | $2.10 | 43d | 1 | 0.68mi |
| 1609 Chapman Ave SW Unit B Roanoke, VA | 4.0 | 1.0 | 1400 | $1,545 | $1.10 | 21d | 1 | 0.73mi |
| 1630 Patterson Ave SW Unit B Roanoke, VA | 3.0 | 1.0 | 1200 | $1,395 | $1.16 | 43d | 1 | 0.74mi |
| 1533 Rugby Blvd NW Roanoke, VA | 3.0 | 1.0 | 1500 | $1,475 | $0.98 | 43d | 1 | 0.83mi |
| 1531 Syracuse Ave NW Roanoke, VA | 3.0 | 1.0 | 1488 | $1,675 | $1.13 | 43d | 1 | 0.88mi |
| 1515 Dunbar St NW Roanoke, VA | 3.0 | 2.0 | 1058 | $1,623 | $1.53 | 13d | 1 | 1.11mi |
| 911 Lafayette Blvd NW Roanoke, VA | 5.0 | 1.0 | 2030 | $1,416 | $0.70 | 21d | 1 | 1.26mi |
| 2608 Florida Ave NW Roanoke, VA | 3.0 | 1.0 | 1394 | $1,600 | $1.15 | 21d | 1 | 1.43mi |
| 733 29th St NW Roanoke, VA | 2.0–3.0 | 2.0 | 1022 | $1,625 | $1.59 | 13d | 4 | 1.44mi |
Listing history 24 events
-
2026-06-18days on market $180,000 Active 35 DOM
-
2026-06-17days on market $180,000 Active 34 DOM
-
2026-06-16days on market $180,000 Active 33 DOM
-
2026-06-15days on market $180,000 Active 32 DOM
-
2026-06-14days on market $180,000 Active 30 DOM
-
2026-06-13days on market $180,000 Active 29 DOM
-
2026-06-10days on market $180,000 Active 27 DOM
-
2026-06-09days on market $180,000 Active 26 DOM
-
2026-06-08days on market $180,000 Active 25 DOM
-
2026-06-05days on market $180,000 Active 21 DOM
-
2026-06-03days on market $180,000 Active 20 DOM
-
2026-06-02days on market $180,000 Active 19 DOM
-
2026-06-01days on market $180,000 Active 18 DOM
-
2026-05-31days on market $180,000 Active 17 DOM
-
2026-05-30days on market $180,000 Active 16 DOM
-
2026-05-14$180,000 Active 500-char remark
-
2026-05-04historical $1,900
-
2026-05-03historical
-
2025-12-06$1,900
-
2025-11-09$180,000 Active
-
2020-08-01historical
-
2020-06-30$179,950
-
2013-09-05soldstatus $20,000
-
2013-06-14$24,500
ⓘ Source: listings_history table (triggers on properties + properties_extension) + one-shot
backfill from property_details.listing_events for pre-trigger history.
Tax reassessment forecast VA · Resets to sale price
- Current annual tax
- $1,148 · $96/mo
- Projected year-2 tax
- $1,476 · $123/mo
- Expected delta
- +$328/yr (+$27/mo · 28.5%)
ⓘ Screening estimate from a state-policy table — verify with the county assessor before closing.
Climate risk First Street
- Flood 1/10 Low FEMA zone X (unshaded) · 0% chance over 30 yrs
- Wildfire 1/10 Low
- Heat 5/10 Major 7 d/yr ≥101°F today · 18 d/yr by 30 yrs out
- Wind 2/10 Low 100% chance of damaging wind over 30 yrs
- Air quality 1/10 Low 0 unhealthy d/yr today · 0 by 30 yrs out
Nearby sold comps map
Loading sold comps map…
Walkable amenities ~0.75 mi
Loading nearby amenities…
Taxation est. · year 1
- Rental income
- $20,034
- − Mortgage interest
- −$10,083
- − Property taxes
- −$1,148
- − Insurance
- −$900
- − Repairs & maintenance
- −$1,603
- − Management
- −$1,603
- − Depreciation
- −$5,236
- Taxable loss
- −$539
- Est. tax savings @ 24.0%
- +$129
- After-tax cash flow
- $2,580/yr
For passive investors: Depreciation is non-cash, so a rental often shows a tax loss while cash-flowing — sheltering income. Rental losses are passive: they offset passive income freely, and up to $25,000/yr can offset ordinary (W-2) income if you actively participate and your MAGI is under $100k (phasing out to $0 by $150k); unused losses carry forward. On sale, claimed depreciation is recaptured at up to 25%, and gains may owe capital-gains tax (a 1031 exchange can defer both). Figures are a year-1 estimate at your 24.0% rate — not tax advice; consult a CPA.
Schools (NCES district)
- District
- Roanoke City Public School District
- NCES district ID
- 5103300
- Math proficiency
- 40% ▼ -38.00%
- Reading proficiency
- 58% ▼ -12.00%
- Median HH income
- $38,592
- Composite
- 40.8/100
- National rank
- #3639
- State rank
- #102 of 131 in VA
Livability — Roanoke
- Score
- 73/100
- State rank
- #163
- US rank
- #5055
Category grades
Schools grade is shown separately in the Schools card above.
Census & demographics
- Census place
- Roanoke, VA
- County
- Roanoke City · 101,625 people
- City population
- 168,930
- Metro
- Roanoke, VA
- Population (ZIP)
- 23,678
- Household income
- $47,360
- Rent vs Own
- Severe rent burden
- 913.0
Population outlook (Roanoke County) Hauer SSP2
- Today (2025)
- 106,094 people
- By 2030
- 108,927 · +2.7%
- By 2040
- 114,104 · +7.5%
- By 2050
- 118,032 · +11.3%
- By 2075
- 123,363 · +16.3%
- By 2100
- 116,827 · +10.1%
Race, ethnicity, and origin ACS 2023
- Neighborhood character
- Diverse neighborhood (Simpson 0.58)
- Race & ethnicity
- Black 59% White 25% Hispanic / Latino 9% Asian 4% Two or more races 4%
- Hispanic origin (detail)
- Mexican 2% Cuban 1%
- Common ancestry
- Slovak 1% Romanian 1% Lithuanian 1%
- Foreign-born
- 9% · Canada, China, Vietnam
- Languages at home
- 87% English-only · Spanish 8% Other Indo-European 3% German/W. Germanic 1%
Political lean MEDSL · Roanoke
- 2024 margin
- Strong D (+23.6) · D 61.1% · R 37.5% · Other 1.4%
- 2008→2024 swing
- +0.2pp no change · 2008: 23.4pp · 2024: 23.6pp
- All cycles
- 2024: D+23.6 2020: D+25.8 2016: D+17.6 2012: D+21.5 2008: D+23.4
Not yet ingested
- Civics
- —
Market trends
- HPI YoY
- ▼ -78.29%
- Current HPI
- 198.5991
- Rent YoY
- ▲ 5.71%
- Metro
- Roanoke, VA
- State GDP YoY
- ▲ 2.40%
- F500 in state
- 50
Industry mix (Fortune 500 HQ in VA)
| Industry | F500 HQs | Revenue |
|---|---|---|
| Aerospace / Defense | 4 | $236B |
|
||
| Technology / Defense | 3 | $32B |
|
||
| Financial Services | 2 | $176B |
|
||
| Utilities | 2 | $27B |
|
||
| Insurance | 2 | $25B |
|
||
| Technology | 2 | $15B |
|
||
Price history
+634.7% since first listed9 events — show timeline
- 2026-05-14 Listed $180,000 MLSRV
- 2026-05-04 Rental Removed $1,900 MLSRV
- 2026-05-03 Listing Removed — MLSRV
- 2025-12-06 Listed for Rent $1,900 MLSRV
- 2025-11-09 Listed $180,000 MLSRV
- 2020-08-01 Listing Removed — MLSRV
- 2020-06-30 Listed $179,950 MLSRV
- 2013-09-05 Sold (MLS) $20,000 MLSRV
- 2013-06-14 Listed $24,500 MLSRV
Property tax history
+12.1%/yrLatest (2025): $1,148 · +18.5% YoY. Source: county tax records.
Cash-flow waterfall
monthlySold comps — $/sqft
last 12 mo · ≤1 miLoading sold comps…