 Multi-family
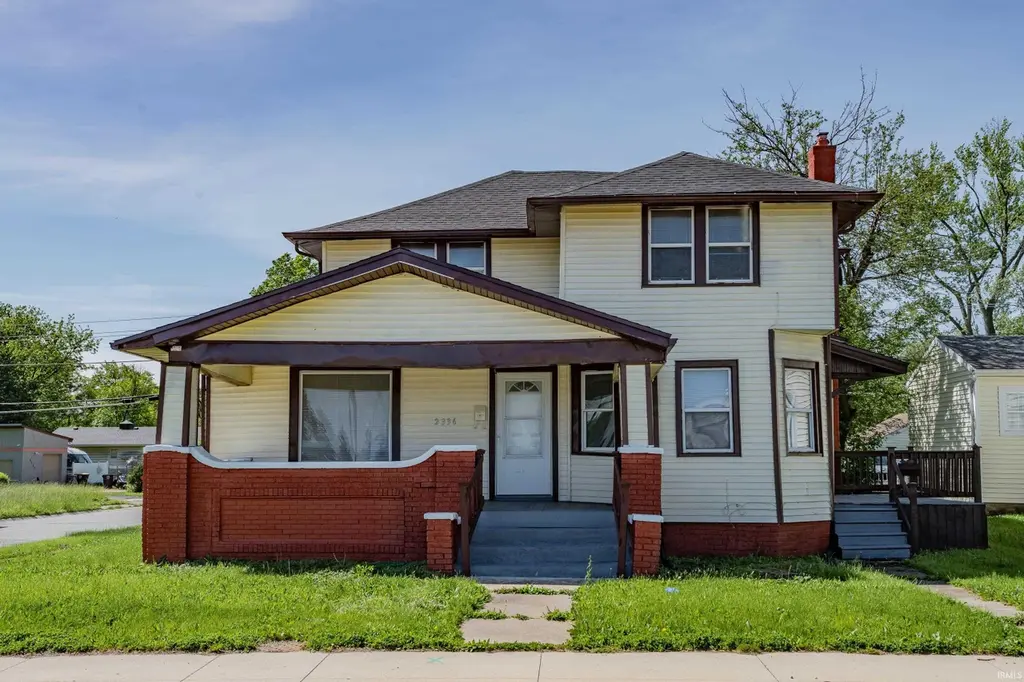
2336 E Pontiac St · Fort Wayne, IN
Flood risk 1/10 · Minimal
- FEMA flood zone
- X (unshaded)
- Chance of flooding over 30 yrs
- 0.0%
- Est. flood insurance / yr
- $473 – $860
Fire risk 1/10 · Minimal
- Est. fire insurance / yr
- $717 – $1,331
Heat risk 3/10 · Minor
- Hot days now (above 100°F)
- 7 days/yr
- Hot days in 30 yrs
- 17 days/yr
Wind risk 2/10 · Minimal
- Chance of severe wind over 30 yrs
- —
Air-quality risk 3/10 · Minor
- Unhealthy air days now
- 2 days/yr
- Unhealthy air days in 30 yrs
- 3 days/yr
Risk factors via First Street. Map © Google.
Why this score? — see what drove the C grade
The composite is a weighted blend of 9 inputs, each scored 0–100. Each bar is that input's sub-score; the figure is the points it added to the 100-point composite (weight × sub-score).
- Cash flow +19.4/30.0
- Appreciation +10.0/10.0
- ARV discount +7.5/15.0
- DSCR +6.1/10.0
- 1% rule +5.1/10.0
- Livability +4.2/5.0
- Rent growth +2.5/5.0
- Condition / age +2.5/5.0
- Schools +2.2/10.0
$230,000
🖨 Deal sheet (PDF) 📄 Offer letter ✓ Due diligence
Multi-family units
County records classify this as Multi-Family (2-4 Unit). Listing-text estimate: 1 unit. estimate disagrees with records
Listing remarks
Duplex Two-Story Home with Brand New Roof (May 2026)! This versatile property features two separate living units, making it a great opportunity for investors, owner-occupants, or multi-generational families seeking both togetherness and privacy. The main unit offers 4 bedrooms and 2 full bathrooms, while the second unit includes 1 bedroom and 1 full bathroom. Each unit has its own kitchen, furnace, AC unit, gas water heater (2012 & 2017), and separate gas and electric meters. Both kitchens come equipped with new refrigerators and stoves. The home features a covered front porch, a large back deck, and an additional private deck for the second unit. The units are connected through the
Key facts
- Covered front porch
- Large back deck
- Private deck
Tags
Property features AI
Exterior
- Parking: Off-street parking
- Utilities: Public water; Public sewer
- Home design: Single-family residential site-built home; 2-story
- Construction: Vinyl siding; Above-grade finished area approximately 2,500; Full basement (includes crawl space)
- Exterior features: Level lot; Lot dimensions approximately 150 x 55; Lot size about 0.19 acres
Interior
- Kitchen: Kitchen equipped with refrigerator and range (electric and gas)
- Bedrooms: Total of 8 rooms
- Bathrooms: 3 full bathrooms; 1 main-level bathroom
- Heating & cooling: Central air conditioning; Natural gas forced-air heating
- Interior features: Refrigerator, Electric Range, Gas Range; Has basement (full basement and crawl space)
- Laundry & utility: Laundry located in the basement
Neighborhood map
What this means for you Summary
Snapshot
- This is a 5-bed/2.0-bath multifamily listed at $230k.
Deal economics
- At list price, monthly cash flow is $255 ($3k/yr) — positive.
- The deal already cash-flows at list — no discount required.
- Meets the 1% rule at list price ($2k rent vs $230k).
- Recommended offer: $227k (1.5% below list) — sets the bar for market timing.
- Cap rate 7.6% vs local median 4.8% in Fort Wayne — top-decile yield for the area; either an underpriced asset or a hidden risk that comps aren't pricing in. Stress-test before assuming the spread holds.
Location & tenants
- Location reads 84/100 on livability (#6 in IN, #676 nationally) — a professional / high-income tenant draw. Strengths: amenities A+, commute A+, cost of living A+; Watch: crime C-, employment D+.
- Fort Wayne Community Schools (urban): math 22% / reading 29% proficiency, ranked #263 of 301 in IN (top 87%) — low school quality limits family demand, transient renter base, plan for 1-2y turnover; 60% free/reduced lunch — lower-income household profile, screen leases tightly.
- Zoned schools: J Wilbur Haley Elementary School (math 19% / reading 20%, grade F, #814 of 994 statewide, top 83%, 568 students, 65% FRL); Lane Middle School (math 9% / reading 20%, grade F, #300 of 330 statewide, top 91%, 710 students, 74% FRL); South Side High School (math 12% / reading 39%, grade F, #322 of 369 statewide, top 87%, 1,423 students, 73% FRL).
- Market conditions: 52 active listings in the ZIP; 3 comparable units currently listed for rent nearby; rentals lingering (median 45d on market — plan ~5-8 weeks vacancy on turnover, expect pricing pressure); 100% of comp listings sitting > 30 days — soft ceiling on asking rent; lower-income renter base — watch delinquency; 1,861 units permitted in Allen County in 2024 (576 in 5+ unit buildings).
- At $2,329/mo this rent would consume 81% of the median local household income ($34k/yr) (locally 660% of renters already pay >50% of income on rent) — very limited rent-growth headroom before tenants either downsize or default.
Forward outlook
- In year one you build about $25k of equity ($2k loan paydown + $23k appreciation (10.0% local appreciation)).
- Allen County population projected at +10% by 2050 — modest demand growth; plan on rents tracking national, not racing it.
- At projected returns (10.0% appreciation + 3.0% rent growth), your $64k cash investment doubles in ~3 years — after that, you're playing with house money.
- By year 2, paydown + projected appreciation supports a ~$40k cash-out refi (75% LTV) — recoverable capital for the next deal without selling this one.
Negotiation context
- It's been on market 26 days — a 2% lower offer ($227k) is reasonable based on typical stale-listing flexibility.
Risks & watch-outs
- Watch-outs: built in 1900 — expect roof / HVAC / electrical / plumbing capex.
Questions for the listing agent
- Built in 1900 — when were the roof, HVAC, electrical panel, plumbing, and water heater last replaced?
- Is there a deadline driving the sale (1031 exchange, divorce, estate, relocation)? That informs how much negotiation room exists.
- Schools are D-rated, which usually means shorter tenancies and higher turnover. Who's the typical renter profile here, and what's been the actual vacancy rate?
- What's the average days-on-market for RENTAL listings here right now (not sales)? A rising rental-DOM trend means longer vacancies and softer asking-rent achievability than the comps imply.
- What's the recent tenant-quality profile in this submarket — average credit score on applications, eviction rate, late-payment / NSF rate, and stable-employment percentage? A property-management company in the area should have these aggregated.
- How much new apartment / multifamily construction is in the pipeline within 1–3 miles? Heavy new supply (>2% of stock underway) typically softens rents 12–24 months out; light construction supports rent growth.
Investment metrics
- 1% rule
- 1.01% ✓
- Cap rate
- 7.63%
- Cash-on-cash
- 4.76%
- DSCR
- 1.21
- GRM
- 8.2
CMA / ARV
No comps found within radius.
Projected returns pro-forma
10.0% appreciation · 3.0% rent growth · sell at horizon
- IRR
- 27.7%
- Equity multiple
- 3.20×
- Total profit
- $141,562
- Equity at exit
- $207,202
- IRR
- 24.2%
- Equity multiple
- 7.28×
- Total profit
- $404,150
- Equity at exit
- $446,839
Cash invested: $64,400 (down + closing). Projections, not guarantees.
Landlord ↔ Tenant lean methodology
- Overall (STATE)
- 90 Strongly Landlord-Friendly
- State Indiana
- 90 Strongly Landlord-Friendly · R+11
- County
- — inherits STATE
- City
- — inherits STATE
ZIP-level market 46803
- Active inventory
- 52
- Price-to-rent
- 14.4×
Monthly cashflow live
- Estimated rent
- $2,329 high interval (Pro) →
- Mortgage (P&I)
- −$1,206
- Tax from tax record
- −$283 /mo · $3,390/yr
- Insurance
- −$96
- HOA
- −$0
- Vacancy / Maint / Mgmt
- −$489
- Net cashflow
- $255
Break-even live
Sensitivity live
| Price | -10% $386 | -5% $320 | +0% $255 | +5% $190 | +10% $125 |
|---|---|---|---|---|---|
| Rent | -10% $71 | -5% $163 | +0% $255 | +5% $347 | +10% $439 |
| Rate | -1.0pp $371 | -0.5pp $314 | base $255 | +0.5pp $196 | +1.0pp $135 |
2-unit breakdown (identical units grouped — click to expand)
| Units | Beds | Baths | Est. rent |
|---|---|---|---|
| 1× unit | 4 | 2 | $1,335 |
| 1× unit | 1 | 1 | $994 |
| Total (2 units) | $2,329 | ||
UW: 25.0% down · 7.5% · 30yr · 1.5% tax · 5.0% vac · 8.0% maint · 8.0% mgmt
Financing live
Cash to close
- Down payment
- $57,500
- Closing costs
- $6,900
- Reserves months
- —
- Total cash needed
- —
Loan-product check · same deal, 3 products live
Conventional
25% down · 7.5% · 30yr
- Down + closing
- —
- Monthly P&I
- —
- Monthly cashflow
- —
- DSCR
- —
- Eligible?
- —
Personal DTI + credit; lowest rate.
DSCR
20% down · 8.5% · 30yr
- Down + closing
- —
- Monthly P&I
- —
- Monthly cashflow
- —
- DSCR
- —
- Eligible?
- —
No personal income docs; deal must DSCR.
Hard money
10% down · 12.0% · 12mo
- Down + closing
- —
- Monthly P&I
- —
- Monthly cashflow
- —
- DSCR
- —
- Eligible?
- —
Short-term bridge; refi at stabilization.
Rent comps 3 comps
| Address | Beds | Baths | Sqft | Rent | $/sqft | DOM | Units | Dist |
|---|---|---|---|---|---|---|---|---|
| 1501 E Lewis St Fort Wayne, IN | 4.0 | 1.0 | 2000 | $1,450 | $0.72 | 44d | 1 | 1.15mi |
| 3702 Trace Cir Fort Wayne, IN | 2.0–4.0 | 2.0 | 1571 | $2,184 | $1.39 | 44d | 6 | 1.21mi |
| 2530 Lafayette St Fort Wayne, IN | 4.0 | 1.0 | 1816 | $1,500 | $0.83 | 44d | 1 | 1.38mi |
Listing history 15 events
-
2026-06-18days on market $230,000 Active 26 DOM
-
2026-06-17days on market $230,000 Active 25 DOM
-
2026-06-16days on market $230,000 Active 24 DOM
-
2026-06-15days on market $230,000 Active 23 DOM
-
2026-06-14days on market $230,000 Active 21 DOM
-
2026-06-10days on market $230,000 Active 18 DOM
-
2026-06-09days on market $230,000 Active 17 DOM
-
2026-06-08days on market $230,000 Active 16 DOM
-
2026-06-07days on market $230,000 Active 15 DOM
-
2026-06-03days on market $230,000 Active 11 DOM
-
2026-06-02days on market $230,000 Active 10 DOM
-
2026-06-01days on market $230,000 Active 9 DOM
-
2026-05-31days on market $230,000 Active 8 DOM
-
2026-05-30days on market $230,000 Active 7 DOM
-
2026-05-23$230,000 Active
ⓘ Source: listings_history table (triggers on properties + properties_extension) + one-shot
backfill from property_details.listing_events for pre-trigger history.
Tax reassessment forecast IN · Partial reset (capped growth)
- Current annual tax
- $3,390 · $283/mo
- Projected year-2 tax
- $3,390 · $283/mo
- Expected delta
- $0/yr ($0/mo · 0.0%)
ⓘ Screening estimate from a state-policy table — verify with the county assessor before closing.
Climate risk First Street
- Flood 1/10 Low FEMA zone X (unshaded) · 0% chance over 30 yrs
- Wildfire 1/10 Low
- Heat 3/10 Moderate 7 d/yr ≥100°F today · 17 d/yr by 30 yrs out
- Wind 2/10 Low
- Air quality 3/10 Moderate 2 unhealthy d/yr today · 3 by 30 yrs out
Nearby sold comps map
Loading sold comps map…
Walkable amenities ~0.75 mi
Loading nearby amenities…
Taxation est. · year 1
- Rental income
- $27,948
- − Mortgage interest
- −$12,884
- − Property taxes
- −$3,390
- − Insurance
- −$1,150
- − Repairs & maintenance
- −$2,236
- − Management
- −$2,236
- − Depreciation
- −$6,691
- Taxable loss
- −$639
- Est. tax savings @ 24.0%
- +$153
- After-tax cash flow
- $3,218/yr
For passive investors: Depreciation is non-cash, so a rental often shows a tax loss while cash-flowing — sheltering income. Rental losses are passive: they offset passive income freely, and up to $25,000/yr can offset ordinary (W-2) income if you actively participate and your MAGI is under $100k (phasing out to $0 by $150k); unused losses carry forward. On sale, claimed depreciation is recaptured at up to 25%, and gains may owe capital-gains tax (a 1031 exchange can defer both). Figures are a year-1 estimate at your 24.0% rate — not tax advice; consult a CPA.
Schools (NCES district)
- District
- Fort Wayne Community Schools
- NCES district ID
- 1803630
- Math proficiency
- 22% ▼ -11.00%
- Reading proficiency
- 29% ▼ -7.00%
- Median HH income
- $41,951
- Composite
- 21.68/100
- National rank
- #8275
- State rank
- #263 of 301 in IN
Livability — Fort Wayne
- Score
- 84/100
- State rank
- #6
- US rank
- #676
Category grades
Schools grade is shown separately in the Schools card above.
Census & demographics
- Census place
- Fort Wayne, IN
- County
- Allen County · 326,813 people
- City population
- 326,813
- Metro
- Fort Wayne, IN
- Population (ZIP)
- 10,994
- Household income
- $34,381
- Rent vs Own
- Severe rent burden
- 660.0
Population outlook (Allen County) Hauer SSP2
- Today (2025)
- 394,020 people
- By 2030
- 405,128 · +2.8%
- By 2040
- 423,476 · +7.5%
- By 2050
- 435,137 · +10.4%
- By 2075
- 450,293 · +14.3%
- By 2100
- 424,101 · +7.6%
Race, ethnicity, and origin ACS 2023
- Neighborhood character
- Diverse neighborhood (Simpson 0.69)
- Race & ethnicity
- Black 42% White 27% Hispanic / Latino 24% Two or more races 10% Native American 2% Asian 1%
- Hispanic origin (detail)
- Mexican 17% Puerto Rican 1%
- Common ancestry
- Lithuanian 1% Iranian 1% Serbian 1%
- Foreign-born
- 11% · Canada, Philippines
- Languages at home
- 81% English-only · Spanish 16% Other Asian/Pacific 1% French/Haitian/Cajun 1%
Political lean MEDSL · Allen
- 2024 margin
- R (+12.5) · D 42.9% · R 55.4% · Other 1.7%
- 2008→2024 swing
- -8.1pp toward R · 2008: -4.3pp · 2024: -12.5pp
- All cycles
- 2024: R+12.5 2020: R+11.2 2016: R+19.6 2012: R+16.8 2008: R+4.3
Not yet ingested
- Civics
- —
Market trends
- HPI YoY
- ▲ 107.58%
- Current HPI
- 404.7976
- Rent YoY
- —
- Metro
- Fort Wayne, IN
- State GDP YoY
- ▲ 2.90%
- F500 in state
- 18
Industry mix (Fortune 500 HQ in IN)
| Industry | F500 HQs | Revenue |
|---|---|---|
| Industrial Machinery | 2 | $37B |
|
||
| Healthcare | 1 | $177B |
|
||
| Pharmaceuticals | 1 | $45B |
|
||
| Metals / Steel | 1 | $18B |
|
||
| Agriculture | 1 | $17B |
|
||
| Packaging | 1 | $12B |
|
||
Price history
1 event — show timeline
- 2026-05-23 Listed $230,000 IRMLS
Property tax history
+21.3%/yrLatest (2024): $3,390 · +9.1% YoY. Source: county tax records.
Cash-flow waterfall
monthlySold comps — $/sqft
last 12 mo · ≤1 miLoading sold comps…