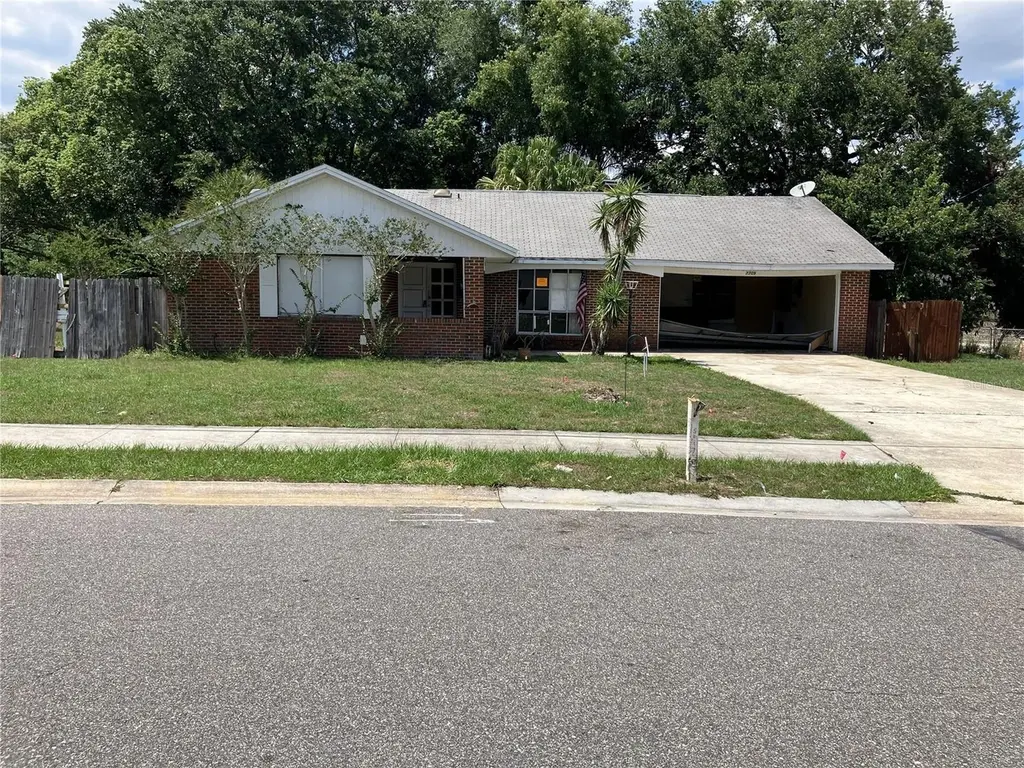
7709 Delphia St · Azalea Park, FL
Flood risk 1/10 · Minimal
- FEMA flood zone
- X (unshaded)
- Chance of flooding over 30 yrs
- 0.0%
- Est. flood insurance / yr
- $507 – $1,088
Fire risk 1/10 · Minimal
- Est. fire insurance / yr
- $947 – $1,759
Heat risk 8/10 · Major
- Hot days now (above 107°F)
- 7 days/yr
- Hot days in 30 yrs
- 22 days/yr
Wind risk 9/10 · Severe
- Chance of severe wind over 30 yrs
- 99.0%
Air-quality risk 2/10 · Minimal
- Unhealthy air days now
- 0 days/yr
- Unhealthy air days in 30 yrs
- 1 days/yr
Risk factors via First Street. Map © Google.
Why this score? — see what drove the B grade
The composite is a weighted blend of 9 inputs, each scored 0–100. Each bar is that input's sub-score; the figure is the points it added to the 100-point composite (weight × sub-score).
- Cash flow +28.7/30.0
- ARV discount +15.0/15.0
- DSCR +10.0/10.0
- 1% rule +6.8/10.0
- Schools +4.1/10.0
- Livability +4.0/5.0
- Rent growth +3.2/5.0
- Condition / age +2.5/5.0
- Appreciation +0.0/10.0
$199,500
🖨 Deal sheet 📄 Offer letter ✓ Due diligence
Listing remarks
MULTIPLE OFFERS RECEIVED. HIGHEST AND BEST DUE BY 5PM EST WEDNESDAY 5/27/2026. Investor Special! Handyman Special! Major repairs needed, code violations present. Property sold as is with code violations. Lock in this massive upside, huge pool home in an incredible location! Great schools and conveniently situated near everything at an unbeatable price! Seller will not accept blind, or sight unseen offers. Listing agent is a part owner of the LLC that owns the property.
Key facts
- Huge pool home
- Great schools
- Incredible location
Tags
Property features AI
Finance
- Other: Property zoned R-1; Residential property subtype: Single Family Residence; Unfurnished; No lease restrictions
- HOA & community: No association
Exterior
- Parking: Attached garage (2 spaces)
- Utilities: Public water; Public sewer; Public utilities
- Home design: Single family residence; One story; Faces south
- Construction: Shingle roof; Other construction materials; Other foundation details; Built on a 0.24-acre lot
- Exterior features: Private in-ground pool; On waterfront (creek) with approximately 109 feet of frontage; Paved road access
Interior
- Kitchen: Other appliances
- Bedrooms: 3 bedrooms
- Flooring: Terrazzo flooring
- Bathrooms: 2 full bathrooms
- Heating & cooling: Other heating; Central air conditioning; Other cooling
- Interior features: Skylights; Other interior features
- Laundry & utility: Other laundry features
Neighborhood map
What this means for you Summary
Snapshot
- This is a 3-bed/2.0-bath single-family listed at $200k.
Deal economics
- At list price, monthly cash flow is $664 ($8k/yr) — positive.
- The deal already cash-flows at list — no discount required.
- Meets the 1% rule at list price ($2k rent vs $200k).
- Cap rate 10.3% vs local median 4.0% in Azalea Park — top-decile yield for the area; either an underpriced asset or a hidden risk that comps aren't pricing in. Stress-test before assuming the spread holds.
Location & tenants
- Location reads 79/100 on livability (#144 in FL, #2,148 nationally) — a middle-class / working-renter tenant base. Strengths: commute A+, cost of living A+, housing A+; Watch: amenities F, employment D-.
- Orange (suburban): math 46% / reading 51% proficiency, ranked #43 of 73 in FL (top 59%) — families likely to look elsewhere, expect single-tenant / working-renter base with shorter leases.
- Market conditions: Rents rising (+2.6%/yr); 172 active listings in the ZIP; 14 comparable units currently listed for rent nearby; rentals at typical pace (median 22d on market — plan ~3-4 weeks tenant-placement turnaround); 8,053 units permitted in Orange County in 2024 (3,133 in 5+ unit buildings).
- At $2,362/mo this rent would consume 47% of the median local household income ($60k/yr) (locally 1566% of renters already pay >50% of income on rent) — very limited rent-growth headroom before tenants either downsize or default.
Forward outlook
- Local home prices are declining (-3.0%/yr); year-one equity from $1k of loan paydown is wiped out by about $6k of value loss. Plan a longer hold.
- Orange County population projected at +52% by 2050 — long-run rental-demand tailwind backs the buy-and-hold thesis.
- At projected returns (-3.0% appreciation + 2.6% rent growth), your $56k cash investment doubles in ~9 years — after that, you're playing with house money.
Negotiation context
- Only 13 days on market — expect competitive offers; lowballing is unlikely to land.
- Current owner paid $82k; list at $200k implies a 145% gain — meaningful room to come down on a strong offer.
Risks & watch-outs
- Climate carrying-cost: severe wind risk, 99% chance of damaging wind over 30y; extreme-heat days projected 7→22/yr by 2055 (HVAC capex compounding) — expect insurance premiums to compound above CPI over the hold.
Questions for the listing agent
- Built in 1965 — when were the roof, HVAC, electrical panel, plumbing, and water heater last replaced?
- Is there a deadline driving the sale (1031 exchange, divorce, estate, relocation)? That informs how much negotiation room exists.
- Schools are B-rated — typically a magnet for longer-tenancy family renters. What's the average tenant stay here, and is there a school-zone premium baked into asking?
- What's the average days-on-market for RENTAL listings here right now (not sales)? A rising rental-DOM trend means longer vacancies and softer asking-rent achievability than the comps imply.
- What's the recent tenant-quality profile in this submarket — average credit score on applications, eviction rate, late-payment / NSF rate, and stable-employment percentage? A property-management company in the area should have these aggregated.
- How much new for-sale + rental construction is in the pipeline within 1–3 miles? Heavy new supply typically softens prices + rents 12–24 months out; constrained supply supports both.
Investment metrics
- 1% rule
- 1.18% ✓
- Cap rate
- 10.29%
- Cash-on-cash
- 14.27%
- DSCR
- 1.64
- GRM
- 7.0
CMA / ARV
- ARV (on-the-fly)
- $358,295
- Comps found
- 5
Show comp detail 5 sales within ~0.75 mi
| Address | Dist | Beds/Ba | Sqft | Sold | Price | $/sf | Match |
|---|---|---|---|---|---|---|---|
| 2483 Becky Sue Dr | 0.27mi | 4/2.0 (+1) | 1,709 (-3%) | 2mo | $347,000 | $203 | 76 |
| 1703 Diamond Dr | 0.55mi | 3/2.0 | 1,763 (-0%) | 5mo | $276,000 | $157 | 70 |
| 7616 Carolyn Ave | 0.47mi | 4/2.0 (+1) | 1,768 (+0%) | 4mo | $430,000 | $243 | 70 |
| 7129 Turquoise Ln | 0.54mi | 3/2.0 | 1,506 (-15%) | 1mo | $304,000 | $202 | 49 |
| 2012 Deborah Dr | 0.64mi | 4/2.0 (+1) | 1,761 (-0%) | 24mo | $390,000 | $221 | 45 |
Match score weights: distance 35% · size 25% · config 20% · recency 20%. Top-matched comps best support the ARV.
Projected returns pro-forma
-3.0% appreciation · 2.6% rent growth · sell at horizon
- IRR
- 4.2%
- Equity multiple
- 1.16×
- Total profit
- $8,970
- Equity at exit
- $29,746
- IRR
- 13.3%
- Equity multiple
- 2.04×
- Total profit
- $58,149
- Equity at exit
- $17,249
Cash invested: $55,860 (down + closing). Projections, not guarantees.
Landlord ↔ Tenant lean methodology
- Overall (STATE)
- 87 Strongly Landlord-Friendly
- State Florida
- 87 Strongly Landlord-Friendly · R+3
- County
- — inherits STATE
- City
- — inherits STATE
ZIP-level market 32807
- Home prices YoY
- -20.1%
- Rents YoY
- 2.6%
- Active inventory
- 172
- Price-to-rent
- 7.0×
Monthly cashflow live
- Estimated rent
- $2,362 high interval (Pro) →
- Mortgage (P&I)
- −$1,046
- Tax from tax record
- −$72 /mo · $869/yr
- Insurance
- −$83
- HOA
- −$0
- Vacancy / Maint / Mgmt
- −$496
- Net cashflow
- $664
Break-even live
UW: 25.0% down · 7.5% · 30yr · 1.5% tax · 5.0% vac · 8.0% maint · 8.0% mgmt
Financing live
Cash to close
- Down payment
- $49,875
- Closing costs
- $5,985
- Reserves months
- —
- Total cash needed
- —
Loan-product check · same deal, 3 products live
Conventional
25% down · 7.5% · 30yr
- Down + closing
- —
- Monthly P&I
- —
- Monthly cashflow
- —
- DSCR
- —
- Eligible?
- —
Personal DTI + credit; lowest rate.
DSCR
20% down · 8.5% · 30yr
- Down + closing
- —
- Monthly P&I
- —
- Monthly cashflow
- —
- DSCR
- —
- Eligible?
- —
No personal income docs; deal must DSCR.
Hard money
10% down · 12.0% · 12mo
- Down + closing
- —
- Monthly P&I
- —
- Monthly cashflow
- —
- DSCR
- —
- Eligible?
- —
Short-term bridge; refi at stabilization.
Rent comps 14 comps
| Address | Beds | Baths | Sqft | Rent | $/sqft | DOM | Units | Dist |
|---|---|---|---|---|---|---|---|---|
| 7675 Stratford Blvd Orlando, FL | 3.0 | 2.0 | 1445 | $2,100 | $1.45 | 22d | 1 | 0.35mi |
| 1509 Regan Ave Orlando, FL | 4.0 | 2.0 | 1382 | $2,375 | $1.72 | 11d | 1 | 0.61mi |
| 1518 Salem Dr Orlando, FL | 4.0 | 2.5 | 2604 | $4,000 | $1.54 | 22d | 1 | 0.64mi |
| 7290 Daniel Webster Dr Unit 4 Winter Park, FL | 2.0 | 3.0 | 1400 | $1,890 | $1.35 | 24d | 1 | 0.74mi |
| 800 Lombard St Orlando, FL | 1.0–3.0 | 1.0–2.0 | 1002 | $2,527 | $2.52 | 1d | 7 | 1.02mi |
| 2530 Passamonte Dr Unit 10E Winter Park, FL | 3.0 | 2.5 | 1837 | $2,600 | $1.42 | 22d | 1 | 1.28mi |
| 3121 Heartwood Ave Winter Park, FL | 3.0 | 2.0 | 1627 | $2,450 | $1.51 | 11d | 1 | 1.32mi |
| 8255 Pamlico St Orlando, FL | 4.0 | 2.0 | 1624 | $2,650 | $1.63 | 24d | 1 | 1.34mi |
| 7325 Goldenpointe Blvd Orlando, FL | 1.0–3.0 | 1.0–2.0 | 1050 | $1,979 | $1.88 | 7d | 9 | 1.38mi |
| 1228 Pine Sap Ct Orlando, FL | 3.0 | 2.0 | 1366 | $2,300 | $1.68 | 12d | 1 | 1.38mi |
| 8430 Port Said St Orlando, FL | 3.0 | 2.0 | 1649 | $2,250 | $1.36 | 22d | 1 | 1.45mi |
| 8214 Woodsworth Dr Orlando, FL | 4.0 | 2.0 | 1807 | $2,500 | $1.38 | 24d | 1 | 1.46mi |
| 3804 Wingbow Ct Orlando, FL | 3.0 | 2.0 | 1631 | $2,500 | $1.53 | 22d | 1 | 1.48mi |
| 654 Caladesi Trl Orlando, FL | 3.0 | 2.0 | 1273 | $2,025 | $1.59 | 20d | 1 | 1.49mi |
Listing history 7 events
-
2026-06-04days on market $199,500 Active 13 DOM
-
2026-06-03days on market $199,500 Active 12 DOM
-
2026-06-02days on market $199,500 Active 11 DOM
-
2026-06-01days on market $199,500 Active 10 DOM
-
2026-05-31days on market $199,500 Active 9 DOM
-
2026-05-22$199,500 Active
-
1991-05-01soldstatus $81,500
ⓘ Source: listings_history table (triggers on properties + properties_extension) + one-shot
backfill from property_details.listing_events for pre-trigger history.
Tax reassessment forecast FL · Resets to sale price
- Current annual tax
- $869 · $72/mo
- Projected year-2 tax
- $1,656 · $138/mo
- Expected delta
- +$787/yr (+$66/mo · 90.6%)
ⓘ Screening estimate from a state-policy table — verify with the county assessor before closing.
Climate risk First Street
- Flood 1/10 Low FEMA zone X (unshaded) · 0% chance over 30 yrs
- Wildfire 1/10 Low
- Heat 8/10 Severe 7 d/yr ≥107°F today · 22 d/yr by 30 yrs out
- Wind 9/10 Extreme 99% chance of damaging wind over 30 yrs
- Air quality 2/10 Low 0 unhealthy d/yr today · 1 by 30 yrs out
Nearby sold comps map
Loading sold comps map…
Walkable amenities ~0.75 mi
Loading nearby amenities…
Taxation est. · year 1
- Rental income
- $28,347
- − Mortgage interest
- −$11,175
- − Property taxes
- −$869
- − Insurance
- −$998
- − Repairs & maintenance
- −$2,268
- − Management
- −$2,268
- − Depreciation
- −$5,804
- Taxable income
- $4,966
- Est. tax owed @ 24.0%
- −$1,192
- After-tax cash flow
- $6,781/yr
For passive investors: Depreciation is non-cash, so a rental often shows a tax loss while cash-flowing — sheltering income. Rental losses are passive: they offset passive income freely, and up to $25,000/yr can offset ordinary (W-2) income if you actively participate and your MAGI is under $100k (phasing out to $0 by $150k); unused losses carry forward. On sale, claimed depreciation is recaptured at up to 25%, and gains may owe capital-gains tax (a 1031 exchange can defer both). Figures are a year-1 estimate at your 24.0% rate — not tax advice; consult a CPA.
Schools (NCES district)
- District
- Orange
- NCES district ID
- 1201440
- Math proficiency
- 46% ▼ -9.00%
- Reading proficiency
- 51% ▼ -2.00%
- Median HH income
- $49,350
- Composite
- 41.47/100
- National rank
- #3461
- State rank
- #43 of 73 in FL
Livability — Azalea Park
- Score
- 79/100
- State rank
- #144
- US rank
- #2148
Category grades
Schools grade is shown separately in the Schools card above.
Census & demographics
- County
- Orange County · 1,471,359 people
- City population
- 34,933
- Metro
- Orlando-Kissimmee-Sanford, FL
- Population (ZIP)
- 34,456
- Household income
- $59,971
- Rent vs Own
- Severe rent burden
- 1566.0
Population outlook (Orange County) Hauer SSP2
- Today (2025)
- 1,618,226 people
- By 2030
- 1,787,404 · +10.5%
- By 2040
- 2,125,621 · +31.4%
- By 2050
- 2,454,016 · +51.6%
- By 2075
- 3,173,711 · +96.1%
- By 2100
- 3,607,781 · +122.9%
Race, ethnicity, and origin ACS 2023
- Neighborhood character
- Majority Hispanic (62%)
- Race & ethnicity
- Hispanic / Latino 62% White 25% Two or more races 24% Black 6% Asian 4%
- Hispanic origin (detail)
- Mexican 6% Puerto Rican 28% Cuban 7% Dominican 5%
- Common ancestry
- Romanian 1% Slovak 1% Lithuanian 1%
- Foreign-born
- 26% · Canada, Jamaica, Vietnam
- Languages at home
- 44% English-only · Spanish 52% Vietnamese 2% Other Indo-European 1%
Political lean MEDSL · Orange
- 2024 margin
- D (+13.6) · D 56.1% · R 42.5% · Other 1.3%
- 2008→2024 swing
- -5.0pp toward R · 2008: 18.6pp · 2024: 13.6pp
- All cycles
- 2024: D+13.6 2020: D+23.1 2016: D+24.6 2012: D+18.2 2008: D+18.6
Not yet ingested
- Civics
- —
Market trends
- HPI YoY
- ▼ -97.72%
- Current HPI
- 388.4089
- Rent YoY
- ▲ 2.60%
- Metro
- Orlando-Kissimmee-Sanford, FL
- State GDP YoY
- ▲ 3.28%
- F500 in state
- 36
Industry mix (Fortune 500 HQ in FL)
| Industry | F500 HQs | Revenue |
|---|---|---|
| Industrial Technology | 2 | $29B |
|
||
| Insurance | 2 | $17B |
|
||
| Retail | 1 | $60B |
|
||
| Technology Distribution | 1 | $58B |
|
||
| Homebuilding | 1 | $35B |
|
||
| Technology Manufacturing | 1 | $35B |
|
||
Price history
+144.8% since first listed2 events — show timeline
- 2026-05-22 Listed $199,500 Stellar MLS as Distributed by MLS Grid
- 1991-05-01 Sold (Public Records) $81,500 Public Records
Property tax history
+1.2%/yrLatest (2025): $869 · +14.8% YoY. Source: county tax records.
Cash-flow waterfall
monthlySold comps — $/sqft
last 12 mo · ≤1 miLoading sold comps…