 Duplex
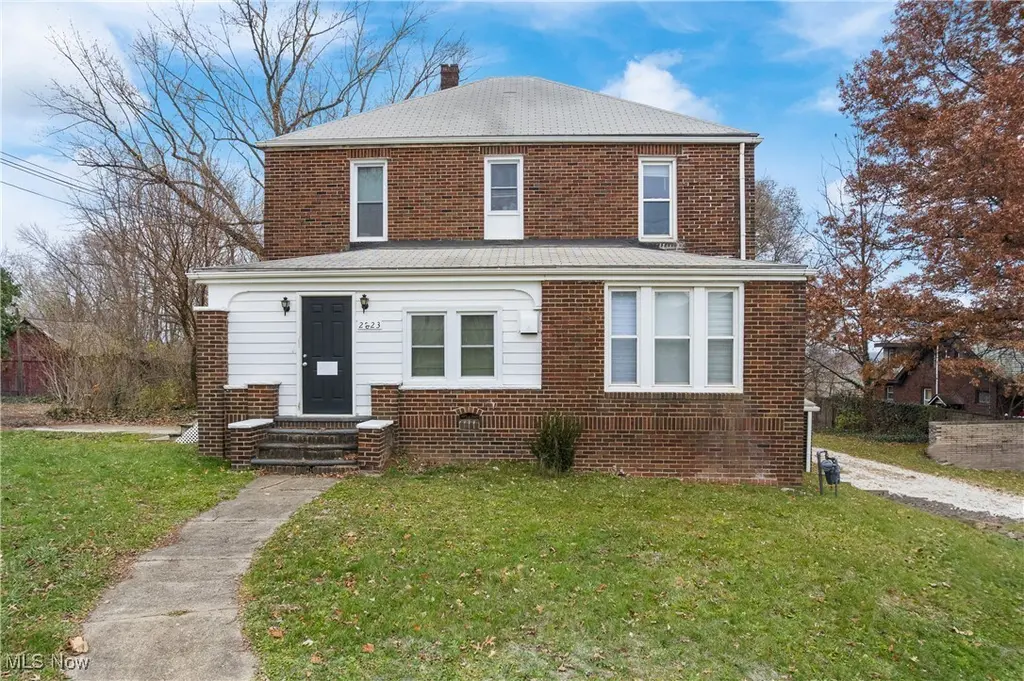
2823 Columbus Rd NE · Canton, OH
Flood risk 1/10 · Minimal
- FEMA flood zone
- X (unshaded)
- Chance of flooding over 30 yrs
- 0.0%
- Est. flood insurance / yr
- $473 – $860
Fire risk 1/10 · Minimal
- Est. fire insurance / yr
- $713 – $1,323
Heat risk 3/10 · Minor
- Hot days now (above 96°F)
- 7 days/yr
- Hot days in 30 yrs
- 17 days/yr
Wind risk 1/10 · Minimal
- Chance of severe wind over 30 yrs
- —
Air-quality risk 2/10 · Minimal
- Unhealthy air days now
- 1 days/yr
- Unhealthy air days in 30 yrs
- 2 days/yr
Risk factors via First Street. Map © Google.
Why this score? — see what drove the C+ grade
The composite is a weighted blend of 9 inputs, each scored 0–100. Each bar is that input's sub-score; the figure is the points it added to the 100-point composite (weight × sub-score).
- Cash flow +25.4/30.0
- DSCR +8.4/10.0
- ARV discount +7.5/15.0
- 1% rule +6.3/10.0
- Schools +5.5/10.0
- Livability +3.6/5.0
- Condition / age +2.5/5.0
- Rent growth +2.4/5.0
- Appreciation +0.0/10.0
$189,000
🖨 Deal sheet 📄 Offer letter ✓ Due diligence
Multi-family units
County records classify this as Multi-Family (2-4 Unit). Listing-text estimate: 2 units. confirmed
Listing remarks MLS
Fully renovated in 2024, this up-and-down duplex is completely occupied and ready to start generating passive income from day one. Both units have been thoughtfully updated throughout, offering low-maintenance living and dependable rental appeal. Located in a fantastic area close to local amenities, this property is a strong addition to any investment portfolio—whether you’re a seasoned investor or just getting started. Combined rent is $1655.00 per month. The top unit is on a month to month lease and the lower unit is leased until 9/26. Don’t miss this turnkey opportunity!
Key facts
- Up and down duplex
- Fully renovated
- Turnkey opportunity
Tags
Neighborhood map
What this means for you Summary
Snapshot
- This is a 2 × 2-bed/1.0-bath units multifamily listed at $189k.
Deal economics
- At list price, monthly cash flow is $435 ($5k/yr) — positive. Per door: $217/mo.
- The deal already cash-flows at list — no discount required.
- Meets the 1% rule at list price ($2k rent vs $189k).
- Recommended offer: $166k (12.0% below list) — sets the bar for market timing.
- Cap rate 9.1% vs local median 5.1% in Canton — top-decile yield for the area; either an underpriced asset or a hidden risk that comps aren't pricing in. Stress-test before assuming the spread holds.
Location & tenants
- Location reads 71/100 on livability (#441 in OH) — a middle-class / working-renter tenant base. Strengths: commute A+, cost of living A+, housing A; Watch: crime F, employment F.
- Plain Local (suburban): math 61% / reading 69% proficiency, ranked #216 of 656 in OH (top 33%) — acceptable for families but not a draw, mixed tenant base, ~2y average lease.
- Market conditions: Rents soft (-0.2%/yr); 71 active listings in the ZIP; lower-income renter base — watch delinquency; 528 units permitted in Stark County in 2024 (84 in 5+ unit buildings).
- At $2,131/mo this rent would consume 59% of the median local household income ($43k/yr) (locally 524% of renters already pay >50% of income on rent) — very limited rent-growth headroom before tenants either downsize or default.
Forward outlook
- Local home prices are declining (-3.0%/yr); year-one equity from $1k of loan paydown is wiped out by about $6k of value loss. Plan a longer hold.
- Stark County population projected to shrink 8% by 2050 — rents likely to lag national; underwrite the cash flow, not the appreciation.
Negotiation context
- It's been on market 194 days — a 12% lower offer ($166k) is reasonable based on typical stale-listing flexibility.
- 13 sale attempts since 23y ago; this cycle's ask has dropped $20k (10%) from the opening price — seller is motivated, your offer sets the floor, not the list.
- Current owner paid $100k; list at $189k implies a 89% gain — meaningful room to come down on a strong offer.
Risks & watch-outs
- Watch-outs: built in 1906 — expect roof / HVAC / electrical / plumbing capex.
Questions for the listing agent
- It's been on market 194 days. Have you received any prior offers? Is the seller open to a 12% concession, seller financing, or rate buy-down credit?
- Can we see the unit-by-unit rent roll, current vacancy, and any below-market leases? What's the average tenancy length?
- What capital expenditures (roof, boiler, parking lot, exteriors) have been made in the last 5 years, and what's planned in the next 2?
- Built in 1906 — when were the roof, HVAC, electrical panel, plumbing, and water heater last replaced?
- Why hasn't it sold? Are there any deal-killer items the seller is aware of (foundation, flood, title, zoning, code violations)?
- Is there a deadline driving the sale (1031 exchange, divorce, estate, relocation)? That informs how much negotiation room exists.
- Crime grade is F in this area — have there been break-ins, vandalism, or insurance claims at this property in the last 3 years? What carrier currently insures it and at what premium?
- What's the average days-on-market for RENTAL listings here right now (not sales)? A rising rental-DOM trend means longer vacancies and softer asking-rent achievability than the comps imply.
- What's the recent tenant-quality profile in this submarket — average credit score on applications, eviction rate, late-payment / NSF rate, and stable-employment percentage? A property-management company in the area should have these aggregated.
- How much new apartment / multifamily construction is in the pipeline within 1–3 miles? Heavy new supply (>2% of stock underway) typically softens rents 12–24 months out; light construction supports rent growth.
Investment metrics
- 1% rule
- 1.13% ✓
- Cap rate
- 9.05%
- Cash-on-cash
- 9.86%
- DSCR
- 1.44
- GRM
- 7.4
CMA / ARV
- ARV (median comp)
- $105,225
- List price
- $189,000
- Delta
- 79.62%
- Verdict
- OVERPRICED
- Comps
- 3 within 2.0 mi
Projected returns pro-forma
-3.0% appreciation · 0.0% rent growth · sell at horizon
- IRR
- -4.8%
- Equity multiple
- 0.83×
- Total profit
- $-9,171
- Equity at exit
- $28,181
- IRR
- 1.1%
- Equity multiple
- 1.07×
- Total profit
- $3,539
- Equity at exit
- $16,341
Cash invested: $52,920 (down + closing). Projections, not guarantees.
Landlord ↔ Tenant lean methodology
- Overall (STATE)
- 73 Landlord-Friendly
- State Ohio
- 73 Landlord-Friendly · R+6
- County
- — inherits STATE
- City
- — inherits STATE
ZIP-level market 44705
- Rents YoY
- -0.2%
- Active inventory
- 71
- Price-to-rent
- 14.8×
Monthly cashflow live
- Estimated rent
- $2,131 medium interval (Pro) →
- Mortgage (P&I)
- −$991
- Tax from tax record
- −$179 /mo · $2,144/yr
- Insurance
- −$79
- HOA
- −$0
- Vacancy / Maint / Mgmt
- −$448
- Net cashflow
- $435
Break-even live
2-unit breakdown (identical units grouped — click to expand)
| Units | Beds | Baths | Est. rent |
|---|---|---|---|
| 2× units | 2 | 1 | $2,130 |
| #1 | 2 | 1 | $1,065 |
| #2 | 2 | 1 | $1,065 |
| Total (2 units) | $2,131 | ||
UW: 25.0% down · 7.5% · 30yr · 1.5% tax · 5.0% vac · 8.0% maint · 8.0% mgmt
Financing live
Cash to close
- Down payment
- $47,250
- Closing costs
- $5,670
- Reserves months
- —
- Total cash needed
- —
Loan-product check · same deal, 3 products live
Conventional
25% down · 7.5% · 30yr
- Down + closing
- —
- Monthly P&I
- —
- Monthly cashflow
- —
- DSCR
- —
- Eligible?
- —
Personal DTI + credit; lowest rate.
DSCR
20% down · 8.5% · 30yr
- Down + closing
- —
- Monthly P&I
- —
- Monthly cashflow
- —
- DSCR
- —
- Eligible?
- —
No personal income docs; deal must DSCR.
Hard money
10% down · 12.0% · 12mo
- Down + closing
- —
- Monthly P&I
- —
- Monthly cashflow
- —
- DSCR
- —
- Eligible?
- —
Short-term bridge; refi at stabilization.
Listing history 49 events
-
2026-06-18days on market $189,000 Active 194 DOM
-
2026-06-17days on market $189,000 Active 193 DOM
-
2026-06-16days on market $189,000 Active 192 DOM
-
2026-06-15days on market $189,000 Active 191 DOM
-
2026-06-14days on market $189,000 Active 189 DOM
-
2026-06-13days on market $189,000 Active 188 DOM
-
2026-06-10days on market $189,000 Active 186 DOM
-
2026-06-09days on market $189,000 Active 185 DOM
-
2026-06-08days on market $189,000 Active 184 DOM
-
2026-06-07days on market $189,000 Active 183 DOM
-
2026-06-05days on market $189,000 Active 180 DOM
-
2026-06-03days on market $189,000 Active 179 DOM
-
2026-06-02days on market $189,000 Active 178 DOM
-
2026-06-01days on market $189,000 Active 177 DOM
-
2026-05-31days on market $189,000 Active 176 DOM
-
2026-05-30days on market $189,000 Active 175 DOM
-
2025-12-06$209,000 Active 598-char remark
Show marketing remark (598 chars)
Fully renovated in 2024, this up-and-down duplex is completely occupied and ready to start generating passive income from day one. Both units have been thoughtfully updated throughout, offering low-maintenance living and dependable rental appeal. Located in a fantastic area close to local amenities, this property is a strong addition to any investment portfolio—whether you’re a seasoned investor or just getting started. Combined rent is $1655.00 per month. The top unit is on a month to month lease and the lower unit is leased until 9/26. Don’t miss this turnkey opportunity!
-
2025-09-12historical $925
-
2025-08-15$925
-
2023-12-05historical
-
2023-09-25price $210,000
-
2023-09-08$220,000 Active
-
2023-09-06historical
-
2023-08-02$220,000 Active
-
2022-03-31soldstatus $100,000 Closed
-
2022-02-17status Pending
-
2022-02-07price $119,900
-
2022-01-28$127,700 Active
-
2021-11-05historical
-
2021-10-09price $129,900
-
2021-09-28$134,700 Active
-
2019-05-09soldstatus $79,900 Sold
-
2019-05-01status Pending
-
2019-04-20status Active
-
2019-04-18historical
-
2019-01-18$79,900 Active
-
2017-11-20historical
-
2017-03-21$89,900 Active
-
2017-03-21historical
-
2017-02-01$89,900 Active
-
2016-10-30historical
-
2016-08-01status Active
-
2016-07-30historical
-
2016-05-16price $89,900
-
2016-04-27price $99,900
-
2015-11-30$109,900 Active
-
2004-05-03soldstatus $82,400
-
2004-02-06historical
-
2003-11-06$105,000
ⓘ Source: listings_history table (triggers on properties + properties_extension) + one-shot
backfill from property_details.listing_events for pre-trigger history.
Tax reassessment forecast OH · Partial reset (capped growth)
- Current annual tax
- $2,144 · $179/mo
- Projected year-2 tax
- $2,546 · $212/mo
- Expected delta
- +$402/yr (+$34/mo · 18.8%)
ⓘ Screening estimate from a state-policy table — verify with the county assessor before closing.
Climate risk First Street
- Flood 1/10 Low FEMA zone X (unshaded) · 0% chance over 30 yrs
- Wildfire 1/10 Low
- Heat 3/10 Moderate 7 d/yr ≥96°F today · 17 d/yr by 30 yrs out
- Wind 1/10 Low
- Air quality 2/10 Low 1 unhealthy d/yr today · 2 by 30 yrs out
Nearby sold comps map
Loading sold comps map…
Walkable amenities ~0.75 mi
Loading nearby amenities…
Taxation est. · year 1
- Rental income
- $25,572
- − Mortgage interest
- −$10,587
- − Property taxes
- −$2,144
- − Insurance
- −$945
- − Repairs & maintenance
- −$2,046
- − Management
- −$2,046
- − Depreciation
- −$5,498
- Taxable income
- $2,307
- Est. tax owed @ 24.0%
- −$554
- After-tax cash flow
- $4,666/yr
For passive investors: Depreciation is non-cash, so a rental often shows a tax loss while cash-flowing — sheltering income. Rental losses are passive: they offset passive income freely, and up to $25,000/yr can offset ordinary (W-2) income if you actively participate and your MAGI is under $100k (phasing out to $0 by $150k); unused losses carry forward. On sale, claimed depreciation is recaptured at up to 25%, and gains may owe capital-gains tax (a 1031 exchange can defer both). Figures are a year-1 estimate at your 24.0% rate — not tax advice; consult a CPA.
Schools (NCES district)
- District
- Plain Local
- NCES district ID
- 3904993
- Math proficiency
- 61% ▼ -13.00%
- Reading proficiency
- 69% ▼ -5.00%
- Median HH income
- $48,337
- Composite
- 55.04/100
- National rank
- #1293
- State rank
- #216 of 656 in OH
Livability — Canton
- Score
- 71/100
- State rank
- #441
- US rank
- #7259
Category grades
Schools grade is shown separately in the Schools card above.
Census & demographics
- County
- Stark County · 272,865 people
- City population
- 103,614
- Metro
- Canton-Massillon, OH
- Population (ZIP)
- 16,872
- Household income
- $43,439
- Rent vs Own
- Severe rent burden
- 524.0
Population outlook (Stark County) Hauer SSP2
- Today (2025)
- 373,708 people
- By 2030
- 371,245 · -0.7%
- By 2040
- 361,331 · -3.3%
- By 2050
- 345,290 · -7.6%
- By 2075
- 302,669 · -19.0%
- By 2100
- 238,870 · -36.1%
Race, ethnicity, and origin ACS 2023
- Neighborhood character
- Diverse neighborhood (Simpson 0.60)
- Race & ethnicity
- White 58% Black 22% Two or more races 13% Hispanic / Latino 9%
- Hispanic origin (detail)
- Mexican 2% Puerto Rican 2%
- Common ancestry
- Italian 5% Romanian 4% Lithuanian 2%
- Foreign-born
- 3% · Canada
- Languages at home
- 97% English-only · Spanish 2% German/W. Germanic 1%
Political lean MEDSL · Stark
- 2024 margin
- Strong R (+21.9) · D 38.6% · R 60.5%
- 2008→2024 swing
- -27.4pp toward R · 2008: 5.5pp · 2024: -21.9pp
- All cycles
- 2024: R+21.9 2020: R+18.5 2016: R+17.4 2012: R+0.4 2008: D+5.5
Not yet ingested
- Civics
- —
Market trends
- HPI YoY
- ▼ -200.62%
- Current HPI
- 150.1531
- Rent YoY
- ▼ -0.23%
- Metro
- Canton-Massillon, OH
- State GDP YoY
- ▲ 1.98%
- F500 in state
- 48
Industry mix (Fortune 500 HQ in OH)
| Industry | F500 HQs | Revenue |
|---|---|---|
| Insurance | 3 | $145B |
|
||
| Industrial Machinery | 3 | $49B |
|
||
| Financial Services | 3 | $24B |
|
||
| Consumer Goods | 2 | $93B |
|
||
| Aerospace / Defense | 2 | $47B |
|
||
| Utilities | 2 | $33B |
|
||
Price history
+99.0% since first listed33 events — show timeline
- 2025-12-06 Listed $209,000 MLSNOW
- 2025-09-12 Rental Removed $925 SHOWMOJO
- 2025-08-15 Listed for Rent $925 SHOWMOJO
- 2023-12-05 Listing Removed — MLSNOW
- 2023-09-25 Price Changed $210,000 MLSNOW
- 2023-09-08 Listed $220,000 MLSNOW
- 2023-09-06 Listing Removed — MLSNOW
- 2023-08-02 Listed $220,000 MLSNOW
- 2022-03-31 Sold (MLS) $100,000 MLSNOW
- 2022-02-17 Pending — MLSNOW
- 2022-02-07 Price Changed $119,900 MLSNOW
- 2022-01-28 Listed $127,700 MLSNOW
- 2021-11-05 Listing Removed — MLSNOW
- 2021-10-09 Price Changed $129,900 MLSNOW
- 2021-09-28 Listed $134,700 MLSNOW
- 2019-05-09 Sold (MLS) $79,900 MLSNOW
- 2019-05-01 Pending — MLSNOW
- 2019-04-20 Relisted — MLSNOW
- 2019-04-18 Listing Removed — MLSNOW
- 2019-01-18 Listed $79,900 MLSNOW
- 2017-11-20 Listing Removed — MLSNOW
- 2017-03-21 Listed $89,900 MLSNOW
- 2017-03-21 Listing Removed — MLSNOW
- 2017-02-01 Listed $89,900 MLSNOW
- 2016-10-30 Listing Removed — MLSNOW
- 2016-08-01 Relisted — MLSNOW
- 2016-07-30 Listing Removed — MLSNOW
- 2016-05-16 Price Changed $89,900 MLSNOW
- 2016-04-27 Price Changed $99,900 MLSNOW
- 2015-11-30 Listed $109,900 MLSNOW
- 2004-05-03 Sold (Public Records) $82,400 Public Records
- 2004-02-06 Listing Removed — MLSNOW
- 2003-11-06 Listed $105,000 MLSNOW
Property tax history
+6.0%/yrLatest (2024): $2,144 · +39.4% YoY. Source: county tax records.
Cash-flow waterfall
monthlySold comps — $/sqft
last 12 mo · ≤1 miLoading sold comps…