 🌊 Lakefront
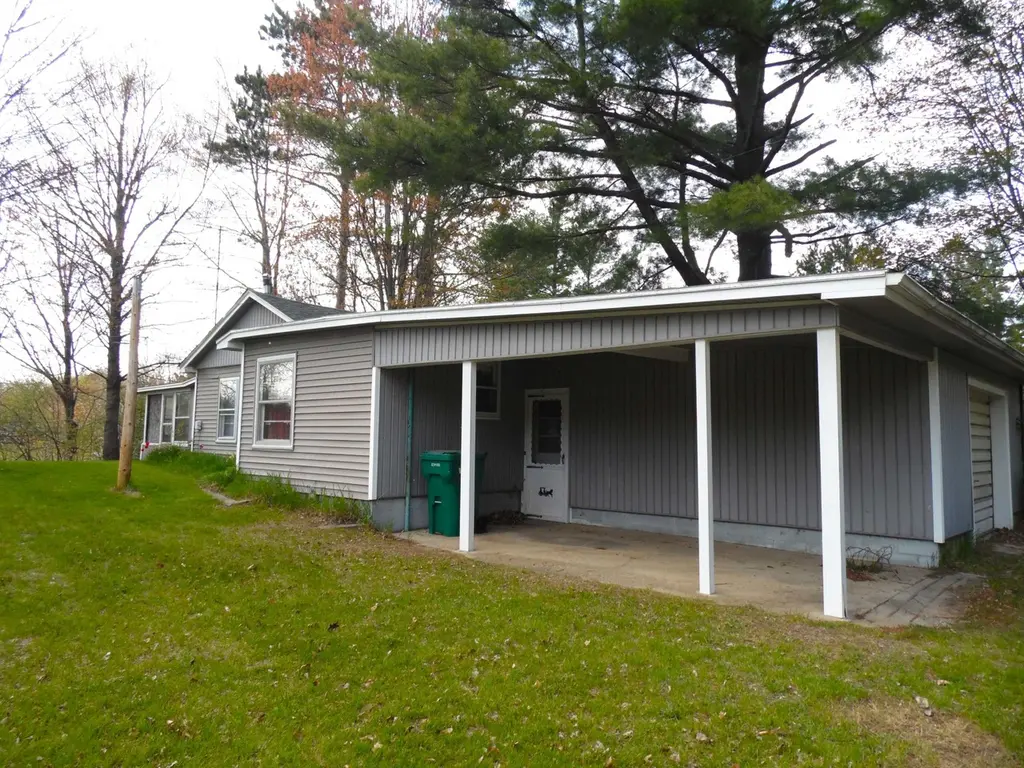
103 Lakeview Dr · Hay, MI
Flood risk 1/10 · Minimal
- FEMA flood zone
- X (unshaded)
- Chance of flooding over 30 yrs
- 0.0%
- Est. flood insurance / yr
- $473 – $860
Fire risk 3/10 · Minor
- Est. fire insurance / yr
- $784 – $1,456
Heat risk 2/10 · Minimal
- Hot days now (above 96°F)
- 7 days/yr
- Hot days in 30 yrs
- 14 days/yr
Wind risk 1/10 · Minimal
- Chance of severe wind over 30 yrs
- —
Air-quality risk 2/10 · Minimal
- Unhealthy air days now
- 0 days/yr
- Unhealthy air days in 30 yrs
- 1 days/yr
Risk factors via First Street. Map © Google.
Why this score? — see what drove the B grade
The composite is a weighted blend of 9 inputs, each scored 0–100. Each bar is that input's sub-score; the figure is the points it added to the 100-point composite (weight × sub-score).
- Cash flow +30.0/30.0
- ARV discount +15.0/15.0
- DSCR +10.0/10.0
- 1% rule +8.1/10.0
- Schools +3.3/10.0
- Rent growth +2.5/5.0
- Livability +2.5/5.0
- Condition / age +2.5/5.0
- Appreciation +0.0/10.0
$139,000
🖨 Deal sheet (PDF) 📄 Offer letter ✓ Due diligence
Listing remarks
Waterfront cottage on ALL SPORT Smallwood LAKE! Welcome to your slice of recreational paradise on the Eastern side of Gladwin County. (road access to ATV trails-no more trailering!) What does your summer day look like? Water skiing? Fishing? Trail Riding? Well, why limit yourself! This cabin has been making UP NORTH memories for years-it's time for some of your own. Property is an estate sale and includes furnishings-IMMEDIATE OCCUPANCY at closing. Smallwood Lake is a 232-acre lake and boasts some of the best fishing in Gladwin County. Smallwood Lake is a controlled waterway-Smallwood DAM is near completion, and water levels should be back up this Fall. CURRENT PICTURES are of LOW LAKE LEVE
Key facts
- Smallwood lake
- Immediate occupancy
- Waterfront cottage
Tags
Property features AI
Finance
- Other: Inspection complete for well/septic
Exterior
- Parking: Attached garage and carport; Garage dimensions approx. 19 x 19; Covered parking with 3 or more parking spaces; Listed as 1 parking space in garage
- Security: No pet restrictions noted
- Utilities: Private well water; Septic system; 100 Amp electric service; Electricity connected; Natural gas available; Gas water heater; Cable available; Phone available; DSL and hard line internet available (Spectrum listed); Satellite services
- Home design: Residential single-story; Built in 1970; Entry-level main floor; West side of the street (W)
- Construction: Wood construction; Slab foundation; Year built: 1970
- Exterior features: Wood exterior; Patio; Porch; Storm windows / screens; Street lights nearby; On waterfront with lake frontage and water view (Smallwood Lake); All-sports lake with sandy bottom and interior lake access; Large lot (approx. 65+ ft frontage); Rural setting
Interior
- Kitchen: Eat-in kitchen — approx. 12 x 12, concrete flooring; Range / oven; Refrigerator; Dishwasher not listed
- Bedrooms: First-floor bedroom (Entry level) — approx. 12 x 10, vinyl flooring; Second bedroom (Main level) — approx. 12 x 9, concrete flooring
- Flooring: Vinyl in primary bedroom; Concrete flooring in multiple rooms (kitchen, living areas, bathroom, sun room, laundry); Linoleum in family room
- Bathrooms: One full bathroom on the main floor — approx. 8 x 5, concrete flooring
- Heating & cooling: LP / propane gas heat; Wall heat; Ceiling fan(s); Wall/window A/C units
- Interior features: Den / study / library; Living room; Eat-in kitchen; Cable / internet available; DSL available; First-floor laundry; First-floor bedroom
- Laundry & utility: Laundry on entry level — approx. 8 x 10, concrete flooring; Washer; Dryer
Neighborhood map
What this means for you Summary
Snapshot
- This is a 2-bed/1.0-bath single-family listed at $139k.
Deal economics
- At list price, monthly cash flow is $571 ($7k/yr) — positive.
- The deal already cash-flows at list — no discount required.
- Meets the 1% rule at list price ($2k rent vs $139k).
- Recommended offer: $135k (3.0% below list) — sets the bar for market timing.
Location & tenants
- Location reads: area grade B — affects rentability + tenant quality, not the cash-flow math above.
- Gladwin Community Schools (town): math 28% / reading 51% proficiency, ranked #232 of 540 in MI (top 43%) — families likely to look elsewhere, expect single-tenant / working-renter base with shorter leases.
- Zoned schools: Gladwin Elementary School (379 students, 67% FRL); Gladwin Junior High School (math 33% / reading 55%, grade D, #173 of 493 statewide, top 36%, 339 students, 59% FRL); Gladwin High School (math 17% / reading 47%, grade F, #405 of 713 statewide, top 59%, 495 students, 52% FRL).
- Market conditions: 289 active listings in the ZIP; 90 units permitted in Gladwin County in 2024 (0 in 5+ unit buildings).
Forward outlook
- Local home prices are declining (-3.0%/yr); year-one equity from $961 of loan paydown is wiped out by about $4k of value loss. Plan a longer hold.
- Gladwin County population projected at -25% by 2050 — secular population decline; favor cash flow + early exit over multi-decade hold.
- At projected returns (-3.0% appreciation + 3.0% rent growth), your $39k cash investment doubles in ~7 years — after that, you're playing with house money.
Negotiation context
- It's been on market 32 days — a 3% lower offer ($135k) is reasonable based on typical stale-listing flexibility.
- 2 sale attempts with the ask held roughly flat each time — persistent listings suggest the price (not the market) is what's stuck; bring a comps-based counter.
Questions for the listing agent
- It's been on market 32 days. Have you received any prior offers? Is the seller open to a 3% concession, seller financing, or rate buy-down credit?
- Built in 1970 — when were the roof, HVAC, electrical panel, plumbing, and water heater last replaced?
- Is there a deadline driving the sale (1031 exchange, divorce, estate, relocation)? That informs how much negotiation room exists.
- This sits on a lake — are riparian / water-frontage rights deeded with the parcel? Any dock permits, shoreline easements, or HOA water-use restrictions?
- What's the documented flood / surge / shoreline-erosion history here (FEMA AND non-FEMA — e.g., storm surge, creek backup, septic-field saturation)?
- Any water-quality or seasonal algae-bloom issues that affect tenant satisfaction or short-term-rental demand?
- What's the average days-on-market for RENTAL listings here right now (not sales)? A rising rental-DOM trend means longer vacancies and softer asking-rent achievability than the comps imply.
- What's the recent tenant-quality profile in this submarket — average credit score on applications, eviction rate, late-payment / NSF rate, and stable-employment percentage? A property-management company in the area should have these aggregated.
- How much new for-sale + rental construction is in the pipeline within 1–3 miles? Heavy new supply typically softens prices + rents 12–24 months out; constrained supply supports both.
Investment metrics
- 1% rule
- 1.31% ✓
- Cap rate
- 11.22%
- Cash-on-cash
- 17.59%
- DSCR
- 1.78
- GRM
- 6.4
CMA / ARV
- ARV (on-the-fly)
- $238,140
- Comps found
- 3
Show comp detail 3 sales within ~0.75 mi
| Address | Dist | Beds/Ba | Sqft | Sold | Price | $/sf | Match |
|---|---|---|---|---|---|---|---|
| 115 S Elm St | 0.43mi | 2/1.0 | 900 (0%) | 12mo | $140,000 | $156 | 70 |
| 511 Rivers Ter | 0.42mi | 3/1.0 (+1) | 900 (0%) | 13mo | $220,000 | $244 | 64 |
| 555 Lakeview Dr | 0.45mi | 3/2.0 (+1) | 990 (+10%) | 21mo | $194,500 | $196 | 36 |
Match score weights: distance 35% · size 25% · config 20% · recency 20%. Top-matched comps best support the ARV.
Projected returns pro-forma
-3.0% appreciation · 3.0% rent growth · sell at horizon
- IRR
- 9.0%
- Equity multiple
- 1.35×
- Total profit
- $13,790
- Equity at exit
- $20,725
- IRR
- 18.2%
- Equity multiple
- 2.51×
- Total profit
- $58,683
- Equity at exit
- $12,018
Cash invested: $38,920 (down + closing). Projections, not guarantees.
Landlord ↔ Tenant lean methodology
- Overall (STATE)
- 62 Landlord-Friendly
- State Michigan
- 62 Landlord-Friendly · EVEN
- County
- — inherits STATE
- City
- — inherits STATE
ZIP-level market 48624
- Home prices YoY
- -23.4%
- Active inventory
- 289
- Price-to-rent
- 6.4×
Monthly cashflow live
- Estimated rent
- $1,819 medium interval (Pro) →
- Mortgage (P&I)
- −$729
- Tax from tax record
- −$80 /mo · $955/yr
- Insurance
- −$58
- HOA
- −$0
- Vacancy / Maint / Mgmt
- −$382
- Net cashflow
- $571
Break-even live
Sensitivity live
| Price | -10% $649 | -5% $610 | +0% $571 | +5% $531 | +10% $492 |
|---|---|---|---|---|---|
| Rent | -10% $427 | -5% $499 | +0% $571 | +5% $642 | +10% $714 |
| Rate | -1.0pp $641 | -0.5pp $606 | base $571 | +0.5pp $535 | +1.0pp $498 |
UW: 25.0% down · 7.5% · 30yr · 1.5% tax · 5.0% vac · 8.0% maint · 8.0% mgmt
Financing live
Cash to close
- Down payment
- $34,750
- Closing costs
- $4,170
- Reserves months
- —
- Total cash needed
- —
Loan-product check · same deal, 3 products live
Conventional
25% down · 7.5% · 30yr
- Down + closing
- —
- Monthly P&I
- —
- Monthly cashflow
- —
- DSCR
- —
- Eligible?
- —
Personal DTI + credit; lowest rate.
DSCR
20% down · 8.5% · 30yr
- Down + closing
- —
- Monthly P&I
- —
- Monthly cashflow
- —
- DSCR
- —
- Eligible?
- —
No personal income docs; deal must DSCR.
Hard money
10% down · 12.0% · 12mo
- Down + closing
- —
- Monthly P&I
- —
- Monthly cashflow
- —
- DSCR
- —
- Eligible?
- —
Short-term bridge; refi at stabilization.
Listing history 22 events
-
2026-06-21days on market $139,000 Active 32 DOM
-
2026-06-21days on market $139,000 Active 31 DOM
-
2026-06-18days on market $139,000 Active 29 DOM
-
2026-06-17days on market $139,000 Active 28 DOM
-
2026-06-17price $139,000 Active 27 DOM
-
2026-06-16days on market $144,900 Active 27 DOM
-
2026-06-15days on market $144,900 Active 26 DOM
-
2026-06-13days on market $144,900 Active 24 DOM
-
2026-06-12days on market $144,900 Active 23 DOM
-
2026-06-09days on market $144,900 Active 20 DOM
-
2026-06-08days on market $144,900 Active 19 DOM
-
2026-06-07days on market $144,900 Active 18 DOM
-
2026-06-07days on market $144,900 Active 17 DOM
-
2026-06-04days on market $144,900 Active 14 DOM
-
2026-06-02days on market $144,900 Active 13 DOM
-
2026-06-01days on market $144,900 Active 12 DOM
-
2026-05-31days on market $144,900 Active 11 DOM
-
2026-05-31days on market $144,900 Active 10 DOM
-
2026-05-20$144,900 Active
-
2025-10-14historical
-
2025-06-27price $139,900
-
2025-04-13$150,000 Active
ⓘ Source: listings_history table (triggers on properties + properties_extension) + one-shot
backfill from property_details.listing_events for pre-trigger history.
Tax reassessment forecast MI · Partial reset (capped growth)
- Current annual tax
- $955 · $80/mo
- Projected year-2 tax
- $1,548 · $129/mo
- Expected delta
- +$593/yr (+$49/mo · 62.0%)
ⓘ Screening estimate from a state-policy table — verify with the county assessor before closing.
Climate risk First Street
- Flood 1/10 Low FEMA zone X (unshaded) · 0% chance over 30 yrs
- Wildfire 3/10 Moderate
- Heat 2/10 Low 7 d/yr ≥96°F today · 14 d/yr by 30 yrs out
- Wind 1/10 Low
- Air quality 2/10 Low 0 unhealthy d/yr today · 1 by 30 yrs out
Nearby sold comps map
Loading sold comps map…
Walkable amenities ~0.75 mi
Loading nearby amenities…
Taxation est. · year 1
- Rental income
- $21,829
- − Mortgage interest
- −$7,786
- − Property taxes
- −$955
- − Insurance
- −$695
- − Repairs & maintenance
- −$1,746
- − Management
- −$1,746
- − Depreciation
- −$4,044
- Taxable income
- $4,856
- Est. tax owed @ 24.0%
- −$1,166
- After-tax cash flow
- $5,682/yr
For passive investors: Depreciation is non-cash, so a rental often shows a tax loss while cash-flowing — sheltering income. Rental losses are passive: they offset passive income freely, and up to $25,000/yr can offset ordinary (W-2) income if you actively participate and your MAGI is under $100k (phasing out to $0 by $150k); unused losses carry forward. On sale, claimed depreciation is recaptured at up to 25%, and gains may owe capital-gains tax (a 1031 exchange can defer both). Figures are a year-1 estimate at your 24.0% rate — not tax advice; consult a CPA.
Schools (NCES district)
- District
- Gladwin Community Schools
- NCES district ID
- 2615990
- Math proficiency
- 28% ▼ -13.00%
- Reading proficiency
- 51% ▼ -2.00%
- Median HH income
- $38,917
- Composite
- 32.93/100
- National rank
- #5595
- State rank
- #232 of 540 in MI
Livability — Hay
No livability data for this city. (Only ~50 U.S. cities are tracked.)
Census & demographics
- Population (ZIP)
- 16,269
Population outlook (Gladwin County) Hauer SSP2
- Today (2025)
- 23,440 people
- By 2030
- 22,281 · -4.9%
- By 2040
- 19,867 · -15.2%
- By 2050
- 17,667 · -24.6%
- By 2075
- 12,909 · -44.9%
- By 2100
- 8,629 · -63.2%
Race, ethnicity, and origin ACS 2023
- Neighborhood character
- Predominantly White (94%)
- Race & ethnicity
- White 94% Two or more races 4% Hispanic / Latino 2%
- Common ancestry
- Romanian 8% Lithuanian 3% Iranian 3%
- Foreign-born
- 1%
- Languages at home
- 95% English-only · German/W. Germanic 4% Spanish 1%
Political lean MEDSL · Gladwin
- 2024 margin
- Solid R (+40.7) · D 29.1% · R 69.8% · Other 1.1%
- 2008→2024 swing
- -42.2pp toward R · 2008: 1.5pp · 2024: -40.7pp
- All cycles
- 2024: R+40.7 2020: R+36.8 2016: R+34.7 2012: R+7.2 2008: D+1.5
Not yet ingested
- Civics
- —
Market trends
- HPI YoY
- ▼ -72.67%
- Current HPI
- 238.0744
- Rent YoY
- —
- Metro
- —
- State GDP YoY
- ▲ 1.37%
- F500 in state
- 28
Industry mix (Fortune 500 HQ in MI)
| Industry | F500 HQs | Revenue |
|---|---|---|
| Automotive Parts | 3 | $48B |
|
||
| Automotive | 2 | $372B |
|
||
| Chemicals | 1 | $45B |
|
||
| Automotive Retail | 1 | $29B |
|
||
| Healthcare / Medical Devices | 1 | $23B |
|
||
| Automotive Technology | 1 | $20B |
|
||
Price history
-3.4% since first listed4 events — show timeline
- 2026-05-20 Listed $144,900 MiRealSource-MiMLS
- 2025-10-14 Listing Removed — MiRealSource-MiMLS
- 2025-06-27 Price Changed $139,900 MiRealSource-MiMLS
- 2025-04-13 Listed $150,000 MiRealSource-MiMLS
Property tax history
-2.9%/yrLatest (2025): $955 · -46.6% YoY. Source: county tax records.
Cash-flow waterfall
monthlySold comps — $/sqft
last 12 mo · ≤1 miLoading sold comps…