 Multi-family
33 Oak St · Brattleboro, VT
Flood risk 1/10 · Minimal
- FEMA flood zone
- X (unshaded)
- Chance of flooding over 30 yrs
- 0.0%
- Est. flood insurance / yr
- $507 – $1,088
Fire risk 1/10 · Minimal
- Est. fire insurance / yr
- $480 – $892
Heat risk 3/10 · Minor
- Hot days now (above 94°F)
- 7 days/yr
- Hot days in 30 yrs
- 18 days/yr
Wind risk 4/10 · Minor
- Chance of severe wind over 30 yrs
- 9.0%
Air-quality risk 2/10 · Minimal
- Unhealthy air days now
- 0 days/yr
- Unhealthy air days in 30 yrs
- 1 days/yr
Risk factors via First Street. Map © Google.
Why this score? — see what drove the C- grade
The composite is a weighted blend of 9 inputs, each scored 0–100. Each bar is that input's sub-score; the figure is the points it added to the 100-point composite (weight × sub-score).
- Cash flow +15.0/30.0
- ARV discount +12.7/15.0
- 1% rule +5.0/10.0
- DSCR +5.0/10.0
- Schools +5.0/10.0
- Livability +3.4/5.0
- Rent growth +2.5/5.0
- Condition / age +2.5/5.0
- Appreciation +0.0/10.0
$495,000
🖨 Deal sheet 📄 Offer letter ✓ Due diligence
Multi-family units
County records classify this as Multi-Family (5+ Unit). Listing-text estimate: 1 unit. estimate disagrees with records
5+ unit building — per-unit beds/baths from public records are typically unavailable; the breakdown below (if shown) is an estimate from the listing text.
Listing remarks
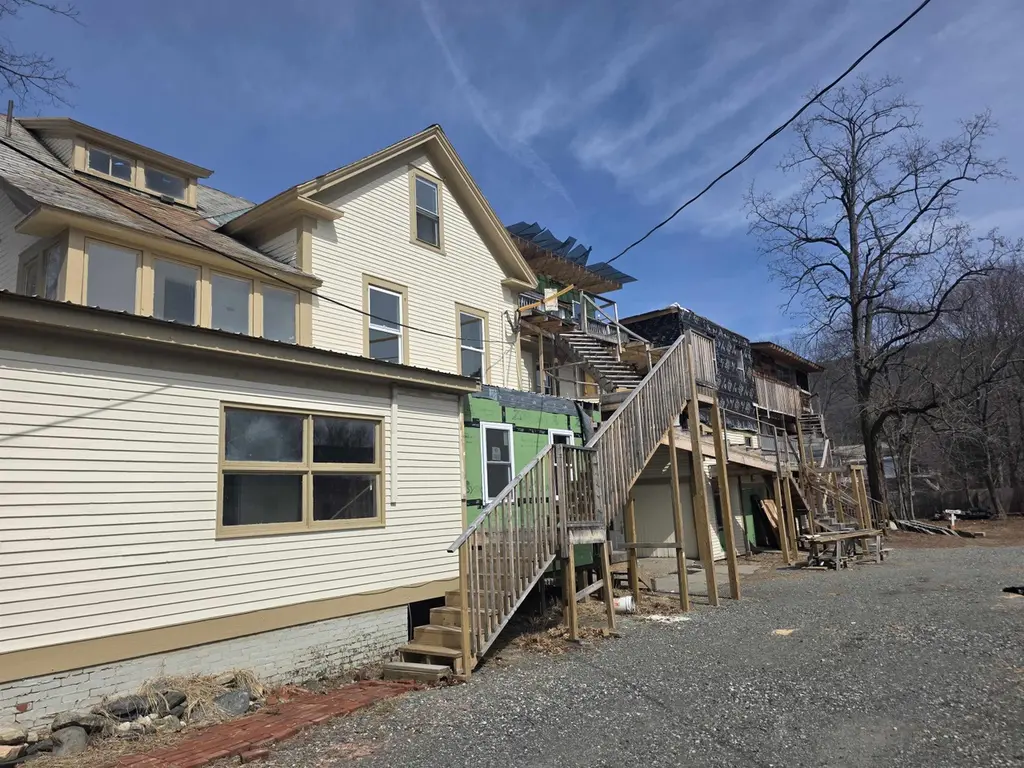
This is a rare opportunity to take over a multi-family project in the heart of Brattleboro. The 0.40-acre site features a vacant three-story building that has already been gutted and fully remediated for lead paint. With town zoning already approved to expand from 8 to 13 units and full architect plans included, the heavy lifting and permitting phase is already behind you. Upon completion, the complex will offer roughly 11,183 square feet of high-demand housing. The financial incentives currently lined up for this project are significant. The sale includes access to VHIP funds : 8 original units $130,000 and the 5 new units $187,500. Additionally, there is a $125,000 Downtown State Tax Cred
Key facts
- Low vacancy rate
- Town zoning approved
- 0.4 acre lot
Tags
Property features AI
Exterior
- Parking: Gravel driveway parking
- Utilities: Public water; Public sewer; Electric service with circuit breakers and original knob-and-tube wiring; No internet service indicated; Electric service provided by GMP
- Home design: Multi-family building; Existing property; Originally built in 1860
- Construction: Wood frame construction; Roof includes corrugated metal and slate
- Exterior features: City lot; Level lot; Gravel driveway; Public road frontage
Interior
- Bedrooms: Eight-unit building with 2 one-bedroom units, 3 two-bedroom units, and 3 three-plus bedroom units
- Heating & cooling: Oil heating; Hot water heating; No central cooling
- Interior features: Full walk-up basement with dirt floor
Neighborhood map
What this means for you Summary
Snapshot
- This is a multifamily listed at $495k.
Deal economics
- At list price, monthly cash flow is $15k ($175k/yr) — positive.
- The deal already cash-flows at list — no discount required.
- Meets the 1% rule at list price ($23k rent vs $495k).
- Recommended offer: $480k (3.0% below list) — sets the bar for market timing.
- Cap rate 41.6% vs local median 4.5% in Brattleboro — top-decile yield for the area; either an underpriced asset or a hidden risk that comps aren't pricing in. Stress-test before assuming the spread holds.
Location & tenants
- Location reads 67/100 on livability (#42 in VT) — a middle-class / working-renter tenant base. Strengths: schools A+, health & safety A+, cost of living B; Watch: crime F, amenities D-, commute F.
- Market conditions: 82 active listings in the ZIP; 1 comparable units currently listed for rent nearby; 188 units permitted in Windham County in 2024 (0 in 5+ unit buildings).
- At $22,677/mo this rent would consume 413% of the median local household income ($66k/yr) (locally 594% of renters already pay >50% of income on rent) — very limited rent-growth headroom before tenants either downsize or default.
Forward outlook
- Local home prices are declining (-3.0%/yr); year-one equity from $3k of loan paydown is wiped out by about $15k of value loss. Plan a longer hold.
- Windham County population projected at -26% by 2050 — secular population decline; favor cash flow + early exit over multi-decade hold.
- At projected returns (-3.0% appreciation + 3.0% rent growth), your $139k cash investment doubles in ~1 year — after that, you're playing with house money.
Negotiation context
- It's been on market 49 days — a 3% lower offer ($480k) is reasonable based on typical stale-listing flexibility.
- Current owner paid $350k; 41% above their basis — modest negotiation headroom, anchor on the comps not their cost.
Risks & watch-outs
- Watch-outs: built in 1860 — expect roof / HVAC / electrical / plumbing capex.
Questions for the listing agent
- It's been on market 49 days. Have you received any prior offers? Is the seller open to a 3% concession, seller financing, or rate buy-down credit?
- Built in 1860 — when were the roof, HVAC, electrical panel, plumbing, and water heater last replaced?
- Is there a deadline driving the sale (1031 exchange, divorce, estate, relocation)? That informs how much negotiation room exists.
- Schools are A-rated — typically a magnet for longer-tenancy family renters. What's the average tenant stay here, and is there a school-zone premium baked into asking?
- Crime grade is F in this area — have there been break-ins, vandalism, or insurance claims at this property in the last 3 years? What carrier currently insures it and at what premium?
- What's the average days-on-market for RENTAL listings here right now (not sales)? A rising rental-DOM trend means longer vacancies and softer asking-rent achievability than the comps imply.
- What's the recent tenant-quality profile in this submarket — average credit score on applications, eviction rate, late-payment / NSF rate, and stable-employment percentage? A property-management company in the area should have these aggregated.
- How much new apartment / multifamily construction is in the pipeline within 1–3 miles? Heavy new supply (>2% of stock underway) typically softens rents 12–24 months out; light construction supports rent growth.
Investment metrics
- 1% rule
- 4.58% ✓
- Cap rate
- 41.60%
- Cash-on-cash
- 126.08%
- DSCR
- 6.61
- GRM
- 1.8
CMA / ARV
- ARV (on-the-fly)
- $559,776
- Comps found
- 2
Show comp detail 2 sales within ~0.75 mi
| Address | Dist | Beds/Ba | Sqft | Sold | Price | $/sf | Match |
|---|---|---|---|---|---|---|---|
| 79 Putney Rd | 0.32mi | —/4.0 | 4,087 (-1%) | 14mo | $399,000 | $98 | 72 |
| 145 High St | 0.08mi | —/— | 4,345 (+6%) | 22mo | $589,000 | $136 | 68 |
Match score weights: distance 35% · size 25% · config 20% · recency 20%. Top-matched comps best support the ARV.
Projected returns pro-forma
-3.0% appreciation · 3.0% rent growth · sell at horizon
- IRR
- —
- Equity multiple
- 7.12×
- Total profit
- $847,589
- Equity at exit
- $73,806
- IRR
- —
- Equity multiple
- 14.95×
- Total profit
- $1,933,589
- Equity at exit
- $42,799
Cash invested: $138,600 (down + closing). Projections, not guarantees.
Landlord ↔ Tenant lean methodology
- Overall (STATE)
- 41 Moderately Tenant-Leaning
- State Vermont
- 41 Moderately Tenant-Leaning · D+15
- County
- — inherits STATE
- City
- — inherits STATE
ZIP-level market 05301
- Home prices YoY
- -19.2%
- Active inventory
- 82
- Price-to-rent
- 23.6×
Monthly cashflow live
- Estimated rent
- $22,677 medium interval (Pro) →
- Mortgage (P&I)
- −$2,596
- Tax from tax record
- −$550 /mo · $6,602/yr
- Insurance
- −$206
- HOA
- −$0
- Vacancy / Maint / Mgmt
- −$4,762
- Net cashflow
- $14,563
Break-even live
13-unit breakdown (identical units grouped — click to expand)
| Units | Beds | Baths | Est. rent |
|---|---|---|---|
| 13× units | 3 | 1 | $22,672 |
| #1 | 3 | 1 | $1,744 |
| #2 | 3 | 1 | $1,744 |
| #3 | 3 | 1 | $1,744 |
| #4 | 3 | 1 | $1,744 |
| #5 | 3 | 1 | $1,744 |
| #6 | 3 | 1 | $1,744 |
| #7 | 3 | 1 | $1,744 |
| #8 | 3 | 1 | $1,744 |
| #9 | 3 | 1 | $1,744 |
| #10 | 3 | 1 | $1,744 |
| #11 | 3 | 1 | $1,744 |
| #12 | 3 | 1 | $1,744 |
| #13 | 3 | 1 | $1,744 |
| Total (13 units) | $22,677 | ||
UW: 25.0% down · 7.5% · 30yr · 1.5% tax · 5.0% vac · 8.0% maint · 8.0% mgmt
Financing live
Cash to close
- Down payment
- $123,750
- Closing costs
- $14,850
- Reserves months
- —
- Total cash needed
- —
Loan-product check · same deal, 3 products live
Conventional
25% down · 7.5% · 30yr
- Down + closing
- —
- Monthly P&I
- —
- Monthly cashflow
- —
- DSCR
- —
- Eligible?
- —
Personal DTI + credit; lowest rate.
DSCR
20% down · 8.5% · 30yr
- Down + closing
- —
- Monthly P&I
- —
- Monthly cashflow
- —
- DSCR
- —
- Eligible?
- —
No personal income docs; deal must DSCR.
Hard money
10% down · 12.0% · 12mo
- Down + closing
- —
- Monthly P&I
- —
- Monthly cashflow
- —
- DSCR
- —
- Eligible?
- —
Short-term bridge; refi at stabilization.
Rent comps 1 comps
| Address | Beds | Baths | Sqft | Rent | $/sqft | DOM | Units | Dist |
|---|---|---|---|---|---|---|---|---|
| 63-73 Main St Unit A Brattleboro, VT | 3.0 | 2.0 | 3236 | $4,550 | $1.41 | 14d | 1 | 0.33mi |
Listing history 18 events
-
2026-06-18days on market $495,000 Active 49 DOM
-
2026-06-17days on market $495,000 Active 48 DOM
-
2026-06-16days on market $495,000 Active 47 DOM
-
2026-06-15days on market $495,000 Active 46 DOM
-
2026-06-14days on market $495,000 Active 44 DOM
-
2026-06-13days on market $495,000 Active 43 DOM
-
2026-06-10days on market $495,000 Active 41 DOM
-
2026-06-09days on market $495,000 Active 40 DOM
-
2026-06-08days on market $495,000 Active 39 DOM
-
2026-06-07days on market $495,000 Active 38 DOM
-
2026-06-03pricedays on market $495,000 Active 34 DOM
-
2026-06-02days on market $535,000 Active 33 DOM
-
2026-06-01days on market $535,000 Active 32 DOM
-
2026-05-31days on market $535,000 Active 31 DOM
-
2026-05-31days on market $535,000 Active 30 DOM
-
2026-05-12price $535,000
-
2026-04-30$550,000 Active
-
2023-06-16soldstatus $350,000
ⓘ Source: listings_history table (triggers on properties + properties_extension) + one-shot
backfill from property_details.listing_events for pre-trigger history.
Tax reassessment forecast VT · Partial reset (capped growth)
- Current annual tax
- $6,602 · $550/mo
- Projected year-2 tax
- $8,003 · $667/mo
- Expected delta
- +$1,402/yr (+$117/mo · 21.2%)
ⓘ Screening estimate from a state-policy table — verify with the county assessor before closing.
Climate risk First Street
- Flood 1/10 Low FEMA zone X (unshaded) · 0% chance over 30 yrs
- Wildfire 1/10 Low
- Heat 3/10 Moderate 7 d/yr ≥94°F today · 18 d/yr by 30 yrs out
- Wind 4/10 Moderate 9% chance of damaging wind over 30 yrs
- Air quality 2/10 Low 0 unhealthy d/yr today · 1 by 30 yrs out
Nearby sold comps map
Loading sold comps map…
Walkable amenities ~0.75 mi
Loading nearby amenities…
Taxation est. · year 1
- Rental income
- $272,124
- − Mortgage interest
- −$27,728
- − Property taxes
- −$6,602
- − Insurance
- −$2,475
- − Repairs & maintenance
- −$21,770
- − Management
- −$21,770
- − Depreciation
- −$14,400
- Taxable income
- $177,380
- Est. tax owed @ 24.0%
- −$42,571
- After-tax cash flow
- $132,180/yr
For passive investors: Depreciation is non-cash, so a rental often shows a tax loss while cash-flowing — sheltering income. Rental losses are passive: they offset passive income freely, and up to $25,000/yr can offset ordinary (W-2) income if you actively participate and your MAGI is under $100k (phasing out to $0 by $150k); unused losses carry forward. On sale, claimed depreciation is recaptured at up to 25%, and gains may owe capital-gains tax (a 1031 exchange can defer both). Figures are a year-1 estimate at your 24.0% rate — not tax advice; consult a CPA.
Schools (NCES district)
No district data.
Livability — Brattleboro
- Score
- 67/100
- State rank
- #42
- US rank
- #10223
Category grades
Schools grade is shown separately in the Schools card above.
Census & demographics
- Census place
- Brattleboro, VT
- County
- Windham County · 16,955 people
- City population
- 16,955
- Metro
- nan
- Population (ZIP)
- 16,955
- Household income
- $65,910
- Rent vs Own
- Severe rent burden
- 594.0
Population outlook (Windham County) Hauer SSP2
- Today (2025)
- 40,432 people
- By 2030
- 38,472 · -4.8%
- By 2040
- 33,954 · -16.0%
- By 2050
- 29,774 · -26.4%
- By 2075
- 22,351 · -44.7%
- By 2100
- 15,961 · -60.5%
Race, ethnicity, and origin ACS 2023
- Neighborhood character
- Predominantly White (90%)
- Race & ethnicity
- White 90% Two or more races 6% Hispanic / Latino 3% Asian 2%
- Common ancestry
- Lithuanian 7% Romanian 5% Italian 4%
- Foreign-born
- 2% · Canada
- Languages at home
- 97% English-only · Spanish 2% Other Asian/Pacific 1%
Political lean MEDSL · Windham
- 2024 margin
- Solid D (+42.7) · D 69.6% · R 26.9% · Other 3.5%
- 2008→2024 swing
- -5.4pp toward R · 2008: 48.1pp · 2024: 42.7pp
- All cycles
- 2024: D+42.7 2020: D+47.3 2016: D+42.0 2012: D+49.2 2008: D+48.1
Not yet ingested
- Civics
- —
Market trends
- HPI YoY
- ▼ -67.19%
- Current HPI
- 283.2338
- Rent YoY
- —
- Metro
- nan
- State GDP YoY
- —
- F500 in state
- 0
Price history
+52.9% since first listed3 events — show timeline
- 2026-05-12 Price Changed $535,000 PrimeMLS
- 2026-04-30 Listed $550,000 PrimeMLS
- 2023-06-16 Sold (Public Records) $350,000 Public Records
Property tax history
-3.9%/yrLatest (2024): $6,602 · +11.7% YoY. Source: county tax records.
Cash-flow waterfall
monthlySold comps — $/sqft
last 12 mo · ≤1 miLoading sold comps…