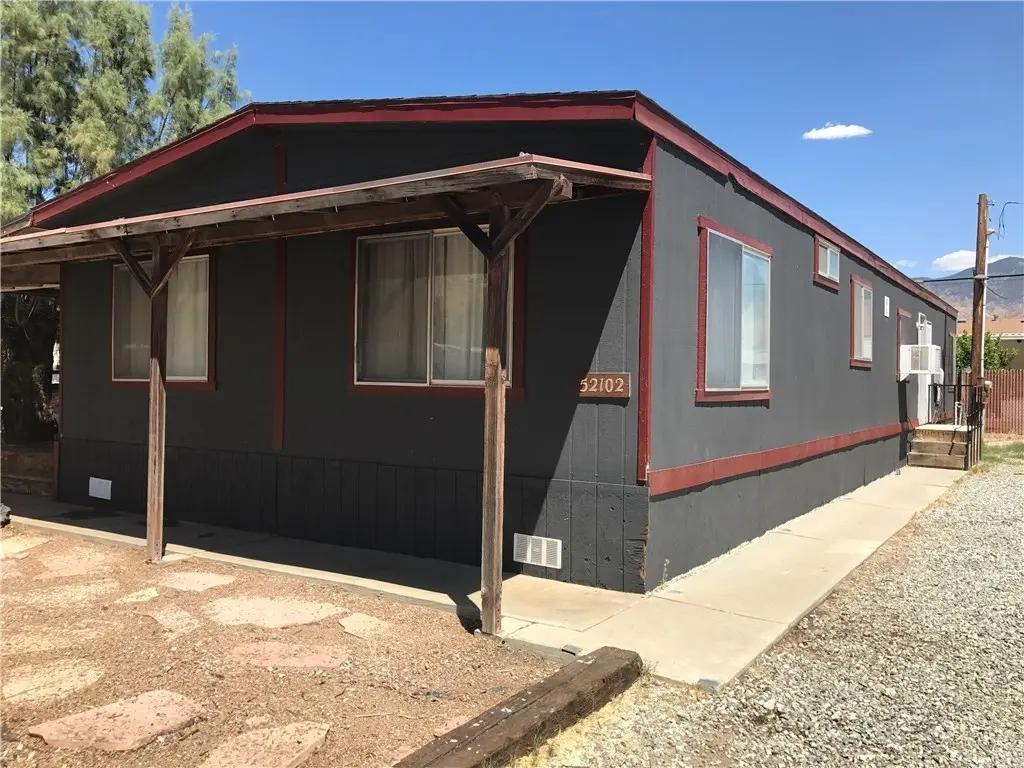
52102 Date Ave · Cabazon, CA
Flood risk 10/10 · Severe
- FEMA flood zone
- A
- Chance of flooding over 30 yrs
- 0.99%
- Est. flood insurance / yr
- $1,009 – $1,996
Fire risk 10/10 · Severe
- Est. fire insurance / yr
- $659 – $1,223
Heat risk 8/10 · Major
- Hot days now (above 100°F)
- 7 days/yr
- Hot days in 30 yrs
- 20 days/yr
Wind risk 1/10 · Minimal
- Chance of severe wind over 30 yrs
- —
Air-quality risk 8/10 · Major
- Unhealthy air days now
- 18 days/yr
- Unhealthy air days in 30 yrs
- 23 days/yr
Risk factors via First Street. Map © Google.
Why this score? — see what drove the D grade
The composite is a weighted blend of 9 inputs, each scored 0–100. Each bar is that input's sub-score; the figure is the points it added to the 100-point composite (weight × sub-score).
- ARV discount +10.4/15.0
- Cash flow +9.7/30.0
- Appreciation +6.6/10.0
- DSCR +2.8/10.0
- Livability +2.7/5.0
- Rent growth +2.5/5.0
- Condition / age +2.5/5.0
- Schools +2.0/10.0
- 1% rule +1.6/10.0
$269,900
🖨 Deal sheet (PDF) 📄 Offer letter ✓ Due diligence
Listing remarks
HUGE DOUBLE LOT with 2 parcels! NEWLY RENOVATED to include: New interior paint, New lighting, New toilet, and new flooring. This fantastic home is situated facing the beautiful San Gorgonio Mountains. Offering ample space to park whatever you like, even room for a 2nd home or ADU! The property has so much to offer from its oversized lot that is completely fenced to the large living space with 3 bedrooms, 2 baths and bonus room which could be used as a 4th bedroom, additional living space or home office. The property also has a very spacious storage shed/unit with power. So bring your family and toys. .. .parking for multiple RV's, Boats, etc.
Key facts
- Double lot
- Parking for rvs
- Fenced lot
Tags
Property features AI
Finance
- Other: Property has no accessory dwelling unit; Additional parcel referenced (parcel number 5281030346); Parcel number 528103035; Has a view
- HOA & community: Community described as valley and urban
Exterior
- Parking: Two-car garage with two garage doors; RV access and gated RV parking; Uncovered parking for about 10 vehicles; Total of approximately 12 parking spaces
- Utilities: Public/district water; Septic (type unknown)
- Home design: Manufactured house; Single-story; Faces north; Estimated living area
- Construction: Year built source: Assessor
- Exterior features: Yard; Storage building; No pool
Interior
- Kitchen: Kitchen (details not specified)
- Bedrooms: Four bedrooms on the main level
- Bathrooms: Two full bathrooms on the main level
- Heating & cooling: Central furnace heating; Wall/window cooling
- Interior features: One-level home; Entry on the main level; Bonus room; Primary suite; Laundry room
- Laundry & utility: Inside laundry in its own room
Neighborhood map
What this means for you Summary
Snapshot
- This is a 2-bed/2.0-bath manufactured listed at $270k.
Deal economics
- At list price, monthly cash flow is $-301 ($-4k/yr) — negative.
- To cash-flow at today's rent, offer at most $217k (19.7% below list).
- To meet the 1% rule (rent ≥ 1% of price), the offer needs to be $177k (34.3% below list).
- Recommended offer: $177k (34.3% below list) — sets the bar for 1% rule.
Location & tenants
- Location reads 53/100 on livability (#926 in CA) — a working-class tenant base; expect higher turnover. Strengths: housing A+, crime B; Watch: cost of living D+, employment D, amenities F.
- Banning Unified (suburban): math 15% / reading 25% proficiency, ranked #1,258 of 1,400 in CA (top 90%) — low school quality limits family demand, transient renter base, plan for 1-2y turnover; 76% free/reduced lunch — lower-income household profile, screen leases tightly.
- Zoned schools: Central Elementary (783 students, 89% FRL); Nicolet Middle (975 students, 90% FRL); Banning High (1,146 students, 87% FRL).
- Market conditions: 67 active listings in the ZIP; 9,195 units permitted in Riverside County in 2024 (1,512 in 5+ unit buildings).
Forward outlook
- In year one you build about $11k of equity ($2k loan paydown + $9k appreciation (3.2% local appreciation)).
- Riverside County population projected at +22% by 2050 — long-run rental-demand tailwind backs the buy-and-hold thesis.
- By year 4, paydown + projected appreciation supports a ~$36k cash-out refi (75% LTV) — recoverable capital for the next deal without selling this one.
Negotiation context
- It's been on market 33 days — a 3% lower offer ($262k) is reasonable based on typical stale-listing flexibility.
- 8 sale attempts since 14y ago with the ask held roughly flat each time — persistent listings suggest the price (not the market) is what's stuck; bring a comps-based counter.
- Current owner paid $92k; list at $270k implies a 192% gain — meaningful room to come down on a strong offer.
Risks & watch-outs
- Watch-outs: flood insurance adds $125/mo.
- Climate carrying-cost: in FEMA flood zone A (mandatory federal flood insurance); severe wildfire risk; extreme-heat days projected 7→20/yr by 2055 (HVAC capex compounding) — expect insurance premiums to compound above CPI over the hold.
Questions for the listing agent
- What do current leases actually rent for vs. the listed asking? Can we see a recent rent roll and the last 12 months of T-12 income?
- It's been on market 33 days. Have you received any prior offers? Is the seller open to a 34% concession, seller financing, or rate buy-down credit?
- Built in 1978 — when were the roof, HVAC, electrical panel, plumbing, and water heater last replaced?
- What's the actual annual flood-insurance premium (NFIP or private), and is the property in a SFHA with mandatory coverage?
- Is there a deadline driving the sale (1031 exchange, divorce, estate, relocation)? That informs how much negotiation room exists.
- Schools are F-rated, which usually means shorter tenancies and higher turnover. Who's the typical renter profile here, and what's been the actual vacancy rate?
- The area grade is low — what's the realistic commute time and amenity access for the typical tenant pool here? Any planned neighborhood developments (good or bad) we should know about?
- What's the average days-on-market for RENTAL listings here right now (not sales)? A rising rental-DOM trend means longer vacancies and softer asking-rent achievability than the comps imply.
- What's the recent tenant-quality profile in this submarket — average credit score on applications, eviction rate, late-payment / NSF rate, and stable-employment percentage? A property-management company in the area should have these aggregated.
- How much new for-sale + rental construction is in the pipeline within 1–3 miles? Heavy new supply typically softens prices + rents 12–24 months out; constrained supply supports both.
Investment metrics
- 1% rule
- 0.66% ✗
- Cap rate
- 5.51%
- Cash-on-cash
- -2.79%
- DSCR
- 0.88
- GRM
- 12.7
CMA / ARV
- ARV (median comp)
- $288,582
- List price
- $269,900
- Delta
- -2.97%
- Verdict
- FAIR
- Comps
- 13 within 1.0 mi
Show comp detail 5 sales within ~0.75 mi
| Address | Dist | Beds/Ba | Sqft | Sold | Price | $/sf | Match |
|---|---|---|---|---|---|---|---|
| 15035 Sunrise Ave | 0.35mi | 2/2.0 | 1,440 (0%) | 5mo | $315,000 | $219 | 80 |
| 51945 Adele Ave | 0.18mi | 2/2.0 | 1,440 (0%) | 15mo | $295,000 | $205 | 79 |
| 52076 Maxine Ave | 0.05mi | 3/2.0 (+1) | 1,344 (-7%) | 6mo | $283,000 | $211 | 77 |
| 52224 Date Ave | 0.13mi | 3/2.0 (+1) | 1,344 (-7%) | 21mo | $300,000 | $223 | 61 |
| 51663 Riza Ave | 0.50mi | 3/2.0 (+1) | 1,624 (+13%) | 19mo | $345,000 | $212 | 34 |
Match score weights: distance 35% · size 25% · config 20% · recency 20%. Top-matched comps best support the ARV.
Projected returns pro-forma
3.21% appreciation · 3.0% rent growth · sell at horizon
- IRR
- 3.7%
- Equity multiple
- 1.21×
- Total profit
- $16,215
- Equity at exit
- $124,488
- IRR
- 6.9%
- Equity multiple
- 2.07×
- Total profit
- $80,909
- Equity at exit
- $194,320
Cash invested: $75,572 (down + closing). Projections, not guarantees.
Landlord ↔ Tenant lean methodology
- Overall (STATE)
- 18 Strongly Tenant-Friendly
- State California
- 18 Strongly Tenant-Friendly · D+13
- County
- — inherits STATE
- City
- — inherits STATE
ZIP-level market 92230
- Home prices YoY
- 0.6%
- Active inventory
- 67
- Price-to-rent
- 12.7×
Monthly cashflow live
- Estimated rent
- $1,774 medium interval (Pro) →
- Mortgage (P&I)
- −$1,415
- Tax from tax record
- −$49 /mo · $590/yr
- Insurance
- −$112
- Flood insurance flood zone
- −$125 /mo · $1,502/yr
- HOA
- −$0
- Vacancy / Maint / Mgmt
- −$373
- Net cashflow
- $-301
Break-even live
Sensitivity live
| Price | -10% $-148 | -5% $-225 | +0% $-301 | +5% $-377 | +10% $-776 |
|---|---|---|---|---|---|
| Rent | -10% $-441 | -5% $-371 | +0% $-301 | +5% $-231 | +10% $-161 |
| Rate | -1.0pp $-165 | -0.5pp $-232 | base $-301 | +0.5pp $-371 | +1.0pp $-442 |
UW: 25.0% down · 7.5% · 30yr · 1.5% tax · 5.0% vac · 8.0% maint · 8.0% mgmt
Financing live
Cash to close
- Down payment
- $67,475
- Closing costs
- $8,097
- Reserves months
- —
- Total cash needed
- —
Loan-product check · same deal, 3 products live
Conventional
25% down · 7.5% · 30yr
- Down + closing
- —
- Monthly P&I
- —
- Monthly cashflow
- —
- DSCR
- —
- Eligible?
- —
Personal DTI + credit; lowest rate.
DSCR
20% down · 8.5% · 30yr
- Down + closing
- —
- Monthly P&I
- —
- Monthly cashflow
- —
- DSCR
- —
- Eligible?
- —
No personal income docs; deal must DSCR.
Hard money
10% down · 12.0% · 12mo
- Down + closing
- —
- Monthly P&I
- —
- Monthly cashflow
- —
- DSCR
- —
- Eligible?
- —
Short-term bridge; refi at stabilization.
Listing history 36 events
-
2026-06-21days on market $269,900 Active 33 DOM
-
2026-06-18days on market $269,900 Active 30 DOM
-
2026-06-17days on market $269,900 Active 29 DOM
-
2026-06-16days on market $269,900 Active 28 DOM
-
2026-06-15days on market $269,900 Active 27 DOM
-
2026-06-13days on market $269,900 Active 25 DOM
-
2026-06-13days on market $269,900 Active 24 DOM
-
2026-06-09days on market $269,900 Active 21 DOM
-
2026-06-08days on market $269,900 Active 20 DOM
-
2026-06-07days on market $269,900 Active 19 DOM
-
2026-06-04days on market $269,900 Active 16 DOM
-
2026-06-03days on market $269,900 Active 15 DOM
-
2026-06-02days on market $269,900 Active 14 DOM
-
2026-06-01days on market $269,900 Active 13 DOM
-
2026-05-31days on market $269,900 Active 12 DOM
-
2026-05-19$269,900 Active 650-char remark
-
2026-05-02historical
-
2026-03-01$280,000 Active
-
2026-02-28historical
-
2026-02-23status Active
-
2025-12-12status Pending Sale
-
2025-11-17$299,000 Active
-
2025-08-25$299,000 Active
-
2017-09-12soldstatus $92,500 Closed Sale
-
2017-08-22status Pending Sale
-
2017-07-28price $105,000
-
2017-07-06price $115,000
-
2017-06-07price $119,000
-
2017-05-31price $119,999
-
2017-05-05$130,000 Active
-
2014-02-11soldstatus $75,000 Closed
-
2014-02-11soldstatus $15,000
-
2013-12-27status Pending
-
2013-12-20$75,000 Active
-
2012-03-07historical
-
2012-02-14$75,000 Active
ⓘ Source: listings_history table (triggers on properties + properties_extension) + one-shot
backfill from property_details.listing_events for pre-trigger history.
Tax reassessment forecast CA · Resets to sale price
- Current annual tax
- $590 · $49/mo
- Projected year-2 tax
- $2,051 · $171/mo
- Expected delta
- +$1,461/yr (+$122/mo · 247.5%)
ⓘ Screening estimate from a state-policy table — verify with the county assessor before closing.
Climate risk First Street
- Flood 10/10 Extreme FEMA zone A · 99% chance over 30 yrs
- Wildfire 10/10 Extreme
- Heat 8/10 Severe 7 d/yr ≥100°F today · 20 d/yr by 30 yrs out
- Wind 1/10 Low
- Air quality 8/10 Severe 18 unhealthy d/yr today · 23 by 30 yrs out
Nearby sold comps map
Loading sold comps map…
Walkable amenities ~0.75 mi
Loading nearby amenities…
Taxation est. · year 1
- Rental income
- $21,286
- − Mortgage interest
- −$15,119
- − Property taxes
- −$590
- − Insurance
- −$2,852
- − Repairs & maintenance
- −$1,703
- − Management
- −$1,703
- − Depreciation
- −$7,852
- Taxable loss
- −$8,532
- Est. tax savings @ 24.0%
- +$2,048
- After-tax cash flow
- $-1,563/yr
For passive investors: Depreciation is non-cash, so a rental often shows a tax loss while cash-flowing — sheltering income. Rental losses are passive: they offset passive income freely, and up to $25,000/yr can offset ordinary (W-2) income if you actively participate and your MAGI is under $100k (phasing out to $0 by $150k); unused losses carry forward. On sale, claimed depreciation is recaptured at up to 25%, and gains may owe capital-gains tax (a 1031 exchange can defer both). Figures are a year-1 estimate at your 24.0% rate — not tax advice; consult a CPA.
Schools (NCES district)
- District
- Banning Unified
- NCES district ID
- 0603840
- Math proficiency
- 15% ▬ 0.00%
- Reading proficiency
- 25% ▼ -1.00%
- Median HH income
- $39,303
- Composite
- 20.12/100
- National rank
- #13850
- State rank
- #1258 of 1400 in CA
Livability — Cabazon
- Score
- 53/100
- State rank
- #926
- US rank
- #24243
Category grades
Schools grade is shown separately in the Schools card above.
Census & demographics
- Census place
- Cabazon, CA
- City population
- 2,105
- Population (ZIP)
- 2,105
Population outlook (Riverside County) Hauer SSP2
- Today (2025)
- 2,664,475 people
- By 2030
- 2,802,692 · +5.2%
- By 2040
- 3,050,904 · +14.5%
- By 2050
- 3,256,783 · +22.2%
- By 2075
- 3,655,058 · +37.2%
- By 2100
- 3,766,594 · +41.4%
Race, ethnicity, and origin ACS 2023
- Neighborhood character
- Diverse neighborhood (Simpson 0.55)
- Race & ethnicity
- Hispanic / Latino 53% White 41% Two or more races 11% Pacific Islander 1%
- Hispanic origin (detail)
- Mexican 47%
- Common ancestry
- Iranian 5% Scandinavian 2% Portuguese 2%
- Foreign-born
- 20% · Canada
- Languages at home
- 62% English-only · Spanish 37% Other Asian/Pacific 1%
Political lean MEDSL · Riverside
- 2024 margin
- Toss-up / Even · D 48.0% · R 49.3% · Other 2.6%
- 2008→2024 swing
- -3.6pp toward R · 2008: 2.3pp · 2024: -1.3pp
- All cycles
- 2024: R+1.3 2020: D+8.0 2016: D+4.3 2012: R+0.4 2008: D+2.3
Not yet ingested
- Civics
- —
Market trends
- HPI YoY
- ▲ 3.21%
- Current HPI
- 549.9479
- Rent YoY
- —
- Metro
- —
- State GDP YoY
- ▲ 3.21%
- F500 in state
- 116
Industry mix (Fortune 500 HQ in CA)
| Industry | F500 HQs | Revenue |
|---|---|---|
| Technology | 27 | $1,492B |
|
||
| Financial Services | 3 | $174B |
|
||
| Retail | 3 | $44B |
|
||
| Insurance | 3 | $26B |
|
||
| Media / Entertainment | 2 | $115B |
|
||
| Pharmaceuticals / Biotech | 2 | $62B |
|
||
Price history
+259.9% since first listed21 events — show timeline
- 2026-05-19 Listed $269,900 CRMLS
- 2026-05-02 Listing Removed — CRMLS
- 2026-03-01 Listed $280,000 CRMLS
- 2026-02-28 Listing Removed — CRMLS
- 2026-02-23 Relisted — CRMLS
- 2025-12-12 Pending — CRMLS
- 2025-11-17 Listed $299,000 CRMLS
- 2025-08-25 Listed $299,000 CRMLS
- 2017-09-12 Sold (MLS) $92,500 CRMLS
- 2017-08-22 Pending — CRMLS
- 2017-07-28 Price Changed $105,000 CRMLS
- 2017-07-06 Price Changed $115,000 CRMLS
- 2017-06-07 Price Changed $119,000 CRMLS
- 2017-05-31 Price Changed $119,999 CRMLS
- 2017-05-05 Listed $130,000 CRMLS
- 2014-02-11 Sold (Public Records) $15,000 Public Records
- 2014-02-11 Sold (MLS) $75,000 CRMLS
- 2013-12-27 Pending — CRMLS
- 2013-12-20 Listed $75,000 CRMLS
- 2012-03-07 Listing Removed — CRMLS
- 2012-02-14 Listed $75,000 CRMLS
Property tax history
+5.4%/yrLatest (2025): $590 · +1.7% YoY. Source: county tax records.
Cash-flow waterfall
monthlySold comps — $/sqft
last 12 mo · ≤1 miLoading sold comps…