95 Main St · West Mountain, CT
Flood risk 1/10 · Minimal
- FEMA flood zone
- X (unshaded)
- Chance of flooding over 30 yrs
- 0.0%
- Est. flood insurance / yr
- $473 – $860
Fire risk 3/10 · Minor
- Est. fire insurance / yr
- $691 – $1,283
Heat risk 4/10 · Minor
- Hot days now (above 98°F)
- 7 days/yr
- Hot days in 30 yrs
- 15 days/yr
Wind risk 6/10 · Moderate
- Chance of severe wind over 30 yrs
- 27.0%
Air-quality risk 4/10 · Minor
- Unhealthy air days now
- 3 days/yr
- Unhealthy air days in 30 yrs
- 6 days/yr
Risk factors via First Street. Map © Google.
Why this score? — see what drove the B grade
The composite is a weighted blend of 9 inputs, each scored 0–100. Each bar is that input's sub-score; the figure is the points it added to the 100-point composite (weight × sub-score).
- Cash flow +30.0/30.0
- 1% rule +10.0/10.0
- DSCR +10.0/10.0
- Schools +7.5/10.0
- ARV discount +6.0/15.0
- Rent growth +2.5/5.0
- Livability +2.5/5.0
- Condition / age +2.5/5.0
- Appreciation +0.0/10.0
$695,000
🖨 Deal sheet 📄 Offer letter ✓ Due diligence
Listing remarks
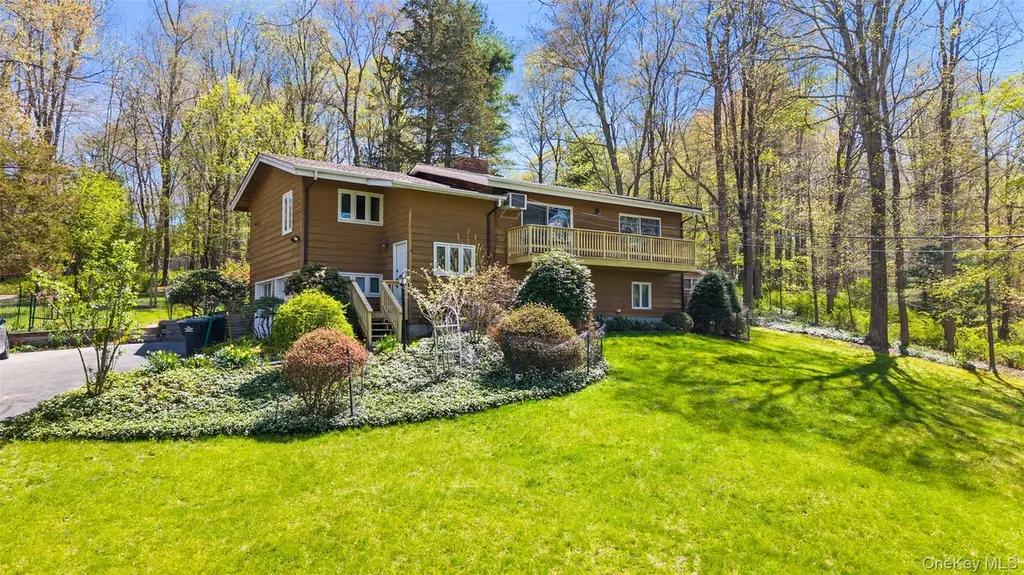
Western View. Over one park-like acre with rolling lawns, flowering plantings and towering trees. First time listed in years, distinctive Country House with elements of a classic deck house. Warm interior spaces with hardwood floors and vaulted ceilings finished in wood. Sun-filled Living Room with fireplace and doors to front deck, ideal for relaxation. Dining Room with vaulted ceiling. Country Kitchen with breakfast room and door to rear terrace. Three Bedrooms. Spacious Lower Level Recreation Room with bar. Most convenient location with easy access to Route 35, Cross River, Ridgefield and commuting arteries. A wonderful opportunity!
Key facts
- 1.07 acre lot
- 2 garage spots
- Built 1964
Property features AI
Exterior
- Parking: Attached 2-car garage (total parking for 2)
- Utilities: Electricity connected (NYSEG); Septic tank
- Home design: Single-family residence; Two levels; Updated/remodeled
- Construction: Cedar and frame construction
- Exterior features: Balcony; Garden; Mailbox; Shed(s)
Interior
- Kitchen: Oven/Range; Dishwasher; Refrigerator
- Bedrooms: Includes a first-floor bedroom
- Flooring: Wood flooring
- Bathrooms: 2 full bathrooms
- Heating & cooling: Hot water heating; Wall/window air conditioning unit(s)
- Interior features: First-floor bedroom; First-floor full bathroom; Built-in features; Ceiling fans; Pantry; Deck and patio
- Laundry & utility: Washer and dryer; Laundry located in the basement; Generator on property
Neighborhood map
What this means for you Summary
Snapshot
- This is a 3-bed/2.0-bath single-family listed at $695k.
Deal economics
- At list price, monthly cash flow is $4k ($44k/yr) — positive.
- The deal already cash-flows at list — no discount required.
- Meets the 1% rule at list price ($11k rent vs $695k).
- Recommended offer: $674k (3.0% below list) — sets the bar for market timing.
- Cap rate 12.6% vs local median 3.1% in West Mountain — top-decile yield for the area; either an underpriced asset or a hidden risk that comps aren't pricing in. Stress-test before assuming the spread holds.
Location & tenants
- Location reads: area grade B — affects rentability + tenant quality, not the cash-flow math above.
- Katonah-Lewisboro Union Free School District (suburban): math 75% / reading 82% proficiency, ranked #32 of 590 in NY (top 5%) — strong family-tenant draw, lease renewals of 3-5y typical; only 3% free/reduced lunch — higher-income household profile.
- Zoned schools: Increase Miller Elementary School (math 82% / reading 87%, grade A+, #93 of 2,108 statewide, top 6%, 489 students, 9% FRL); John Jay Middle School (math 58% / reading 79%, grade A, #94 of 729 statewide, top 13%, 662 students, 7% FRL); John Jay High School (math 98% / reading 82%, grade A+, #238 of 1,100 statewide, top 23%, 917 students, 9% FRL).
- Market conditions: 4 comparable units currently listed for rent nearby; rentals leasing fast (median 3d on market — plan ~1-2 weeks tenant-placement turnaround); 954 units permitted in Westchester County in 2024 (649 in 5+ unit buildings).
Forward outlook
- Local home prices are declining (-3.0%/yr); year-one equity from $5k of loan paydown is wiped out by about $21k of value loss. Plan a longer hold.
- Westchester County population projected at +10% by 2050 — modest demand growth; plan on rents tracking national, not racing it.
- At projected returns (-3.0% appreciation + 3.0% rent growth), your $195k cash investment doubles in ~6 years — after that, you're playing with house money.
Negotiation context
- It's been on market 45 days — a 3% lower offer ($674k) is reasonable based on typical stale-listing flexibility.
- Current owner paid $55k; list at $695k implies a 1164% gain — meaningful room to come down on a strong offer.
Risks & watch-outs
- Climate carrying-cost: major wind risk, 27% chance of damaging wind over 30y — expect insurance premiums to compound above CPI over the hold.
Questions for the listing agent
- It's been on market 45 days. Have you received any prior offers? Is the seller open to a 3% concession, seller financing, or rate buy-down credit?
- Built in 1964 — when were the roof, HVAC, electrical panel, plumbing, and water heater last replaced?
- Is there a deadline driving the sale (1031 exchange, divorce, estate, relocation)? That informs how much negotiation room exists.
- What's the average days-on-market for RENTAL listings here right now (not sales)? A rising rental-DOM trend means longer vacancies and softer asking-rent achievability than the comps imply.
- What's the recent tenant-quality profile in this submarket — average credit score on applications, eviction rate, late-payment / NSF rate, and stable-employment percentage? A property-management company in the area should have these aggregated.
- How much new for-sale + rental construction is in the pipeline within 1–3 miles? Heavy new supply typically softens prices + rents 12–24 months out; constrained supply supports both.
Investment metrics
- 1% rule
- 1.55% ✓
- Cap rate
- 12.64%
- Cash-on-cash
- 22.68%
- DSCR
- 2.01
- GRM
- 5.4
CMA / ARV
- ARV (on-the-fly)
- $672,819
- Comps found
- 3
Show comp detail 3 sales within ~0.75 mi
| Address | Dist | Beds/Ba | Sqft | Sold | Price | $/sf | Match |
|---|---|---|---|---|---|---|---|
| 16 Indian Ln | 0.12mi | 3/1.5 | 1,324 (-5%) | 8mo | $640,000 | $483 | 77 |
| 16 Gilbert St | 0.31mi | 4/1.5 (+1) | 1,396 (+0%) | 12mo | $890,000 | $638 | 68 |
| 6 Howe St | 0.21mi | 3/2.5 | 1,300 (-7%) | 19mo | $485,000 | $373 | 61 |
Match score weights: distance 35% · size 25% · config 20% · recency 20%. Top-matched comps best support the ARV.
Projected returns pro-forma
-3.0% appreciation · 3.0% rent growth · sell at horizon
- IRR
- 15.6%
- Equity multiple
- 1.63×
- Total profit
- $121,767
- Equity at exit
- $103,627
- IRR
- 24.2%
- Equity multiple
- 3.10×
- Total profit
- $408,302
- Equity at exit
- $60,091
Cash invested: $194,600 (down + closing). Projections, not guarantees.
Landlord ↔ Tenant lean methodology
- Overall (STATE)
- 27 Tenant-Leaning
- State Connecticut
- 27 Tenant-Leaning · D+7
- County
- — inherits STATE
- City
- — inherits STATE
ZIP-level market 10590
- Home prices YoY
- -30.8%
- Price-to-rent
- 5.4×
Monthly cashflow live
- Estimated rent
- $10,742 medium interval (Pro) →
- Mortgage (P&I)
- −$3,645
- Tax from tax record
- −$874 /mo · $10,489/yr
- Insurance
- −$290
- HOA
- −$0
- Vacancy / Maint / Mgmt
- −$2,256
- Net cashflow
- $3,677
Break-even live
UW: 25.0% down · 7.5% · 30yr · 1.5% tax · 5.0% vac · 8.0% maint · 8.0% mgmt
Financing live
Cash to close
- Down payment
- $173,750
- Closing costs
- $20,850
- Reserves months
- —
- Total cash needed
- —
Loan-product check · same deal, 3 products live
Conventional
25% down · 7.5% · 30yr
- Down + closing
- —
- Monthly P&I
- —
- Monthly cashflow
- —
- DSCR
- —
- Eligible?
- —
Personal DTI + credit; lowest rate.
DSCR
20% down · 8.5% · 30yr
- Down + closing
- —
- Monthly P&I
- —
- Monthly cashflow
- —
- DSCR
- —
- Eligible?
- —
No personal income docs; deal must DSCR.
Hard money
10% down · 12.0% · 12mo
- Down + closing
- —
- Monthly P&I
- —
- Monthly cashflow
- —
- DSCR
- —
- Eligible?
- —
Short-term bridge; refi at stabilization.
Rent comps 4 comps
| Address | Beds | Baths | Sqft | Rent | $/sqft | DOM | Units | Dist |
|---|---|---|---|---|---|---|---|---|
| 57 Truesdale Lake Dr South Salem, NY | 3.0 | 2.5 | 1350 | $7,000 | $5.19 | 2d | 1 | 0.57mi |
| 34 Twin Lakes Rd South Salem, NY | 3.0 | 2.0 | 1866 | $15,000 | $8.04 | 2d | 1 | 0.91mi |
| 24 Cove Rd South Salem, NY | 3.0 | 2.0 | 1600 | $18,000 | $11.25 | 2d | 1 | 1.21mi |
| 53 Cove Rd South Salem, NY | 2.0 | 1.5 | 1101 | $6,500 | $5.90 | 2d | 1 | 1.40mi |
Listing history 14 events
-
2026-06-13statusdays on market $695,000 Pending 45 DOM
-
2026-06-13days on market $695,000 Active 44 DOM
-
2026-06-10days on market $695,000 Active 42 DOM
-
2026-06-09days on market $695,000 Active 41 DOM
-
2026-06-08days on market $695,000 Active 40 DOM
-
2026-06-07days on market $695,000 Active 39 DOM
-
2026-06-05days on market $695,000 Active 36 DOM
-
2026-06-03days on market $695,000 Active 35 DOM
-
2026-06-03days on market $695,000 Active 34 DOM
-
2026-06-01days on market $695,000 Active 33 DOM
-
2026-05-31days on market $695,000 Active 32 DOM
-
2026-04-30$695,000 Active
-
2026-04-27historical $695,000
-
1973-08-01soldstatus $55,000
ⓘ Source: listings_history table (triggers on properties + properties_extension) + one-shot
backfill from property_details.listing_events for pre-trigger history.
Tax reassessment forecast CT · Partial reset (capped growth)
- Current annual tax
- $10,489 · $874/mo
- Projected year-2 tax
- $12,681 · $1,057/mo
- Expected delta
- +$2,192/yr (+$183/mo · 20.9%)
ⓘ Screening estimate from a state-policy table — verify with the county assessor before closing.
Climate risk First Street
- Flood 1/10 Low FEMA zone X (unshaded) · 0% chance over 30 yrs
- Wildfire 3/10 Moderate
- Heat 4/10 Moderate 7 d/yr ≥98°F today · 15 d/yr by 30 yrs out
- Wind 6/10 Major 27% chance of damaging wind over 30 yrs
- Air quality 4/10 Moderate 3 unhealthy d/yr today · 6 by 30 yrs out
Nearby sold comps map
Loading sold comps map…
Walkable amenities ~0.75 mi
Loading nearby amenities…
Taxation est. · year 1
- Rental income
- $128,899
- − Mortgage interest
- −$38,931
- − Property taxes
- −$10,489
- − Insurance
- −$3,475
- − Repairs & maintenance
- −$10,312
- − Management
- −$10,312
- − Depreciation
- −$20,218
- Taxable income
- $35,162
- Est. tax owed @ 24.0%
- −$8,439
- After-tax cash flow
- $35,691/yr
For passive investors: Depreciation is non-cash, so a rental often shows a tax loss while cash-flowing — sheltering income. Rental losses are passive: they offset passive income freely, and up to $25,000/yr can offset ordinary (W-2) income if you actively participate and your MAGI is under $100k (phasing out to $0 by $150k); unused losses carry forward. On sale, claimed depreciation is recaptured at up to 25%, and gains may owe capital-gains tax (a 1031 exchange can defer both). Figures are a year-1 estimate at your 24.0% rate — not tax advice; consult a CPA.
Schools (NCES district)
- District
- Katonah-Lewisboro Union Free School District
- NCES district ID
- 3616080
- Math proficiency
- 75% ▼ -8.00%
- Reading proficiency
- 82% ▲ 2.00%
- Median HH income
- $140,994
- Composite
- 75.09/100
- National rank
- #142
- State rank
- #32 of 590 in NY
Livability — West Mountain
No livability data for this city. (Only ~50 U.S. cities are tracked.)
Census & demographics
- Population (ZIP)
- 7,314
Population outlook (Westchester County) Hauer SSP2
- Today (2025)
- 1,028,035 people
- By 2030
- 1,051,636 · +2.3%
- By 2040
- 1,098,520 · +6.9%
- By 2050
- 1,136,044 · +10.5%
- By 2075
- 1,196,925 · +16.4%
- By 2100
- 1,175,147 · +14.3%
Race, ethnicity, and origin ACS 2023
- Neighborhood character
- Predominantly White (84%)
- Race & ethnicity
- White 84% Two or more races 8% Hispanic / Latino 6% Asian 4% Black 1%
- Hispanic origin (detail)
- Puerto Rican 3%
- Common ancestry
- Italian 4% Romanian 3% Scotch-Irish 2%
- Foreign-born
- 13% · Canada, South Korea, Jamaica
- Languages at home
- 90% English-only · Spanish 4% Other Indo-European 2% Korean 1%
Political lean MEDSL · Westchester
- 2024 margin
- Strong D (+26.3) · D 63.1% · R 36.9%
- 2008→2024 swing
- -1.3pp toward R · 2008: 27.6pp · 2024: 26.3pp
- All cycles
- 2024: D+26.3 2020: D+36.3 2016: D+32.8 2012: D+22.2 2008: D+27.6
Not yet ingested
- Civics
- —
Market trends
- HPI YoY
- ▼ -66.87%
- Current HPI
- 150.088
- Rent YoY
- —
- Metro
- —
- State GDP YoY
- ▲ 1.06%
- F500 in state
- 38
Industry mix (Fortune 500 HQ in CT)
| Industry | F500 HQs | Revenue |
|---|---|---|
| Industrial Machinery | 4 | $38B |
|
||
| Insurance | 3 | $71B |
|
||
| Financial Services | 2 | $25B |
|
||
| Transportation / Logistics | 2 | $18B |
|
||
| Healthcare | 1 | $247B |
|
||
| Telecommunications | 1 | $55B |
|
||
Price history
+1163.6% since first listed3 events — show timeline
- 2026-04-30 Listed $695,000 OneKey® MLS as Distributed by MLS Grid
- 2026-04-27 Coming Soon $695,000 OneKey® MLS as Distributed by MLS Grid
- 1973-08-01 Sold (Public Records) $55,000 Public Records
Property tax history
+2.7%/yrLatest (2025): $10,489 · +7.0% YoY. Source: county tax records.
Cash-flow waterfall
monthlySold comps — $/sqft
last 12 mo · ≤1 miLoading sold comps…