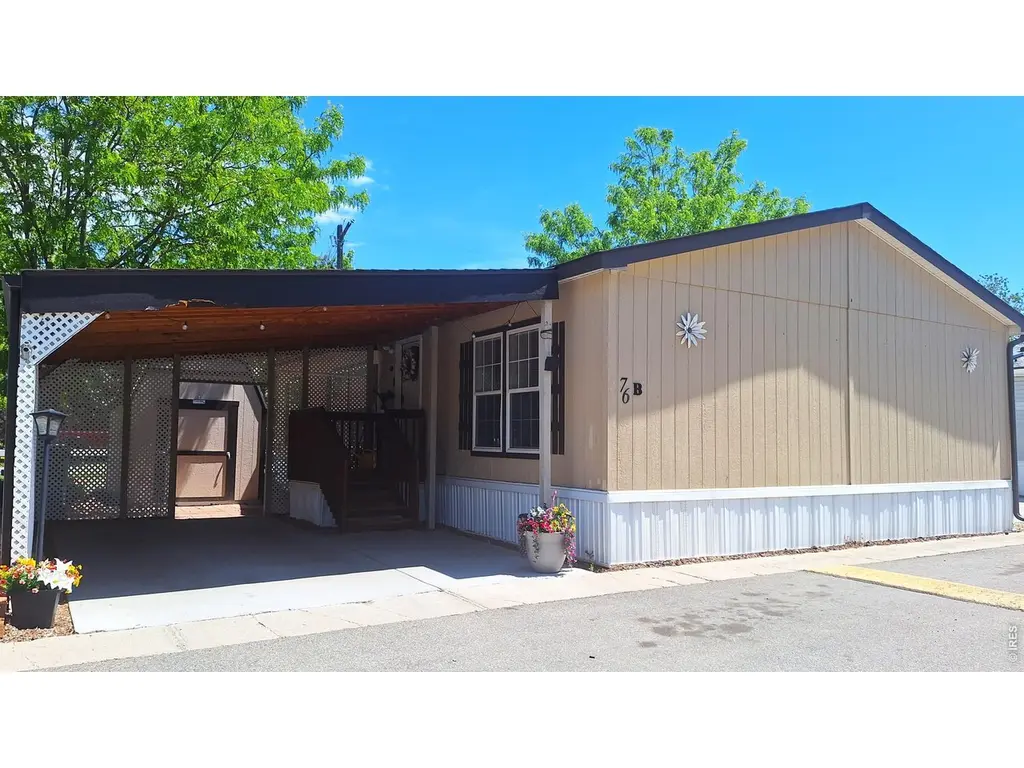
230 N 2nd St Unit 76B · Berthoud, CO
Flood risk 1/10 · Minimal
- FEMA flood zone
- X (unshaded)
- Chance of flooding over 30 yrs
- 0.0%
- Est. flood insurance / yr
- $507 – $1,088
Fire risk 6/10 · Moderate
- Est. fire insurance / yr
- $939 – $1,743
Heat risk 3/10 · Minor
- Hot days now (above 92°F)
- 7 days/yr
- Hot days in 30 yrs
- 18 days/yr
Wind risk 1/10 · Minimal
- Chance of severe wind over 30 yrs
- —
Air-quality risk 4/10 · Minor
- Unhealthy air days now
- 6 days/yr
- Unhealthy air days in 30 yrs
- 7 days/yr
Risk factors via First Street. Map © Google.
Why this score? — see what drove the B- grade
The composite is a weighted blend of 9 inputs, each scored 0–100. Each bar is that input's sub-score; the figure is the points it added to the 100-point composite (weight × sub-score).
- Cash flow +30.0/30.0
- 1% rule +10.0/10.0
- DSCR +10.0/10.0
- ARV discount +7.5/15.0
- Livability +3.5/5.0
- Schools +3.4/10.0
- Rent growth +2.5/5.0
- Condition / age +2.5/5.0
- Appreciation +0.0/10.0
$110,000
🖨 Deal sheet 📄 Offer letter ✓ Due diligence
Listing remarks MLS
This lovely home is a must see! Sellers are offering up to $6000 in a roofing credit for a new roof! This home features 3 bedrooms and 2 bathrooms, providing ample space for a family. The open floor plan allows for easy flow between the living room, dining area, and kitchen, making it perfect for entertaining guests. Two additional bedrooms provide space for guests or a home office. Best of all, the home is located within a low lot rent 0f $725 per month, making it an affordable option for those looking to live within a budget. Don't miss the opportunity to view this beautiful and affordable home.
Key facts
- Updated flooring
- Abundant cabinetry
- Modern countertops
Tags
Property features AI
Finance
- HOA & community: No association fees
Exterior
- Parking: Carport
- Utilities: City water (meter installed); Public sewer; Natural gas available (Xcel); Electricity available; Community trash service
- Home design: Manufactured in park (mobile home); Level lot entry
- Construction: Frame construction; Under carriage: HUD; Composition roof; Post and pier foundation; Built by Southern Energy
- Exterior features: Level lot; Paved; Stall shower (accessible feature)
Interior
- Kitchen: Gas Range; Dishwasher; Refrigerator; Kitchen island; Eat-in kitchen
- Bedrooms: 3 bedrooms
- Bathrooms: 2 full bathrooms
- Heating & cooling: Forced air heating; Central air conditioning
- Interior features: Eat-in kitchen; Open floorplan; Walk-in closet(s); Kitchen island; Fire alarm
- Laundry & utility: Washer; Dryer
Neighborhood map
What this means for you Summary
Snapshot
- This is a 3-bed/2.0-bath manufactured listed at $110k.
Deal economics
- At list price, monthly cash flow is $1k ($18k/yr) — positive.
- The deal already cash-flows at list — no discount required.
- Meets the 1% rule at list price ($3k rent vs $110k).
- Recommended offer: $107k (3.0% below list) — sets the bar for market timing.
- Cap rate 22.5% vs local median 3.2% in Berthoud — top-decile yield for the area; either an underpriced asset or a hidden risk that comps aren't pricing in. Stress-test before assuming the spread holds.
Location & tenants
- Location reads 69/100 on livability (#100 in CO) — a middle-class / working-renter tenant base. Strengths: employment A+, housing A+; Watch: amenities F, cost of living F, health & safety F.
- Thompson School District R-2J (suburban): math 28% / reading 48% proficiency, ranked #28 of 86 in CO (top 33%) — families likely to look elsewhere, expect single-tenant / working-renter base with shorter leases.
- Zoned schools: Ivy Stockwell Elementary School (math 47% / reading 57%, grade C-, #174 of 966 statewide, top 20%, 402 students, 21% FRL); Berthoud High School (math 37% / reading 62%, grade D, #115 of 381 statewide, top 34%, 691 students, 15% FRL).
- Zoned-school proficiency averages 51% at this address vs 38% district-wide (+13 pts) — the actual schools serving this property are materially stronger than the Thompson School District R-2J average implies; a family-tenant draw the district grade alone would hide.
- Market conditions: 357 active listings in the ZIP; 1 comparable units currently listed for rent nearby; high-income renter base; 1,786 units permitted in Larimer County in 2024 (402 in 5+ unit buildings).
Forward outlook
- Local home prices are declining (-3.0%/yr); year-one equity from $761 of loan paydown is wiped out by about $3k of value loss. Plan a longer hold.
- Larimer County population projected at +51% by 2050 — long-run rental-demand tailwind backs the buy-and-hold thesis.
- At projected returns (-3.0% appreciation + 3.0% rent growth), your $31k cash investment doubles in ~2 years — after that, you're playing with house money.
Negotiation context
- It's been on market 34 days — a 3% lower offer ($107k) is reasonable based on typical stale-listing flexibility.
- 9 sale attempts since 11y ago with the ask held roughly flat each time — persistent listings suggest the price (not the market) is what's stuck; bring a comps-based counter.
- Current owner paid $75k; 47% above their basis — modest negotiation headroom, anchor on the comps not their cost.
Risks & watch-outs
- Climate carrying-cost: major wildfire risk — expect insurance premiums to compound above CPI over the hold.
Questions for the listing agent
- It's been on market 34 days. Have you received any prior offers? Is the seller open to a 3% concession, seller financing, or rate buy-down credit?
- Is there a deadline driving the sale (1031 exchange, divorce, estate, relocation)? That informs how much negotiation room exists.
- Schools are A-rated — typically a magnet for longer-tenancy family renters. What's the average tenant stay here, and is there a school-zone premium baked into asking?
- What's the average days-on-market for RENTAL listings here right now (not sales)? A rising rental-DOM trend means longer vacancies and softer asking-rent achievability than the comps imply.
- What's the recent tenant-quality profile in this submarket — average credit score on applications, eviction rate, late-payment / NSF rate, and stable-employment percentage? A property-management company in the area should have these aggregated.
- How much new for-sale + rental construction is in the pipeline within 1–3 miles? Heavy new supply typically softens prices + rents 12–24 months out; constrained supply supports both.
Investment metrics
- 1% rule
- 2.47% ✓
- Cap rate
- 22.54%
- Cash-on-cash
- 58.04%
- DSCR
- 3.58
- GRM
- 3.4
CMA / ARV
- ARV (on-the-fly)
- $71,456
- Comps found
- 9
Show comp detail 9 sales within ~0.75 mi
| Address | Dist | Beds/Ba | Sqft | Sold | Price | $/sf | Match |
|---|---|---|---|---|---|---|---|
| 235 N 2nd St #17 | 0.15mi | 3/2.0 | 1,216 (-1%) | 2mo | $83,000 | $68 | 89 |
| 230 N 2nd St #50 | 0.00mi | 3/2.0 | 1,216 (-1%) | 12mo | $70,000 | $58 | 88 |
| 227 N 2nd St #26 | 0.09mi | 3/2.0 | 1,280 (+4%) | 8mo | $122,000 | $95 | 82 |
| 205 N 2nd St #10 | 0.09mi | 3/2.0 | 1,344 (+9%) | 3mo | $55,000 | $41 | 78 |
| 205 N 2nd St #12 | 0.09mi | 2/2.0 (-1) | 1,280 (+4%) | 9mo | $57,000 | $45 | 76 |
| 230 N 2nd St #83 | 0.00mi | 3/2.0 | 1,056 (-14%) | 1mo | $55,000 | $52 | 75 |
| 235 N 2nd St #16 | 0.15mi | 3/2.0 | 1,290 (+5%) | 17mo | $105,000 | $81 | 71 |
| 235 N 2nd St | 0.15mi | 3/2.0 | 1,290 (+5%) | 17mo | $105,000 | $81 | 71 |
| 230 N 2nd St #4 | 0.00mi | 2/1.5 (-1) | 1,056 (-14%) | 13mo | $49,000 | $46 | 58 |
Match score weights: distance 35% · size 25% · config 20% · recency 20%. Top-matched comps best support the ARV.
Projected returns pro-forma
-3.0% appreciation · 3.0% rent growth · sell at horizon
- IRR
- 56.6%
- Equity multiple
- 3.50×
- Total profit
- $77,032
- Equity at exit
- $16,401
- IRR
- 61.5%
- Equity multiple
- 7.14×
- Total profit
- $189,164
- Equity at exit
- $9,511
Cash invested: $30,800 (down + closing). Projections, not guarantees.
Landlord ↔ Tenant lean methodology
- Overall (STATE)
- 38 Tenant-Leaning
- State Colorado
- 38 Tenant-Leaning · D+4
- County
- — inherits STATE
- City
- — inherits STATE
ZIP-level market 80513
- Active inventory
- 357
- Price-to-rent
- 3.4×
Monthly cashflow live
- Estimated rent
- $2,720 medium interval (Pro) →
- Mortgage (P&I)
- −$577
- Tax from tax record
- −$37 /mo · $442/yr
- Insurance
- −$46
- HOA
- −$0
- Vacancy / Maint / Mgmt
- −$571
- Net cashflow
- $1,490
Break-even live
UW: 25.0% down · 7.5% · 30yr · 1.5% tax · 5.0% vac · 8.0% maint · 8.0% mgmt
Financing live
Cash to close
- Down payment
- $27,500
- Closing costs
- $3,300
- Reserves months
- —
- Total cash needed
- —
Loan-product check · same deal, 3 products live
Conventional
25% down · 7.5% · 30yr
- Down + closing
- —
- Monthly P&I
- —
- Monthly cashflow
- —
- DSCR
- —
- Eligible?
- —
Personal DTI + credit; lowest rate.
DSCR
20% down · 8.5% · 30yr
- Down + closing
- —
- Monthly P&I
- —
- Monthly cashflow
- —
- DSCR
- —
- Eligible?
- —
No personal income docs; deal must DSCR.
Hard money
10% down · 12.0% · 12mo
- Down + closing
- —
- Monthly P&I
- —
- Monthly cashflow
- —
- DSCR
- —
- Eligible?
- —
Short-term bridge; refi at stabilization.
Rent comps 1 comps
| Address | Beds | Baths | Sqft | Rent | $/sqft | DOM | Units | Dist |
|---|---|---|---|---|---|---|---|---|
| 1155 Summit Vista Dr Berthoud, CO | 3.0 | 2.5 | 1377 | $2,650 | $1.92 | 13d | 1 | 0.93mi |
Listing history 39 events
-
2026-06-18days on market $110,000 Active 34 DOM
-
2026-06-17days on market $110,000 Active 33 DOM
-
2026-06-16days on market $110,000 Active 32 DOM
-
2026-06-15days on market $110,000 Active 31 DOM
-
2026-06-14days on market $110,000 Active 29 DOM
-
2026-06-13days on market $110,000 Active 28 DOM
-
2026-06-10days on market $110,000 Active 26 DOM
-
2026-06-09days on market $110,000 Active 25 DOM
-
2026-06-08days on market $110,000 Active 24 DOM
-
2026-06-07days on market $110,000 Active 23 DOM
-
2026-06-03days on market $110,000 Active 19 DOM
-
2026-06-02days on market $110,000 Active 18 DOM
-
2026-06-01days on market $110,000 Active 17 DOM
-
2026-05-31days on market $110,000 Active 16 DOM
-
2026-05-30days on market $110,000 Active 15 DOM
-
2026-05-15$110,000 Active
-
2025-11-03historical
-
2025-09-15price $110,000
-
2025-08-11price $111,000
-
2025-07-09$115,000 Active
-
2024-01-03soldstatus $75,000 Closed 604-char remark
Show marketing remark (604 chars)
This lovely home is a must see! Sellers are offering up to $6000 in a roofing credit for a new roof! This home features 3 bedrooms and 2 bathrooms, providing ample space for a family. The open floor plan allows for easy flow between the living room, dining area, and kitchen, making it perfect for entertaining guests. Two additional bedrooms provide space for guests or a home office. Best of all, the home is located within a low lot rent 0f $725 per month, making it an affordable option for those looking to live within a budget. Don't miss the opportunity to view this beautiful and affordable home.
-
2023-11-14status Pending 604-char remark
Show marketing remark (604 chars)
This lovely home is a must see! Sellers are offering up to $6000 in a roofing credit for a new roof! This home features 3 bedrooms and 2 bathrooms, providing ample space for a family. The open floor plan allows for easy flow between the living room, dining area, and kitchen, making it perfect for entertaining guests. Two additional bedrooms provide space for guests or a home office. Best of all, the home is located within a low lot rent 0f $725 per month, making it an affordable option for those looking to live within a budget. Don't miss the opportunity to view this beautiful and affordable home.
-
2023-08-10soldstatus $90,000 Sold
-
2023-07-20status Pending
-
2023-07-05$89,000 Active 604-char remark
Show marketing remark (604 chars)
This lovely home is a must see! Sellers are offering up to $6000 in a roofing credit for a new roof! This home features 3 bedrooms and 2 bathrooms, providing ample space for a family. The open floor plan allows for easy flow between the living room, dining area, and kitchen, making it perfect for entertaining guests. Two additional bedrooms provide space for guests or a home office. Best of all, the home is located within a low lot rent 0f $725 per month, making it an affordable option for those looking to live within a budget. Don't miss the opportunity to view this beautiful and affordable home.
-
2023-06-03historical Active - Backup
-
2023-05-18status Active
-
2023-05-12historical Active - Backup
-
2023-04-29$90,000 Active
-
2022-12-12historical
-
2022-10-05$90,000 Active
-
2017-04-17soldstatus $80,000 Sold
-
2017-04-17soldstatus $80,000 Sold
-
2017-03-26historical Active - Backup
-
2017-03-26historical Active - Backup
-
2017-03-18$85,000 Active
-
2017-03-18$85,000 Active
-
2015-09-28soldstatus $74,900 Sold
-
2015-02-13$74,900 Active
ⓘ Source: listings_history table (triggers on properties + properties_extension) + one-shot
backfill from property_details.listing_events for pre-trigger history.
Tax reassessment forecast CO · Resets to sale price
- Current annual tax
- $442 · $37/mo
- Projected year-2 tax
- $605 · $50/mo
- Expected delta
- +$163/yr (+$14/mo · 36.8%)
ⓘ Screening estimate from a state-policy table — verify with the county assessor before closing.
Climate risk First Street
- Flood 1/10 Low FEMA zone X (unshaded) · 0% chance over 30 yrs
- Wildfire 6/10 Major
- Heat 3/10 Moderate 7 d/yr ≥92°F today · 18 d/yr by 30 yrs out
- Wind 1/10 Low
- Air quality 4/10 Moderate 6 unhealthy d/yr today · 7 by 30 yrs out
Nearby sold comps map
Loading sold comps map…
Walkable amenities ~0.75 mi
Loading nearby amenities…
Taxation est. · year 1
- Rental income
- $32,646
- − Mortgage interest
- −$6,162
- − Property taxes
- −$442
- − Insurance
- −$550
- − Repairs & maintenance
- −$2,612
- − Management
- −$2,612
- − Depreciation
- −$3,200
- Taxable income
- $17,069
- Est. tax owed @ 24.0%
- −$4,097
- After-tax cash flow
- $13,779/yr
For passive investors: Depreciation is non-cash, so a rental often shows a tax loss while cash-flowing — sheltering income. Rental losses are passive: they offset passive income freely, and up to $25,000/yr can offset ordinary (W-2) income if you actively participate and your MAGI is under $100k (phasing out to $0 by $150k); unused losses carry forward. On sale, claimed depreciation is recaptured at up to 25%, and gains may owe capital-gains tax (a 1031 exchange can defer both). Figures are a year-1 estimate at your 24.0% rate — not tax advice; consult a CPA.
Schools (NCES district)
- District
- Thompson School District R-2J
- NCES district ID
- 0805400
- Math proficiency
- 28% ▼ -7.00%
- Reading proficiency
- 48% ▬ 0.00%
- Median HH income
- $63,040
- Composite
- 34.01/100
- National rank
- #5313
- State rank
- #28 of 86 in CO
Livability — Berthoud
- Score
- 69/100
- State rank
- #100
- US rank
- #8538
Category grades
Schools grade is shown separately in the Schools card above.
Census & demographics
- Census place
- Berthoud, CO
- County
- Larimer County · 338,255 people
- City population
- 18,271
- Metro
- Fort Collins, CO
- Population (ZIP)
- 18,271
- Household income
- $126,726
- Rent vs Own
- Severe rent burden
- 55.0
Population outlook (Larimer County) Hauer SSP2
- Today (2025)
- 415,361 people
- By 2030
- 457,762 · +10.2%
- By 2040
- 542,310 · +30.6%
- By 2050
- 627,048 · +51.0%
- By 2075
- 833,722 · +100.7%
- By 2100
- 952,590 · +129.3%
Race, ethnicity, and origin ACS 2023
- Neighborhood character
- Predominantly White (86%)
- Race & ethnicity
- White 86% Hispanic / Latino 10% Two or more races 6%
- Hispanic origin (detail)
- Mexican 6% Puerto Rican 1%
- Common ancestry
- Slovak 6% Romanian 4% Lithuanian 4%
- Foreign-born
- 4% · Canada, China, Vietnam
- Languages at home
- 95% English-only · Spanish 4% Other Indo-European 1%
Political lean MEDSL · Larimer
- 2024 margin
- D (+17.6) · D 57.4% · R 39.8% · Other 2.9%
- 2008→2024 swing
- +7.9pp toward D · 2008: 9.7pp · 2024: 17.6pp
- All cycles
- 2024: D+17.6 2020: D+15.4 2016: D+4.9 2012: D+5.2 2008: D+9.7
Not yet ingested
- Civics
- —
Market trends
- HPI YoY
- ▼ -411.30%
- Current HPI
- 260.0027
- Rent YoY
- —
- Metro
- Fort Collins, CO
- State GDP YoY
- ▲ 1.95%
- F500 in state
- 14
Industry mix (Fortune 500 HQ in CO)
| Industry | F500 HQs | Revenue |
|---|---|---|
| Technology Distribution | 1 | $31B |
|
||
| Food / Agriculture | 1 | $18B |
|
||
| Packaging | 1 | $14B |
|
||
| Healthcare | 1 | $13B |
|
||
| Energy | 1 | $10B |
|
||
| Technology | 1 | $4B |
|
||
Price history
+46.9% since first listed24 events — show timeline
- 2026-05-15 Listed $110,000 IRES
- 2025-11-03 Listing Removed — IRES
- 2025-09-15 Price Changed $110,000 IRES
- 2025-08-11 Price Changed $111,000 IRES
- 2025-07-09 Listed $115,000 IRES
- 2024-01-03 Sold (MLS) $75,000 REColorado as Distributed by MLS Grid
- 2023-11-14 Pending — REColorado as Distributed by MLS Grid
- 2023-08-10 Sold (MLS) $90,000 IRES
- 2023-07-20 Pending — IRES
- 2023-07-05 Listed $89,000 REColorado as Distributed by MLS Grid
- 2023-06-03 Contingent — IRES
- 2023-05-18 Relisted — IRES
- 2023-05-12 Contingent — IRES
- 2023-04-29 Listed $90,000 IRES
- 2022-12-12 Listing Removed — IRES
- 2022-10-05 Listed $90,000 IRES
- 2017-04-17 Sold (MLS) $80,000 IRES
- 2017-04-17 Sold (MLS) $80,000 IRES
- 2017-03-26 Contingent — IRES
- 2017-03-26 Contingent — IRES
- 2017-03-18 Listed $85,000 IRES
- 2017-03-18 Listed $85,000 IRES
- 2015-09-28 Sold (MLS) $74,900 IRES
- 2015-02-13 Listed $74,900 IRES
Property tax history
+3.8%/yrLatest (2025): $442 · +359.7% YoY. Source: county tax records.
Cash-flow waterfall
monthlySold comps — $/sqft
last 12 mo · ≤1 miLoading sold comps…