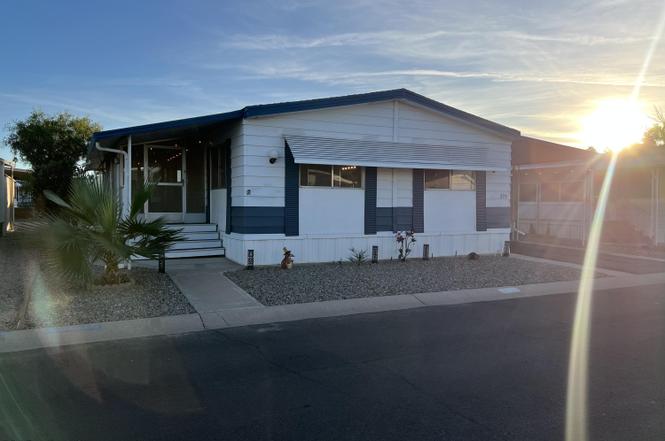
2609 W Southern Ave #379 · Tempe, AZ
Flood risk 1/10 · Minimal
- FEMA flood zone
- X (shaded)
- Chance of flooding over 30 yrs
- 0.0%
- Est. flood insurance / yr
- $507 – $1,088
Fire risk 4/10 · Minor
- Est. fire insurance / yr
- $610 – $1,132
Heat risk 9/10 · Severe
- Hot days now (above 111°F)
- 6 days/yr
- Hot days in 30 yrs
- 16 days/yr
Wind risk 1/10 · Minimal
- Chance of severe wind over 30 yrs
- —
Air-quality risk 2/10 · Minimal
- Unhealthy air days now
- 1 days/yr
- Unhealthy air days in 30 yrs
- 2 days/yr
Risk factors via First Street. Map © Google.
Why this score? — see what drove the B- grade
The composite is a weighted blend of 9 inputs, each scored 0–100. Each bar is that input's sub-score; the figure is the points it added to the 100-point composite (weight × sub-score).
- Cash flow +30.0/30.0
- 1% rule +10.0/10.0
- DSCR +10.0/10.0
- ARV discount +7.5/15.0
- Livability +3.9/5.0
- Condition / age +2.5/5.0
- Rent growth +2.1/5.0
- Schools +2.0/10.0
- Appreciation +0.0/10.0
$119,000
🖨 Deal sheet 📄 Offer letter ✓ Due diligence
Listing remarks
Welcome to this beautifully updated 2-bedroom, 2 bath home located in a sought after 55+ community, Contempo Tempe. Renovated in 2025, this move-in ready residence features a stunning modern kitchen complete with a spacious island-perfect for cooking, entertaining, or enjoying your morning coffee. The open layout offers comfortable living and dining spaces, while large windows bring in plenty of natural light. With two well appointed bedrooms and updated bathrooms, this home blends style, comfort, and convenience. Enjoy community ammenities and a relaxed lifestyle in a peaceful neighborhood close to shopping, dining, and everyday essentials.
Key facts
- Spacious island
- Large windows
- Community amenities
Tags
Property features AI
Finance
- Other: Pool spa heated
- HOA & community: Land lease (monthly); Land lease amount $790 per month; Association fee includes street maintenance; Community pool and community spa (heated); Tennis courts; Biking/walking path; Near light rail and bus stops
Exterior
- Parking: 2 covered parking spaces; 2 open parking spaces; 2 carport spaces
- Security: Security guard; Gated community; Guarded entry
- Utilities: City water; Public sewer
- Home design: Manufactured/mobile home; Leasehold ownership; Asphalt road access
- Construction: Aluminum siding; Wood frame construction; Composition roof; Building area reported by owner
- Exterior features: Screened-in patio(s); Desert front and back landscaping; Gravel/stone front and back; Private maintained road
Interior
- Kitchen: Refrigerator; Dishwasher; Garbage disposal; Kitchen island; Pantry
- Bedrooms: 2 possible bedrooms
- Flooring: Carpet; Laminate
- Bathrooms: 2 full bathrooms
- Heating & cooling: Electric heating; Central air; Ceiling fans; Programmable thermostat
- Interior features: High-speed internet; Eat-in kitchen; No interior steps; Kitchen island; Pantry; Master bedroom with full bath; Dual-pane windows
- Laundry & utility: Inside laundry
Neighborhood map
What this means for you Summary
Snapshot
- This is a 2-bed/2.0-bath manufactured listed at $119k.
Deal economics
- At list price, monthly cash flow is $652 ($8k/yr) — positive.
- The deal already cash-flows at list — no discount required.
- Meets the 1% rule at list price ($2k rent vs $119k).
- Recommended offer: $105k (12.0% below list) — sets the bar for market timing.
- Cap rate 12.9% vs local median 3.4% in Tempe — top-decile yield for the area; either an underpriced asset or a hidden risk that comps aren't pricing in. Stress-test before assuming the spread holds.
Location & tenants
- Location reads 78/100 on livability (#10 in AZ, #2,527 nationally) — a middle-class / working-renter tenant base. Strengths: amenities A+, commute A+, housing A+; Watch: schools C-, cost of living C-, health & safety D.
- Tempe School District (4258) (urban): math 17% / reading 29% proficiency, ranked #170 of 249 in AZ (top 68%) — low school quality limits family demand, transient renter base, plan for 1-2y turnover.
- Market conditions: Rents soft (-1.6%/yr); 174 active listings in the ZIP; 40 comparable units currently listed for rent nearby; rentals leasing fast (median 1d on market — plan ~1-2 weeks tenant-placement turnaround); solid renter incomes; 36,011 units permitted in Maricopa County in 2024 (12,801 in 5+ unit buildings).
Forward outlook
- Local home prices are declining (-3.0%/yr); year-one equity from $823 of loan paydown is wiped out by about $4k of value loss. Plan a longer hold.
- Maricopa County population projected at +38% by 2050 — long-run rental-demand tailwind backs the buy-and-hold thesis.
- At projected returns (-3.0% appreciation + 0.0% rent growth), your $33k cash investment doubles in ~7 years — after that, you're playing with house money.
Negotiation context
- It's been on market 156 days — a 12% lower offer ($105k) is reasonable based on typical stale-listing flexibility.
- 2 sale attempts with the ask held roughly flat each time — persistent listings suggest the price (not the market) is what's stuck; bring a comps-based counter.
Risks & watch-outs
- Climate carrying-cost: extreme-heat days projected 6→16/yr by 2055 (HVAC capex compounding) — expect insurance premiums to compound above CPI over the hold.
Questions for the listing agent
- It's been on market 156 days. Have you received any prior offers? Is the seller open to a 12% concession, seller financing, or rate buy-down credit?
- Built in 1977 — when were the roof, HVAC, electrical panel, plumbing, and water heater last replaced?
- Why hasn't it sold? Are there any deal-killer items the seller is aware of (foundation, flood, title, zoning, code violations)?
- Is there a deadline driving the sale (1031 exchange, divorce, estate, relocation)? That informs how much negotiation room exists.
- Crime grade is F in this area — have there been break-ins, vandalism, or insurance claims at this property in the last 3 years? What carrier currently insures it and at what premium?
- What's the average days-on-market for RENTAL listings here right now (not sales)? A rising rental-DOM trend means longer vacancies and softer asking-rent achievability than the comps imply.
- What's the recent tenant-quality profile in this submarket — average credit score on applications, eviction rate, late-payment / NSF rate, and stable-employment percentage? A property-management company in the area should have these aggregated.
- How much new for-sale + rental construction is in the pipeline within 1–3 miles? Heavy new supply typically softens prices + rents 12–24 months out; constrained supply supports both.
Investment metrics
- 1% rule
- 1.57% ✓
- Cap rate
- 12.87%
- Cash-on-cash
- 23.49%
- DSCR
- 2.05
- GRM
- 5.3
CMA / ARV
- ARV (on-the-fly)
- $71,980
- Comps found
- 12
Show comp detail 12 sales within ~0.75 mi
| Address | Dist | Beds/Ba | Sqft | Sold | Price | $/sf | Match |
|---|---|---|---|---|---|---|---|
| 2609 W Southern Ave #379 | 0.00mi | 2/2.0 | 1,180 (0%) | 1mo | $135,000 | $114 | 99 |
| 2609 W Southern Ave #441 | 0.00mi | 2/2.0 | 1,152 (-2%) | 3mo | $60,000 | $52 | 94 |
| 2609 W Southern Ave #117 | 0.05mi | 2/2.0 | 1,152 (-2%) | 9mo | $125,000 | $109 | 86 |
| 2609 W Southern Ave #108 | 0.05mi | 3/1.5 (+1) | 1,120 (-5%) | 2mo | $55,000 | $49 | 80 |
| 2609 W Southern Ave #335 | 0.05mi | 2/2.0 | 1,248 (+6%) | 12mo | $76,000 | $61 | 78 |
| 2401 W Southern Ave #481 | 0.30mi | 2/2.0 | 1,248 (+6%) | 2mo | $45,000 | $36 | 75 |
| 2609 W Southern Ave #398 | 0.00mi | 2/2.0 | 1,344 (+14%) | 2mo | $17,500 | $13 | 75 |
| 2401 W Southern Ave #204 | 0.23mi | 2/2.0 | 1,120 (-5%) | 9mo | $69,900 | $62 | 73 |
| 2609 W Southern Ave #90 | 0.05mi | 2/1.5 | 1,344 (+14%) | 1mo | $38,000 | $28 | 72 |
| 2401 W Southern Ave #106 | 0.29mi | 2/2.0 | 1,020 (-14%) | 3mo | $74,000 | $73 | 62 |
| 2401 W Southern Ave #110 | 0.16mi | 2/2.0 | 1,005 (-15%) | 9mo | $14,500 | $14 | 60 |
| 2401 W Southern Ave #113 | 0.29mi | 2/2.0 | 1,344 (+14%) | 5mo | $86,000 | $64 | 59 |
Match score weights: distance 35% · size 25% · config 20% · recency 20%. Top-matched comps best support the ARV.
Projected returns pro-forma
-3.0% appreciation · 0.0% rent growth · sell at horizon
- IRR
- 13.2%
- Equity multiple
- 1.50×
- Total profit
- $16,824
- Equity at exit
- $17,743
- IRR
- 19.6%
- Equity multiple
- 2.41×
- Total profit
- $47,124
- Equity at exit
- $10,289
Cash invested: $33,320 (down + closing). Projections, not guarantees.
Landlord ↔ Tenant lean methodology
- Overall (STATE)
- 87 Strongly Landlord-Friendly
- State Arizona
- 87 Strongly Landlord-Friendly · R+3
- County
- — inherits STATE
- City
- — inherits STATE
ZIP-level market 85282
- Rents YoY
- -1.6%
- Active inventory
- 174
- Price-to-rent
- 5.3×
Monthly cashflow live
- Estimated rent
- $1,867 high interval (Pro) →
- Mortgage (P&I)
- −$624
- Tax est. 1.5%
- −$149 /mo · $1,785/yr
- Insurance
- −$50
- HOA
- −$0
- Vacancy / Maint / Mgmt
- −$392
- Net cashflow
- $652
Break-even live
UW: 25.0% down · 7.5% · 30yr · 1.5% tax · 5.0% vac · 8.0% maint · 8.0% mgmt
Financing live
Cash to close
- Down payment
- $29,750
- Closing costs
- $3,570
- Reserves months
- —
- Total cash needed
- —
Loan-product check · same deal, 3 products live
Conventional
25% down · 7.5% · 30yr
- Down + closing
- —
- Monthly P&I
- —
- Monthly cashflow
- —
- DSCR
- —
- Eligible?
- —
Personal DTI + credit; lowest rate.
DSCR
20% down · 8.5% · 30yr
- Down + closing
- —
- Monthly P&I
- —
- Monthly cashflow
- —
- DSCR
- —
- Eligible?
- —
No personal income docs; deal must DSCR.
Hard money
10% down · 12.0% · 12mo
- Down + closing
- —
- Monthly P&I
- —
- Monthly cashflow
- —
- DSCR
- —
- Eligible?
- —
Short-term bridge; refi at stabilization.
Rent comps 40 comps
| Address | Beds | Baths | Sqft | Rent | $/sqft | DOM | Units | Dist |
|---|---|---|---|---|---|---|---|---|
| 2381 W Garden Dr #2365 Tempe, AZ | 3.0 | 2.0 | 1442 | $2,300 | $1.60 | 1d | 1 | 0.46mi |
| 2381 W Garden Dr #2357 Tempe, AZ | 3.0 | 2.0 | 1442 | $2,199 | $1.52 | 17d | 1 | 0.46mi |
| 4365 S Potter Dr Tempe, AZ | 2.0 | 2.0 | 1218 | $1,985 | $1.63 | 1d | 1 | 0.46mi |
| 2348 W Garden Dr Tempe, AZ | 3.0 | 2.0 | 1398 | $1,100 | $0.79 | 16d | 1 | 0.47mi |
| 4389 S Potter Dr Tempe, AZ | 3.0 | 2.5 | 1396 | $2,150 | $1.54 | 1d | 1 | 0.48mi |
| 2349 W Garden Dr Tempe, AZ | 3.0 | 2.0 | 1396 | $2,030 | $1.45 | 1d | 1 | 0.48mi |
| 1812 W Village Way Tempe, AZ | 3.0 | 1.5 | 1148 | $2,075 | $1.81 | 1d | 1 | 0.52mi |
| 1818 W Village Way Tempe, AZ | 3.0 | 2.5 | 1148 | $2,150 | $1.87 | 10d | 1 | 0.52mi |
| 2150 W Alameda Dr Tempe, AZ | 2.0 | 2.5 | 1155 | $1,899 | $1.64 | 21d | 1 | 0.56mi |
| 1688 W Village Way Tempe, AZ | 2.0 | 2.0 | 894 | $1,650 | $1.85 | 1d | 1 | 0.58mi |
| 2401 W Fremont Dr Tempe, AZ | 2.0 | 2.0 | 1074 | $1,700 | $1.58 | 1d | 1 | 0.67mi |
| 2231 W Fremont Dr Tempe, AZ | 3.0 | 2.0 | 1204 | $1,950 | $1.62 | 14d | 1 | 0.70mi |
| 2231 W Fremont Dr Tempe, AZ | 3.0 | 2.0 | 1204 | $1,950 | $1.62 | 15d | 1 | 0.70mi |
| 2231 W Fremont Dr Tempe, AZ | 3.0 | 2.0 | 1204 | $1,900 | $1.58 | 10d | 1 | 0.70mi |
| 1600 E La Jolla Dr Tempe, AZ | 1.0–3.0 | 1.0–2.0 | 881 | $1,808 | $2.05 | 1d | 26 | 0.72mi |
| 1600 W La Jolla Dr Tempe, AZ | 2.0 | 2.0 | 948 | $1,809 | $1.91 | 2d | 1 | 0.77mi |
| 1600 W La Jolla Dr Tempe, AZ | 2.0 | 2.0 | 948 | $1,776 | $1.87 | 1d | 1 | 0.77mi |
| 1440 W La Jolla Dr Tempe, AZ | 2.0 | 1.5 | 1075 | $1,950 | $1.81 | 1d | 1 | 0.77mi |
| 4328 E Saint Catherine Ave Phoenix, AZ | 3.0 | 2.0 | 1272 | $2,000 | $1.57 | 1d | 1 | 0.78mi |
| 4901 S Calle Los Cerros Dr Tempe, AZ | 1.0–2.0 | 1.0–2.0 | 868 | $1,995 | $2.30 | 1d | 3 | 0.78mi |
| 4312 E Burgess Ln Phoenix, AZ | 3.0 | 2.0 | 1025 | $1,675 | $1.63 | 1d | 1 | 0.83mi |
| 7409 S 46th St Phoenix, AZ | 3.0 | 2.0 | 1120 | $1,975 | $1.76 | 14d | 1 | 0.94mi |
| 4520 E Baseline Rd Phoenix, AZ | 1.0–3.0 | 1.0–2.0 | 757 | $1,437 | $1.90 | 1d | 24 | 0.94mi |
| 4163 E Pecan Rd Phoenix, AZ | 3.0 | 2.0 | 1182 | $1,999 | $1.69 | 14d | 1 | 0.96mi |
| 7027 S 43rd Way Phoenix, AZ | 3.0 | 2.0 | 1203 | $2,200 | $1.83 | 23d | 1 | 0.98mi |
| 4424 E Baseline Rd Phoenix, AZ | 1.0–3.0 | 1.0–2.0 | 930 | $1,550 | $1.67 | 1d | 54 | 1.03mi |
| 2520 S Plaza Dr Tempe, AZ | 2.0 | 1.0–2.0 | 940 | $1,928 | $2.05 | 1d | 15 | 1.03mi |
| 2520 S Plaza Dr Tempe, AZ | 3.0 | 1.0–2.0 | 950 | $1,901 | $2.00 | 10d | 19 | 1.03mi |
| 2155 S 55th St Tempe, AZ | 1.0–3.0 | 1.0–2.0 | 1067 | $1,952 | $1.83 | 1d | 13 | 1.06mi |
| 4005 E La Salle St Phoenix, AZ | 3.0 | 2.0 | 1149 | $1,859 | $1.62 | 19d | 1 | 1.20mi |
| 2100 S Priest Dr Unit 1386547P Tempe, AZ | 2.0–3.0 | 2.0 | 973 | $2,196 | $2.26 | 3d | 2 | 1.22mi |
| 4839 S Darrow Dr Tempe, AZ | 1.0–2.0 | 1.0–2.0 | 712 | $1,695 | $2.38 | 1d | 12 | 1.26mi |
| 6250 S 40th St Phoenix, AZ | 1.0–3.0 | 1.0–2.0 | 1041 | $1,940 | $1.86 | 1d | 16 | 1.26mi |
| 4441 E Wood St Phoenix, AZ | 3.0 | 1.5 | 1008 | $1,295 | $1.28 | 12d | 1 | 1.27mi |
| 4514 E Riverside St Phoenix, AZ | 2.0 | 1.0 | 1008 | $995 | $0.99 | 1d | 1 | 1.28mi |
| 4410 E Pueblo Ave Phoenix, AZ | 2.0 | 1.0 | 792 | $1,400 | $1.77 | 1d | 1 | 1.29mi |
| 4615 E Jones Ave Phoenix, AZ | 3.0 | 1.0 | 1008 | $1,400 | $1.39 | 1d | 1 | 1.30mi |
| 4420 E Wood St Phoenix, AZ | 2.0 | 1.5 | 1016 | $1,300 | $1.28 | 1d | 1 | 1.32mi |
| 1222 W Baseline Rd #261 Tempe, AZ | 2.0 | 2.0 | 980 | $1,400 | $1.43 | 1d | 1 | 1.34mi |
| 909 W Malibu Dr Tempe, AZ | 3.0 | 2.0 | 1092 | $1,850 | $1.69 | 1d | 1 | 1.36mi |
Listing history 12 events
-
2026-06-15status $119,000 Pending 156 DOM
-
2026-06-15days on market $119,000 Active 156 DOM
-
2026-06-13days on market $119,000 Active 154 DOM
-
2026-06-13days on market $119,000 Active 153 DOM
-
2026-06-09days on market $119,000 Active 150 DOM
-
2026-06-08days on market $119,000 Active 149 DOM
-
2026-06-07days on market $119,000 Active 148 DOM
-
2026-06-04days on market $119,000 Active 145 DOM
-
2026-06-03days on market $119,000 Active 144 DOM
-
2026-06-02days on market $119,000 Active 143 DOM
-
2026-06-01days on market $119,000 Active 142 DOM
-
2026-05-31days on market $119,000 Active 141 DOM
ⓘ Source: listings_history table (triggers on properties + properties_extension) + one-shot
backfill from property_details.listing_events for pre-trigger history.
Climate risk First Street
- Flood 1/10 Low FEMA zone X (shaded) · 0% chance over 30 yrs
- Wildfire 4/10 Moderate
- Heat 9/10 Extreme 6 d/yr ≥111°F today · 16 d/yr by 30 yrs out
- Wind 1/10 Low
- Air quality 2/10 Low 1 unhealthy d/yr today · 2 by 30 yrs out
Nearby sold comps map
Loading sold comps map…
Walkable amenities ~0.75 mi
Loading nearby amenities…
Taxation est. · year 1
- Rental income
- $22,401
- − Mortgage interest
- −$6,666
- − Property taxes
- −$1,785
- − Insurance
- −$595
- − Repairs & maintenance
- −$1,792
- − Management
- −$1,792
- − Depreciation
- −$3,462
- Taxable income
- $6,309
- Est. tax owed @ 24.0%
- −$1,514
- After-tax cash flow
- $6,314/yr
For passive investors: Depreciation is non-cash, so a rental often shows a tax loss while cash-flowing — sheltering income. Rental losses are passive: they offset passive income freely, and up to $25,000/yr can offset ordinary (W-2) income if you actively participate and your MAGI is under $100k (phasing out to $0 by $150k); unused losses carry forward. On sale, claimed depreciation is recaptured at up to 25%, and gains may owe capital-gains tax (a 1031 exchange can defer both). Figures are a year-1 estimate at your 24.0% rate — not tax advice; consult a CPA.
Schools (NCES district)
- District
- Tempe School District (4258)
- NCES district ID
- 0408310
- Math proficiency
- 17% ▼ -19.00%
- Reading proficiency
- 29% ▼ -10.00%
- Median HH income
- $43,112
- Composite
- 19.7/100
- National rank
- #8721
- State rank
- #170 of 249 in AZ
Livability — Tempe
- Score
- 78/100
- State rank
- #10
- US rank
- #2527
Category grades
Schools grade is shown separately in the Schools card above.
Census & demographics
- Census place
- Tempe, AZ
- County
- Maricopa County · 4,537,380 people
- City population
- 193,337
- Metro
- Phoenix-Mesa-Chandler, AZ
- Population (ZIP)
- 53,624
- Household income
- $79,036
- Rent vs Own
- Severe rent burden
- 2973.0
Population outlook (Maricopa County) Hauer SSP2
- Today (2025)
- 4,979,203 people
- By 2030
- 5,378,229 · +8.0%
- By 2040
- 6,156,598 · +23.6%
- By 2050
- 6,872,376 · +38.0%
- By 2075
- 8,401,270 · +68.7%
- By 2100
- 9,247,439 · +85.7%
Race, ethnicity, and origin ACS 2023
- Neighborhood character
- Diverse neighborhood (Simpson 0.65)
- Race & ethnicity
- White 52% Hispanic / Latino 25% Two or more races 13% Black 9% Asian 6% Native American 3%
- Hispanic origin (detail)
- Mexican 19%
- Common ancestry
- Italian 2% Romanian 2% Lithuanian 2%
- Foreign-born
- 11% · Canada, China, Vietnam
- Languages at home
- 79% English-only · Spanish 12% Chinese 1% Other Asian/Pacific 1%
Political lean MEDSL · Maricopa
- 2024 margin
- Toss-up / Even · D 47.7% · R 51.2% · Other 1.1%
- 2008→2024 swing
- +7.1pp toward D · 2008: -10.6pp · 2024: -3.5pp
- All cycles
- 2024: R+3.5 2020: D+2.2 2016: R+3.5 2012: R+12.0 2008: R+10.6
Not yet ingested
- Civics
- —
Market trends
- HPI YoY
- ▼ -343.77%
- Current HPI
- 353.6986
- Rent YoY
- ▼ -1.61%
- Metro
- Phoenix-Mesa-Chandler, AZ
- State GDP YoY
- ▲ 4.54%
- F500 in state
- 20
Industry mix (Fortune 500 HQ in AZ)
| Industry | F500 HQs | Revenue |
|---|---|---|
| Technology | 2 | $13B |
|
||
| Mining / Metals | 1 | $23B |
|
||
| Environmental Services | 1 | $16B |
|
||
| Metals / Steel | 1 | $14B |
|
||
| Technology Distribution | 1 | $9B |
|
||
| Homebuilding | 1 | $8B |
|
||
Price history
-7.8% since first listed4 events — show timeline
- 2026-05-27 Listed $119,000 ARMLS
- 2026-05-14 Sold (MLS) — ARMLS
- 2026-03-20 Price Changed $119,000 ARMLS
- 2025-12-28 Listed $129,000 ARMLS
Cash-flow waterfall
monthlySold comps — $/sqft
last 12 mo · ≤1 miLoading sold comps…