2954 Cardinals Ln · Chester, IL
Flood risk 9/10 · Severe
- FEMA flood zone
- X (unshaded)
- Chance of flooding over 30 yrs
- 0.99%
- Est. flood insurance / yr
- $473 – $860
Fire risk 3/10 · Minor
- Est. fire insurance / yr
- $804 – $1,492
Heat risk 5/10 · Moderate
- Hot days now (above 107°F)
- 7 days/yr
- Hot days in 30 yrs
- 21 days/yr
Wind risk 2/10 · Minimal
- Chance of severe wind over 30 yrs
- 3.0%
Air-quality risk 2/10 · Minimal
- Unhealthy air days now
- 1 days/yr
- Unhealthy air days in 30 yrs
- 1 days/yr
Risk factors via First Street. Map © Google.
Why this score? — see what drove the B- grade
The composite is a weighted blend of 9 inputs, each scored 0–100. Each bar is that input's sub-score; the figure is the points it added to the 100-point composite (weight × sub-score).
- Cash flow +30.0/30.0
- DSCR +10.0/10.0
- 1% rule +8.4/10.0
- ARV discount +7.5/15.0
- Livability +3.2/5.0
- Rent growth +2.5/5.0
- Condition / age +2.5/5.0
- Schools +1.9/10.0
- Appreciation +0.0/10.0
$94,500
🖨 Deal sheet 📄 Offer letter ✓ Due diligence
Listing remarks MLS
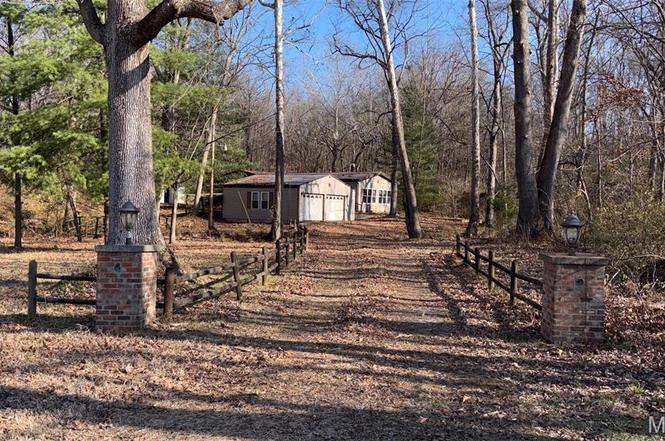
Set on 2 acres - surrounded by woods - you will love the privacy & the view - With 2 sunrooms and 2 fireplaces that make this home such a cozy place to come home to!! Seller will be removing the free standing cabinets in the kitchen/dining area and will be taking some of the hostas.
Key facts
- Hardwood flooring
- Add on rooms
- Rural water
Tags
Property features AI
Exterior
- Parking: Detached or attached 2-car garage (approx. 28 x 24)
- Utilities: Public water; Septic tank sewer; Single-phase electric
- Home design: Manufactured home (single-level); Residential property
- Construction: Vinyl siding
- Exterior features: Adjoins wooded area; Gravel road access
Interior
- Kitchen: Kitchen (17 x 12)
- Bedrooms: Three bedrooms, all on the main level; Bedroom sizes: 12 x 12; 10 x 10; 12 x 10
- Bathrooms: Two full bathrooms, both on the main level; Bathroom example size: 6 x 4
- Heating & cooling: Forced air heating; Central air conditioning
- Interior features: Living room (25 x 12); Den (12 x 15); Family room (19 x 9); Fireplace in the den; Total of 10 rooms
- Laundry & utility: Utilities: electricity connected, water available
Neighborhood map
What this means for you Summary
Snapshot
- This is a 3-bed/2.0-bath single-family listed at $94k.
Deal economics
- At list price, monthly cash flow is $314 ($4k/yr) — positive.
- The deal already cash-flows at list — no discount required.
- Meets the 1% rule at list price ($1k rent vs $94k).
- Recommended offer: $83k (12.0% below list) — sets the bar for market timing.
Location & tenants
- Location reads 63/100 on livability (#770 in IL) — a middle-class / working-renter tenant base. Strengths: crime A+, cost of living A+, housing A+; Watch: amenities F, commute F, health & safety F.
- Chester CUSD 139 (town): math 12% / reading 32% proficiency, ranked #393 of 620 in IL (top 63%) — low school quality limits family demand, transient renter base, plan for 1-2y turnover.
- Zoned schools: Chester High School (math 8% / reading 12%, grade F, #567 of 693 statewide, top 83%, 323 students, 0% FRL) — zoned schools average 0% FRL vs 46% district-wide (46 pts lower); this property's tenant base skews higher-income than the district average.
- Zoned-school proficiency averages 10% at this address vs 22% district-wide (-12 pts) — the specific schools serving this property underperform the Chester CUSD 139 average; the district grade overstates school quality for this exact location.
- Market conditions: 23 active listings in the ZIP; 3 units permitted in Randolph County in 2024 (0 in 5+ unit buildings).
Forward outlook
- Local home prices are declining (-3.0%/yr); year-one equity from $653 of loan paydown is wiped out by about $3k of value loss. Plan a longer hold.
- Randolph County population projected at -14% by 2050 — secular population decline; favor cash flow + early exit over multi-decade hold.
- At projected returns (-3.0% appreciation + 3.0% rent growth), your $26k cash investment doubles in ~9 years — after that, you're playing with house money.
Negotiation context
- It's been on market 133 days — a 12% lower offer ($83k) is reasonable based on typical stale-listing flexibility.
- 5 sale attempts since 18y ago with the ask held roughly flat each time — persistent listings suggest the price (not the market) is what's stuck; bring a comps-based counter.
Risks & watch-outs
- Watch-outs: flood insurance adds $56/mo.
- Climate carrying-cost: severe flood risk; extreme-heat days projected 7→21/yr by 2055 (HVAC capex compounding) — expect insurance premiums to compound above CPI over the hold.
Questions for the listing agent
- It's been on market 133 days. Have you received any prior offers? Is the seller open to a 12% concession, seller financing, or rate buy-down credit?
- What's the actual annual flood-insurance premium (NFIP or private), and is the property in a SFHA with mandatory coverage?
- Why hasn't it sold? Are there any deal-killer items the seller is aware of (foundation, flood, title, zoning, code violations)?
- Is there a deadline driving the sale (1031 exchange, divorce, estate, relocation)? That informs how much negotiation room exists.
- Schools are F-rated, which usually means shorter tenancies and higher turnover. Who's the typical renter profile here, and what's been the actual vacancy rate?
- What's the average days-on-market for RENTAL listings here right now (not sales)? A rising rental-DOM trend means longer vacancies and softer asking-rent achievability than the comps imply.
- What's the recent tenant-quality profile in this submarket — average credit score on applications, eviction rate, late-payment / NSF rate, and stable-employment percentage? A property-management company in the area should have these aggregated.
- How much new for-sale + rental construction is in the pipeline within 1–3 miles? Heavy new supply typically softens prices + rents 12–24 months out; constrained supply supports both.
Investment metrics
- 1% rule
- 1.34% ✓
- Cap rate
- 10.99%
- Cash-on-cash
- 16.77%
- DSCR
- 1.75
- GRM
- 6.2
CMA / ARV
No comps found within radius.
Projected returns pro-forma
-3.0% appreciation · 3.0% rent growth · sell at horizon
- IRR
- 4.6%
- Equity multiple
- 1.18×
- Total profit
- $4,740
- Equity at exit
- $14,090
- IRR
- 14.1%
- Equity multiple
- 2.14×
- Total profit
- $30,059
- Equity at exit
- $8,171
Cash invested: $26,460 (down + closing). Projections, not guarantees.
Landlord ↔ Tenant lean methodology
- Overall (STATE)
- 43 Moderately Tenant-Leaning
- State Illinois
- 43 Moderately Tenant-Leaning · D+7
- County
- — inherits STATE
- City
- — inherits STATE
ZIP-level market 62233
- Active inventory
- 23
- Price-to-rent
- 6.2×
Monthly cashflow live
- Estimated rent
- $1,267 medium interval (Pro) →
- Mortgage (P&I)
- −$496
- Tax from tax record
- −$96 /mo · $1,155/yr
- Insurance
- −$39
- Flood insurance flood zone
- −$56 /mo · $666/yr
- HOA
- −$0
- Vacancy / Maint / Mgmt
- −$266
- Net cashflow
- $314
Break-even live
UW: 25.0% down · 7.5% · 30yr · 1.5% tax · 5.0% vac · 8.0% maint · 8.0% mgmt
Financing live
Cash to close
- Down payment
- $23,625
- Closing costs
- $2,835
- Reserves months
- —
- Total cash needed
- —
Loan-product check · same deal, 3 products live
Conventional
25% down · 7.5% · 30yr
- Down + closing
- —
- Monthly P&I
- —
- Monthly cashflow
- —
- DSCR
- —
- Eligible?
- —
Personal DTI + credit; lowest rate.
DSCR
20% down · 8.5% · 30yr
- Down + closing
- —
- Monthly P&I
- —
- Monthly cashflow
- —
- DSCR
- —
- Eligible?
- —
No personal income docs; deal must DSCR.
Hard money
10% down · 12.0% · 12mo
- Down + closing
- —
- Monthly P&I
- —
- Monthly cashflow
- —
- DSCR
- —
- Eligible?
- —
Short-term bridge; refi at stabilization.
Listing history 11 events
-
2026-04-23historical
-
2026-04-16historical Active Under Contract
-
2026-04-03status Active
-
2026-02-08historical Active Under Contract
-
2026-01-13Active
-
2026-01-13$94,500 Active
-
2008-05-30soldstatus 287-char remark
Show marketing remark (287 chars)
Set on 2 acres - surrounded by woods - you will love the privacy & the view - With 2 sunrooms and 2 fireplaces that make this home such a cozy place to come home to!! Seller will be removing the free standing cabinets in the kitchen/dining area and will be taking some of the hostas.
-
2008-05-30soldstatus $115,000
Show marketing remark (287 chars)
Set on 2 acres - surrounded by woods - you will love the privacy & the view - With 2 sunrooms and 2 fireplaces that make this home such a cozy place to come home to!! Seller will be removing the free standing cabinets in the kitchen/dining area and will be taking some of the hostas.
-
2008-03-05$115,000 287-char remark
Show marketing remark (287 chars)
Set on 2 acres - surrounded by woods - you will love the privacy & the view - With 2 sunrooms and 2 fireplaces that make this home such a cozy place to come home to!! Seller will be removing the free standing cabinets in the kitchen/dining area and will be taking some of the hostas.
ⓘ Source: listings_history table (triggers on properties + properties_extension) + one-shot
backfill from property_details.listing_events for pre-trigger history.
Tax reassessment forecast IL · Partial reset (capped growth)
- Current annual tax
- $1,155 · $96/mo
- Projected year-2 tax
- $1,650 · $137/mo
- Expected delta
- +$495/yr (+$41/mo · 42.9%)
ⓘ Screening estimate from a state-policy table — verify with the county assessor before closing.
Climate risk First Street
- Flood 9/10 Extreme FEMA zone X (unshaded) · 99% chance over 30 yrs
- Wildfire 3/10 Moderate
- Heat 5/10 Major 7 d/yr ≥107°F today · 21 d/yr by 30 yrs out
- Wind 2/10 Low 3% chance of damaging wind over 30 yrs
- Air quality 2/10 Low 1 unhealthy d/yr today · 1 by 30 yrs out
Nearby sold comps map
Loading sold comps map…
Walkable amenities ~0.75 mi
Loading nearby amenities…
Taxation est. · year 1
- Rental income
- $15,204
- − Mortgage interest
- −$5,293
- − Property taxes
- −$1,155
- − Insurance
- −$1,139
- − Repairs & maintenance
- −$1,216
- − Management
- −$1,216
- − Depreciation
- −$2,749
- Taxable income
- $2,435
- Est. tax owed @ 24.0%
- −$584
- After-tax cash flow
- $3,186/yr
For passive investors: Depreciation is non-cash, so a rental often shows a tax loss while cash-flowing — sheltering income. Rental losses are passive: they offset passive income freely, and up to $25,000/yr can offset ordinary (W-2) income if you actively participate and your MAGI is under $100k (phasing out to $0 by $150k); unused losses carry forward. On sale, claimed depreciation is recaptured at up to 25%, and gains may owe capital-gains tax (a 1031 exchange can defer both). Figures are a year-1 estimate at your 24.0% rate — not tax advice; consult a CPA.
Schools (NCES district)
- District
- Chester CUSD 139
- NCES district ID
- 1709810
- Math proficiency
- 12% ▼ -5.00%
- Reading proficiency
- 32% ▼ -9.00%
- Median HH income
- $47,390
- Composite
- 19.24/100
- National rank
- #8807
- State rank
- #393 of 620 in IL
Livability — Chester
- Score
- 63/100
- State rank
- #770
- US rank
- #15436
Category grades
Schools grade is shown separately in the Schools card above.
Census & demographics
- Population (ZIP)
- 8,233
Population outlook (Randolph County) Hauer SSP2
- Today (2025)
- 31,417 people
- By 2030
- 30,519 · -2.9%
- By 2040
- 28,841 · -8.2%
- By 2050
- 27,150 · -13.6%
- By 2075
- 22,569 · -28.2%
- By 2100
- 16,584 · -47.2%
Race, ethnicity, and origin ACS 2023
- Neighborhood character
- Predominantly White (73%)
- Race & ethnicity
- White 73% Black 21% Hispanic / Latino 5% Two or more races 2%
- Common ancestry
- Lithuanian 4% Serbian 3% Italian 3%
- Foreign-born
- 1% · Canada
- Languages at home
- 97% English-only · Spanish 3%
Political lean MEDSL · Randolph
- 2024 margin
- Solid R (+50.0) · D 24.1% · R 74.1% · Other 1.7%
- 2008→2024 swing
- -49.0pp toward R · 2008: -0.9pp · 2024: -50.0pp
- All cycles
- 2024: R+50.0 2020: R+50.2 2016: R+46.8 2012: R+17.6 2008: R+0.9
Not yet ingested
- Civics
- —
Market trends
- HPI YoY
- ▼ -68.79%
- Current HPI
- 119.2269
- Rent YoY
- —
- Metro
- —
- State GDP YoY
- ▲ 1.59%
- F500 in state
- 60
Industry mix (Fortune 500 HQ in IL)
| Industry | F500 HQs | Revenue |
|---|---|---|
| Insurance | 4 | $201B |
|
||
| Consumer Goods | 4 | $87B |
|
||
| Industrial Machinery | 3 | $64B |
|
||
| Healthcare | 2 | $55B |
|
||
| Retail / Pharmacy | 1 | $148B |
|
||
| Agriculture / Food | 1 | $86B |
|
||
Price history
-17.8% since first listed11 events — show timeline
- 2026-04-23 Listing Removed — MRED as Distributed by MLS Grid
- 2026-04-16 Contingent — MARIS as Distributed by MLS Grid
- 2026-04-03 Relisted — MARIS as Distributed by MLS Grid
- 2026-02-08 Contingent — MARIS as Distributed by MLS Grid
- 2026-01-13 Listed $94,500 MARIS as Distributed by MLS Grid
- 2026-01-13 Listed — MRED as Distributed by MLS Grid
- 2008-05-30 Sold (Public Records) $115,000 Public Records
- 2008-05-30 Sold (MLS) — RMLSA as Distributed by MLS Grid
- 2008-05-30 Sold (MLS) — MRED as Distributed by MLS Grid
- 2008-03-05 Listed $115,000 RMLSA as Distributed by MLS Grid
- 2008-03-05 Listed $115,000 MRED as Distributed by MLS Grid
Property tax history
-1.2%/yrLatest (2024): $1,155 · -2.1% YoY. Source: county tax records.
Cash-flow waterfall
monthlySold comps — $/sqft
last 12 mo · ≤1 miLoading sold comps…