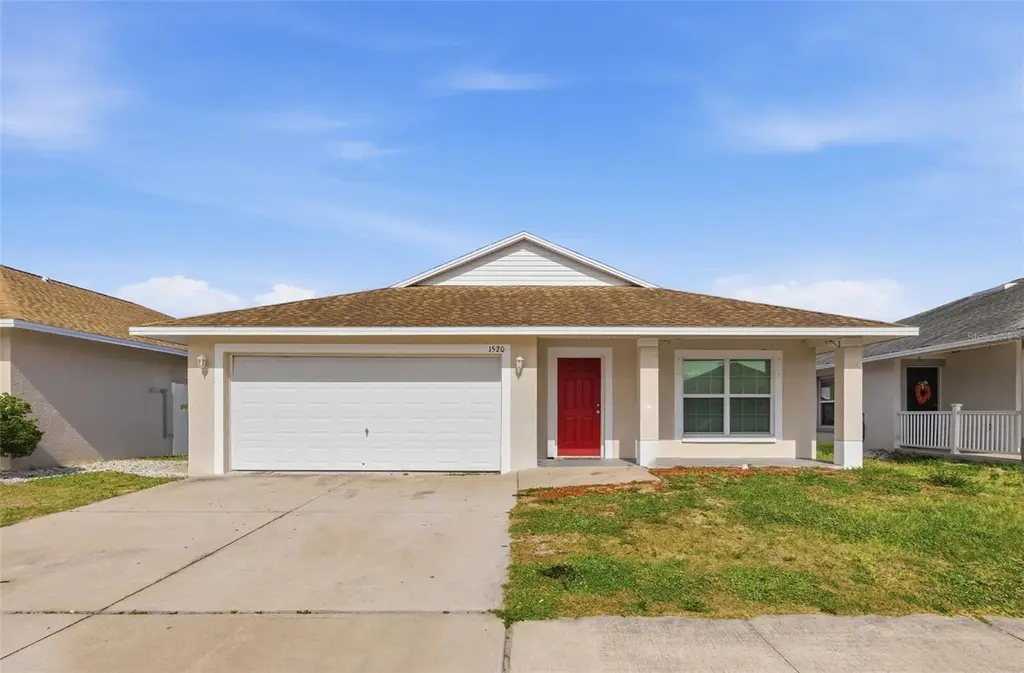
1520 9th St SE · Ruskin, FL
Flood risk 1/10 · Minimal
- FEMA flood zone
- X (unshaded)
- Chance of flooding over 30 yrs
- 0.0%
- Est. flood insurance / yr
- $507 – $1,088
Fire risk 3/10 · Minor
- Est. fire insurance / yr
- $947 – $1,759
Heat risk 10/10 · Severe
- Hot days now (above 107°F)
- 7 days/yr
- Hot days in 30 yrs
- 28 days/yr
Wind risk 10/10 · Severe
- Chance of severe wind over 30 yrs
- 99.0%
Air-quality risk 3/10 · Minor
- Unhealthy air days now
- 3 days/yr
- Unhealthy air days in 30 yrs
- 3 days/yr
Risk factors via First Street. Map © Google.
Why this score? — see what drove the B- grade
The composite is a weighted blend of 9 inputs, each scored 0–100. Each bar is that input's sub-score; the figure is the points it added to the 100-point composite (weight × sub-score).
- Cash flow +28.0/30.0
- DSCR +10.0/10.0
- 1% rule +8.2/10.0
- ARV discount +7.5/15.0
- Schools +4.2/10.0
- Livability +3.6/5.0
- Rent growth +2.7/5.0
- Condition / age +2.5/5.0
- Appreciation +0.0/10.0
$199,900
🖨 Deal sheet (PDF) 📄 Offer letter ✓ Due diligence
Listing remarks
One or more photo(s) has been virtually staged. 1520 9th St SE, Ruskin, is a 4 bedroom, 2 bathroom single family home with 1,580 square feet and a 2 car garage in an established Ruskin community. Built in 2018, this home needs kitchen cabinets replaced, flooring completed in the living room, flooring finished in the primary bedroom, bathroom repair, and the garage door repaired so it opens properly. Even with those items, this is still a strong opportunity for a buyer who wants a newer home with a clear and manageable repair list instead of a full renovation. The home is vacant, which makes it easier to schedule work, complete updates, and move in without delay. What makes this property esp
Key facts
- Public sewer
- Heat pump
- City water
Tags
Property features AI
Finance
- Other: Lot approximately 50 x 100 (about 0.11 acres)
- HOA & community: HOA managed by Wise Property Mgmt; HOA required — $65/month ($780 annually); Community clubhouse; Community playground; Community pool; Pets allowed
Exterior
- Parking: Driveway; Attached 2-car garage
- Utilities: Public water; Public sewer; Other utilities
- Home design: Single-family residence; One story; Faces west; Residential zoning (PD); Homestead
- Construction: Stucco construction; Shingle roof; Slab foundation; Built as a single-story; Living area ~1580 sq ft
- Exterior features: Front porch; Patio; Sidewalk
Interior
- Kitchen: Range
- Bedrooms: 4 bedrooms
- Flooring: Carpet; Other flooring
- Bathrooms: 2 full bathrooms
- Heating & cooling: Central heating; Central air conditioning
- Interior features: Ceiling fans; Sliding doors
- Laundry & utility: Laundry area (other)
Neighborhood map
What this means for you Summary
Snapshot
- This is a 4-bed/2.0-bath single-family listed at $200k.
Deal economics
- At list price, monthly cash flow is $625 ($7k/yr) — positive.
- The deal already cash-flows at list — no discount required.
- Meets the 1% rule at list price ($3k rent vs $200k).
- Cap rate 10.0% vs local median 4.7% in Ruskin — top-decile yield for the area; either an underpriced asset or a hidden risk that comps aren't pricing in. Stress-test before assuming the spread holds.
Location & tenants
- Location reads 71/100 on livability (#392 in FL) — a middle-class / working-renter tenant base. Strengths: cost of living A+, housing A+, commute B+; Watch: amenities F, health & safety F.
- Hillsborough (suburban): math 47% / reading 50% proficiency, ranked #41 of 73 in FL (top 56%) — families likely to look elsewhere, expect single-tenant / working-renter base with shorter leases.
- Zoned schools: Ruskin Elementary School (math 30% / reading 23%, grade F, #2,009 of 2,144 statewide, top 94%, 781 students, 77% FRL); Shields Middle School (math 29% / reading 27%, grade F, #486 of 571 statewide, top 86%, 1,867 students, 68% FRL); Lennard High School (math 30% / reading 46%, grade F, #328 of 667 statewide, top 50%, 2,404 students, 47% FRL).
- Zoned-school proficiency averages 31% at this address vs 48% district-wide (-18 pts) — the specific schools serving this property underperform the Hillsborough average; the district grade overstates school quality for this exact location.
- Market conditions: Rents flat; 497 active listings in the ZIP; 16 comparable units currently listed for rent nearby; rentals leasing fast (median 13d on market — plan ~1-2 weeks tenant-placement turnaround); 9,053 units permitted in Hillsborough County in 2024 (4,555 in 5+ unit buildings).
- This rent runs 44% of the median local income ($72k/yr) — at the standard rent-burdened threshold; future hikes will face affordability resistance.
Forward outlook
- Local home prices are declining (-3.0%/yr); year-one equity from $1k of loan paydown is wiped out by about $6k of value loss. Plan a longer hold.
- Hillsborough County population projected at +37% by 2050 — long-run rental-demand tailwind backs the buy-and-hold thesis.
Negotiation context
- Only 3 days on market — expect competitive offers; lowballing is unlikely to land.
Risks & watch-outs
- Climate carrying-cost: severe wind risk, 99% chance of damaging wind over 30y; extreme-heat days projected 7→28/yr by 2055 (HVAC capex compounding) — expect insurance premiums to compound above CPI over the hold.
Questions for the listing agent
- What does the HOA fee cover, when was the last increase, and are there any pending special assessments or reserve-fund shortfalls?
- Is there a deadline driving the sale (1031 exchange, divorce, estate, relocation)? That informs how much negotiation room exists.
- Schools are F-rated, which usually means shorter tenancies and higher turnover. Who's the typical renter profile here, and what's been the actual vacancy rate?
- What's the average days-on-market for RENTAL listings here right now (not sales)? A rising rental-DOM trend means longer vacancies and softer asking-rent achievability than the comps imply.
- What's the recent tenant-quality profile in this submarket — average credit score on applications, eviction rate, late-payment / NSF rate, and stable-employment percentage? A property-management company in the area should have these aggregated.
- How much new for-sale + rental construction is in the pipeline within 1–3 miles? Heavy new supply typically softens prices + rents 12–24 months out; constrained supply supports both.
Investment metrics
- 1% rule
- 1.32% ✓
- Cap rate
- 10.04%
- Cash-on-cash
- 13.39%
- DSCR
- 1.60
- GRM
- 6.3
CMA / ARV
No comps found within radius.
Projected returns pro-forma
-3.0% appreciation · 0.9% rent growth · sell at horizon
- IRR
- 1.0%
- Equity multiple
- 1.04×
- Total profit
- $2,023
- Equity at exit
- $29,806
- IRR
- 8.3%
- Equity multiple
- 1.57×
- Total profit
- $31,881
- Equity at exit
- $17,284
Cash invested: $55,972 (down + closing). Projections, not guarantees.
Landlord ↔ Tenant lean methodology
- Overall (STATE)
- 87 Strongly Landlord-Friendly
- State Florida
- 87 Strongly Landlord-Friendly · R+3
- County
- — inherits STATE
- City
- — inherits STATE
ZIP-level market 33570
- Home prices YoY
- -28.8%
- Rents YoY
- 0.9%
- Active inventory
- 497
- Price-to-rent
- 6.3×
Monthly cashflow live
- Estimated rent
- $2,636 high interval (Pro) →
- Mortgage (P&I)
- −$1,048
- Tax from tax record
- −$261 /mo · $3,133/yr
- Insurance
- −$83
- HOA
- −$65
- Vacancy / Maint / Mgmt
- −$554
- Net cashflow
- $625
Break-even live
Sensitivity live
| Price | -10% $738 | -5% $681 | +0% $625 | +5% $568 | +10% $511 |
|---|---|---|---|---|---|
| Rent | -10% $416 | -5% $521 | +0% $625 | +5% $729 | +10% $833 |
| Rate | -1.0pp $725 | -0.5pp $675 | base $625 | +0.5pp $573 | +1.0pp $520 |
UW: 25.0% down · 7.5% · 30yr · 1.5% tax · 5.0% vac · 8.0% maint · 8.0% mgmt
Financing live
Cash to close
- Down payment
- $49,975
- Closing costs
- $5,997
- Reserves months
- —
- Total cash needed
- —
Loan-product check · same deal, 3 products live
Conventional
25% down · 7.5% · 30yr
- Down + closing
- —
- Monthly P&I
- —
- Monthly cashflow
- —
- DSCR
- —
- Eligible?
- —
Personal DTI + credit; lowest rate.
DSCR
20% down · 8.5% · 30yr
- Down + closing
- —
- Monthly P&I
- —
- Monthly cashflow
- —
- DSCR
- —
- Eligible?
- —
No personal income docs; deal must DSCR.
Hard money
10% down · 12.0% · 12mo
- Down + closing
- —
- Monthly P&I
- —
- Monthly cashflow
- —
- DSCR
- —
- Eligible?
- —
Short-term bridge; refi at stabilization.
Rent comps 16 comps
| Address | Beds | Baths | Sqft | Rent | $/sqft | DOM | Units | Dist |
|---|---|---|---|---|---|---|---|---|
| 1251 9th St SE Ruskin, FL | 3.0–4.0 | 2.0–2.5 | 1650 | $3,500 | $2.12 | 6d | 1 | 0.26mi |
| 1105 Windton Oak Dr Ruskin, FL | 4.0 | 2.5 | 2073 | $2,399 | $1.16 | 26d | 1 | 0.49mi |
| 1119 Windton Oak Dr Ruskin, FL | 4.0 | 2.5 | 2041 | $2,325 | $1.14 | 3d | 1 | 0.52mi |
| 2306 Lawrence Hall St Ruskin, FL | 4.0 | 2.0 | 1731 | $2,100 | $1.21 | 12d | 1 | 0.80mi |
| 2205 Roanoke Springs Dr Ruskin, FL | 4.0 | 3.0 | 1790 | $2,000 | $1.12 | 26d | 1 | 0.83mi |
| 2222 Roanoke Springs Dr Ruskin, FL | 4.0 | 3.0 | 1790 | $2,250 | $1.26 | 26d | 1 | 0.84mi |
| 2235 Colville Chase Dr Ruskin, FL | 4.0 | 3.0 | 1936 | $2,400 | $1.24 | 26d | 1 | 0.92mi |
| 1029 Spotted Egret Loop Ruskin, FL | 3.0 | 2.5 | 1463 | $2,150 | $1.47 | 6d | 1 | 0.93mi |
| 1501 21st St SE Ruskin, FL | 4.0 | 2.0 | 1618 | $2,155 | $1.33 | 5d | 1 | 1.00mi |
| 2025 Peaceful Palm St Ruskin, FL | 4.0 | 2.0 | 1606 | $2,600 | $1.62 | 16d | 1 | 1.07mi |
| 2345 Roanoke Springs Dr Ruskin, FL | 4.0 | 3.0 | 1801 | $2,250 | $1.25 | 6d | 1 | 1.12mi |
| 213 6th Ave SW Ruskin, FL | 3.0 | 1.0 | 1620 | $1,795 | $1.11 | 0d | 1 | 1.22mi |
| 2304 Pleasure Run Dr Ruskin, FL | 3.0 | 2.0 | 1276 | $1,970 | $1.54 | 5d | 1 | 1.24mi |
| 149 Cascade Bend Dr Ruskin, FL | 3.0 | 2.0 | 1555 | $2,400 | $1.54 | 26d | 1 | 1.29mi |
| 320 Blue Point Dr Ruskin, FL | 4.0 | 2.0 | 1767 | $2,145 | $1.21 | 4d | 1 | 1.39mi |
| 424 Newmont Cir Ruskin, FL | 3.0 | 3.0 | 1707 | $1,950 | $1.14 | 26d | 1 | 1.40mi |
HOA detail
- Monthly dues
- $65 · $780/yr
Listing history 2 events
-
2026-05-04status Pending
-
2026-05-01$199,900 Active
ⓘ Source: listings_history table (triggers on properties + properties_extension) + one-shot
backfill from property_details.listing_events for pre-trigger history.
Tax reassessment forecast FL · Resets to sale price
- Current annual tax
- $3,133 · $261/mo
- Projected year-2 tax
- $3,133 · $261/mo
- Expected delta
- $0/yr ($0/mo · 0.0%)
ⓘ Screening estimate from a state-policy table — verify with the county assessor before closing.
Climate risk First Street
- Flood 1/10 Low FEMA zone X (unshaded) · 0% chance over 30 yrs
- Wildfire 3/10 Moderate
- Heat 10/10 Extreme 7 d/yr ≥107°F today · 28 d/yr by 30 yrs out
- Wind 10/10 Extreme 99% chance of damaging wind over 30 yrs
- Air quality 3/10 Moderate 3 unhealthy d/yr today · 3 by 30 yrs out
Nearby sold comps map
Loading sold comps map…
Walkable amenities ~0.75 mi
Loading nearby amenities…
Taxation est. · year 1
- Rental income
- $31,630
- − Mortgage interest
- −$11,198
- − Property taxes
- −$3,133
- − Insurance
- −$1,000
- − Repairs & maintenance
- −$2,530
- − Management
- −$2,530
- − HOA
- −$780
- − Depreciation
- −$5,815
- Taxable income
- $4,644
- Est. tax owed @ 24.0%
- −$1,115
- After-tax cash flow
- $6,381/yr
For passive investors: Depreciation is non-cash, so a rental often shows a tax loss while cash-flowing — sheltering income. Rental losses are passive: they offset passive income freely, and up to $25,000/yr can offset ordinary (W-2) income if you actively participate and your MAGI is under $100k (phasing out to $0 by $150k); unused losses carry forward. On sale, claimed depreciation is recaptured at up to 25%, and gains may owe capital-gains tax (a 1031 exchange can defer both). Figures are a year-1 estimate at your 24.0% rate — not tax advice; consult a CPA.
Schools (NCES district)
- District
- Hillsborough
- NCES district ID
- 1200870
- Math proficiency
- 47% ▼ -8.00%
- Reading proficiency
- 50% ▼ -4.00%
- Median HH income
- $50,622
- Composite
- 41.6/100
- National rank
- #3435
- State rank
- #41 of 73 in FL
Livability — Ruskin
- Score
- 71/100
- State rank
- #392
- US rank
- #6879
Category grades
Schools grade is shown separately in the Schools card above.
Census & demographics
- Census place
- Ruskin, FL
- County
- Hillsborough County · 1,540,968 people
- City population
- 33,319
- Metro
- Tampa-St. Petersburg-Clearwater, FL
- Population (ZIP)
- 33,319
- Household income
- $72,172
- Rent vs Own
- Severe rent burden
- 611.0
Population outlook (Hillsborough County) Hauer SSP2
- Today (2025)
- 1,607,022 people
- By 2030
- 1,733,968 · +7.9%
- By 2040
- 1,979,565 · +23.2%
- By 2050
- 2,203,427 · +37.1%
- By 2075
- 2,667,893 · +66.0%
- By 2100
- 2,891,558 · +79.9%
Race, ethnicity, and origin ACS 2023
- Neighborhood character
- Diverse neighborhood (Simpson 0.69)
- Race & ethnicity
- White 40% Hispanic / Latino 32% Black 23% Two or more races 13% Asian 2%
- Hispanic origin (detail)
- Mexican 16% Puerto Rican 6% Cuban 1% Dominican 4%
- Common ancestry
- Italian 2% Romanian 2% Hispanic 2%
- Foreign-born
- 13% · Canada, Jamaica
- Languages at home
- 72% English-only · Spanish 23% French/Haitian/Cajun 2%
Political lean MEDSL · Hillsborough
- 2024 margin
- Toss-up / Even · D 47.8% · R 50.9% · Other 1.3%
- 2008→2024 swing
- -10.2pp toward R · 2008: 7.1pp · 2024: -3.1pp
- All cycles
- 2024: R+3.1 2020: D+6.9 2016: D+6.8 2012: D+6.7 2008: D+7.1
Not yet ingested
- Civics
- —
Market trends
- HPI YoY
- ▼ -112.10%
- Current HPI
- 277.8257
- Rent YoY
- ▲ 0.90%
- Metro
- Tampa-St. Petersburg-Clearwater, FL
- State GDP YoY
- ▲ 3.28%
- F500 in state
- 36
Industry mix (Fortune 500 HQ in FL)
| Industry | F500 HQs | Revenue |
|---|---|---|
| Industrial Technology | 2 | $29B |
|
||
| Insurance | 2 | $17B |
|
||
| Retail | 1 | $60B |
|
||
| Technology Distribution | 1 | $58B |
|
||
| Homebuilding | 1 | $35B |
|
||
| Technology Manufacturing | 1 | $35B |
|
||
Price history
2 events — show timeline
- 2026-05-04 Pending — Stellar MLS as Distributed by MLS Grid
- 2026-05-01 Listed $199,900 Stellar MLS as Distributed by MLS Grid
Property tax history
+16.7%/yrLatest (2025): $3,133 · +11.3% YoY. Source: county tax records.
Cash-flow waterfall
monthlySold comps — $/sqft
last 12 mo · ≤1 miLoading sold comps…