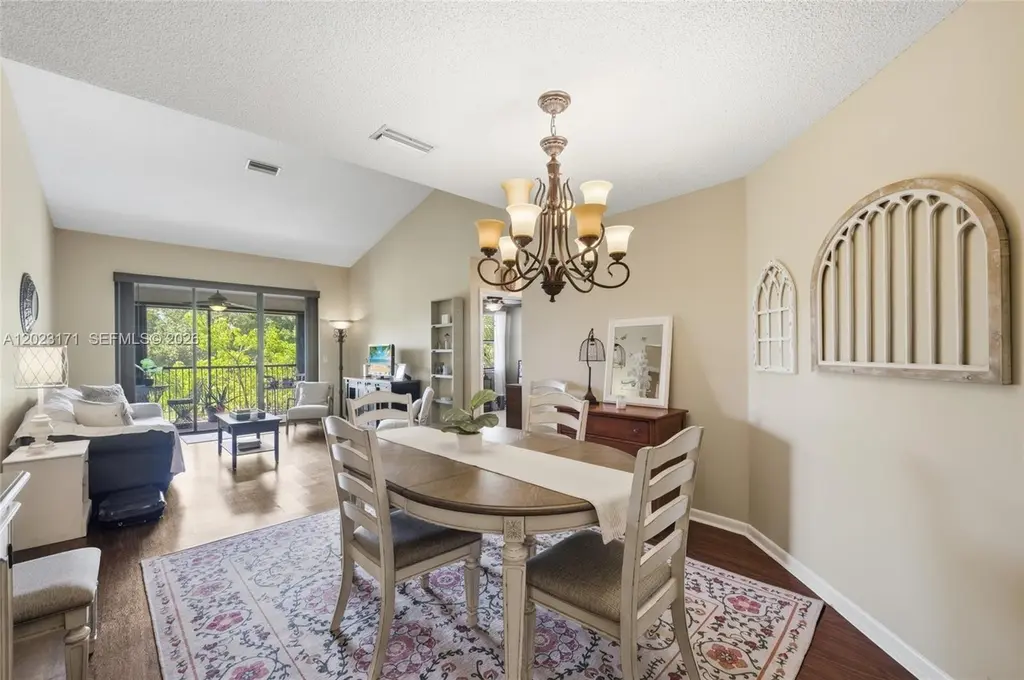
4111 Coral Tree Cir #327 · Coconut Creek, FL
Flood risk 1/10 · Minimal
- FEMA flood zone
- X (unshaded)
- Chance of flooding over 30 yrs
- 0.0%
- Est. flood insurance / yr
- $507 – $1,088
Fire risk 1/10 · Minimal
- Est. fire insurance / yr
- $947 – $1,759
Heat risk 9/10 · Severe
- Hot days now (above 107°F)
- 6 days/yr
- Hot days in 30 yrs
- 22 days/yr
Wind risk 10/10 · Severe
- Chance of severe wind over 30 yrs
- 99.0%
Air-quality risk 3/10 · Minor
- Unhealthy air days now
- 2 days/yr
- Unhealthy air days in 30 yrs
- 3 days/yr
Risk factors via First Street. Map © Google.
Why this score? — see what drove the D grade
The composite is a weighted blend of 9 inputs, each scored 0–100. Each bar is that input's sub-score; the figure is the points it added to the 100-point composite (weight × sub-score).
- ARV discount +7.5/15.0
- Cash flow +7.3/30.0
- 1% rule +5.5/10.0
- Appreciation +4.6/10.0
- Livability +4.2/5.0
- Schools +4.1/10.0
- Rent growth +2.9/5.0
- Condition / age +2.5/5.0
- DSCR +1.4/10.0
$225,000
🖨 Deal sheet 📄 Offer letter ✓ Due diligence
Listing remarks MLS
GREAT 3RD FLOOR CONDO IN TOWNSHIP*VERY PRIVATE AND SECULDED*SPLIT FLOOR PLAN*MASTER BEDROOM HUGE WALKING CLOSET AND SLIDING GLASS DOOR LEADING TO PATIO*WASHER AND DRYER IN UNIT*FRESHLY PAINTED*
Key facts
- Treetop views
- Rich wood cabinetry
- Easy elevator access
Tags
Property features AI
Finance
- Other: No pets allowed
- HOA & community: Monthly association fee of $675; Association amenities include clubhouse, pool, and elevator(s); HOA covers common areas, cable TV, insurance, internet, grounds maintenance, structure maintenance, roof, sewer, and water
Exterior
- Parking: Assigned parking; Guest parking; One assigned space
- Utilities: Cable available
- Home design: Attached property; 3 stories; Entry on third floor
- Construction: Block construction; Effective year built
- Exterior features: Balcony; Screened balcony; Storm/security shutters; Association pool
Interior
- Kitchen: Dishwasher; Disposal; Microwave; Self-cleaning oven; Refrigerator; Eat-in kitchen
- Flooring: Laminate flooring; Tile flooring
- Bathrooms: 2 full bathrooms
- Heating & cooling: Central heating; Central air conditioning; Ceiling fan(s); Programmable thermostat
- Interior features: Eat-in kitchen; Living/dining room; Split bedroom layout; Third-floor entry; Vaulted ceilings; Walk-in closet(s); Elevator; Blinds and drapes; Impact glass windows
- Laundry & utility: Washer; Dryer
Neighborhood map
What this means for you Summary
Snapshot
- This is a 2-bed/2.0-bath condo listed at $225k.
Deal economics
- At list price, monthly cash flow is $-304 ($-4k/yr) — negative.
- To cash-flow at today's rent, offer at most $171k (23.9% below list).
- Meets the 1% rule at list price ($2k rent vs $225k).
- Recommended offer: $171k (23.9% below list) — sets the bar for cash-flow.
- Cap rate 4.7% vs local median 3.7% in Coconut Creek — meaningfully above typical; check what's discounted (condition, days-on-market, listing class) to confirm the premium yield is real.
Location & tenants
- Location reads 85/100 on livability (#30 in FL, #617 nationally) — a professional / high-income tenant draw. Strengths: commute A+, housing A+, health & safety A+; Watch: amenities F.
- Broward (suburban): math 42% / reading 53% proficiency, ranked #46 of 73 in FL (top 63%) — families likely to look elsewhere, expect single-tenant / working-renter base with shorter leases.
- Market conditions: Rents rising (+1.6%/yr); 150 active listings in the ZIP; 40 comparable units currently listed for rent nearby; rentals at typical pace (median 24d on market — plan ~3-4 weeks tenant-placement turnaround); solid renter incomes; 2,111 units permitted in Broward County in 2024 (1,265 in 5+ unit buildings).
Forward outlook
- Local home prices are declining (-0.8%/yr); year-one equity from $2k of loan paydown is wiped out by about $2k of value loss. Plan a longer hold.
- Broward County population projected at +34% by 2050 — long-run rental-demand tailwind backs the buy-and-hold thesis.
Negotiation context
- It's been on market 23 days — a 2% lower offer ($222k) is reasonable based on typical stale-listing flexibility.
- 2 sale attempts since 11y ago with the ask held roughly flat each time — persistent listings suggest the price (not the market) is what's stuck; bring a comps-based counter.
- Current owner paid $165k; 36% above their basis — modest negotiation headroom, anchor on the comps not their cost.
Risks & watch-outs
- Watch-outs: HOA is 29% of rent.
- Climate carrying-cost: severe wind risk, 99% chance of damaging wind over 30y; extreme-heat days projected 6→22/yr by 2055 (HVAC capex compounding) — expect insurance premiums to compound above CPI over the hold.
Questions for the listing agent
- What do current leases actually rent for vs. the listed asking? Can we see a recent rent roll and the last 12 months of T-12 income?
- What does the HOA fee cover, when was the last increase, and are there any pending special assessments or reserve-fund shortfalls?
- Any open or pending special assessments — roof, HVAC, plumbing, elevator, façade? What's the per-unit balance and payoff schedule, and is the seller paying it off at close or rolling it to the buyer?
- Is there a deadline driving the sale (1031 exchange, divorce, estate, relocation)? That informs how much negotiation room exists.
- Schools are B-rated — typically a magnet for longer-tenancy family renters. What's the average tenant stay here, and is there a school-zone premium baked into asking?
- The area grade is low — what's the realistic commute time and amenity access for the typical tenant pool here? Any planned neighborhood developments (good or bad) we should know about?
- What's the average days-on-market for RENTAL listings here right now (not sales)? A rising rental-DOM trend means longer vacancies and softer asking-rent achievability than the comps imply.
- What's the recent tenant-quality profile in this submarket — average credit score on applications, eviction rate, late-payment / NSF rate, and stable-employment percentage? A property-management company in the area should have these aggregated.
- How much new apartment / multifamily construction is in the pipeline within 1–3 miles? Heavy new supply (>2% of stock underway) typically softens rents 12–24 months out; light construction supports rent growth.
Investment metrics
- 1% rule
- 1.05% ✓
- Cap rate
- 4.67%
- Cash-on-cash
- -5.79%
- DSCR
- 0.74
- GRM
- 7.9
CMA / ARV
No comps found within radius.
Projected returns pro-forma
-0.77% appreciation · 1.64% rent growth · sell at horizon
- IRR
- -13.5%
- Equity multiple
- 0.42×
- Total profit
- $-36,746
- Equity at exit
- $56,794
- IRR
- -8.4%
- Equity multiple
- 0.25×
- Total profit
- $-47,228
- Equity at exit
- $61,780
Cash invested: $63,000 (down + closing). Projections, not guarantees.
Landlord ↔ Tenant lean methodology
- Overall (STATE)
- 87 Strongly Landlord-Friendly
- State Florida
- 87 Strongly Landlord-Friendly · R+3
- County
- — inherits STATE
- City
- — inherits STATE
ZIP-level market 33073
- Home prices YoY
- -0.2%
- Rents YoY
- 1.6%
- Active inventory
- 150
- Price-to-rent
- 7.9×
Monthly cashflow live
- Estimated rent
- $2,364 high interval (Pro) →
- Mortgage (P&I)
- −$1,180
- Tax from tax record
- −$223 /mo · $2,677/yr
- Insurance
- −$94
- HOA
- −$675
- Vacancy / Maint / Mgmt
- −$497
- Net cashflow
- $-304
Break-even live
UW: 25.0% down · 7.5% · 30yr · 1.5% tax · 5.0% vac · 8.0% maint · 8.0% mgmt
Financing live
Cash to close
- Down payment
- $56,250
- Closing costs
- $6,750
- Reserves months
- —
- Total cash needed
- —
Loan-product check · same deal, 3 products live
Conventional
25% down · 7.5% · 30yr
- Down + closing
- —
- Monthly P&I
- —
- Monthly cashflow
- —
- DSCR
- —
- Eligible?
- —
Personal DTI + credit; lowest rate.
DSCR
20% down · 8.5% · 30yr
- Down + closing
- —
- Monthly P&I
- —
- Monthly cashflow
- —
- DSCR
- —
- Eligible?
- —
No personal income docs; deal must DSCR.
Hard money
10% down · 12.0% · 12mo
- Down + closing
- —
- Monthly P&I
- —
- Monthly cashflow
- —
- DSCR
- —
- Eligible?
- —
Short-term bridge; refi at stabilization.
Rent comps 40 comps
| Address | Beds | Baths | Sqft | Rent | $/sqft | DOM | Units | Dist |
|---|---|---|---|---|---|---|---|---|
| 3800 Coral Tree Cir Coconut Creek, FL | 1.0–3.0 | 1.0–2.5 | 1124 | $2,298 | $2.04 | 1d | 6 | 0.11mi |
| 3859 Coral Tree Cir #308 Coconut Creek, FL | 1.0 | 1.0 | 764 | $1,700 | $2.23 | 24d | 1 | 0.19mi |
| 3858 Coral Tree Cir #205 Coconut Creek, FL | 1.0 | 1.0 | 764 | $1,850 | $2.42 | 3d | 1 | 0.21mi |
| 3857 Coral Tree Cir #204 Coconut Creek, FL | 1.0 | 1.0 | 764 | $1,850 | $2.42 | 24d | 1 | 0.23mi |
| 3854 Lyons Rd Unit 201-5 Coconut Creek, FL | 3.0 | 2.0 | 1258 | $2,600 | $2.07 | 24d | 1 | 0.23mi |
| 3830 Lyons Rd Unit 301-3 Coconut Creek, FL | 3.0 | 2.0 | 1258 | $2,395 | $1.90 | 24d | 1 | 0.26mi |
| 3830 Lyons Rd Unit 110-3 Coconut Creek, FL | 1.0 | 1.0 | 798 | $1,675 | $2.10 | 24d | 1 | 0.26mi |
| 3848 Lyons Rd Unit 205-1 Coconut Creek, FL | 2.0 | 2.0 | 1112 | $2,175 | $1.96 | 24d | 1 | 0.27mi |
| 3870 Lyons Rd Unit 209-8 Coconut Creek, FL | 2.0 | 2.0 | 1112 | $2,175 | $1.96 | 24d | 1 | 0.31mi |
| 3929 Carambola Cir N #2902 Coconut Creek, FL | 2.0 | 2.0 | 955 | $2,049 | $2.15 | 24d | 1 | 0.43mi |
| 2902 Carambola Cir N Unit 2902 Coconut Creek, FL | 2.0 | 2.0 | 955 | $2,049 | $2.15 | 24d | 1 | 0.43mi |
| 2923 Carambola Cir N Unit 2923 Coconut Creek, FL | 3.0 | 2.0 | 1093 | $2,500 | $2.29 | 10d | 1 | 0.44mi |
| 2649 Carambola Cir N Unit 1735 Coral Springs, FL | 3.0 | 2.0 | 1120 | $3,000 | $2.68 | 24d | 1 | 0.51mi |
| 2649 Carambola Cir N Coral Springs, FL | 3.0 | 2.0 | 1120 | $2,900 | $2.59 | 7d | 1 | 0.51mi |
| 2616 Carambola Cir N #1702 Coconut Creek, FL | 2.0 | 2.0 | 1106 | $2,750 | $2.49 | 24d | 1 | 0.51mi |
| 2676 Carambola Cir N Unit N Coconut Creek, FL | 2.0 | 2.0 | 978 | $2,250 | $2.30 | 3d | 1 | 0.51mi |
| 2678 Carambola Cir N #1762 Coconut Creek, FL | 2.0 | 2.0 | 1120 | $2,600 | $2.32 | 24d | 1 | 0.51mi |
| 4484 Carambola Cir S #27321 Coconut Creek, FL | 2.0 | 2.0 | 962 | $2,000 | $2.08 | 24d | 1 | 0.54mi |
| 4142 Cocoplum Cir Coconut Creek, FL | 1.0–3.0 | 1.0–2.5 | 1129 | $2,223 | $1.97 | 1d | 17 | 0.55mi |
| 3346 Carambola Cir S Coconut Creek, FL | 2.0 | 2.0 | 1484 | $2,026 | $1.37 | 24d | 1 | 0.57mi |
| 2511 Carambola Cir N #18102 Coconut Creek, FL | 2.0 | 2.0 | 1106 | $2,650 | $2.40 | 20d | 1 | 0.57mi |
| 1877 Carambola Cir N Unit 1877 Coconut Creek, FL | 2.0 | 2.0 | 978 | $2,300 | $2.35 | 24d | 1 | 0.59mi |
| 1877 Carambola Cir N Coconut Creek, FL | 2.0 | 2.0 | 978 | $2,300 | $2.35 | 10d | 1 | 0.59mi |
| 4615 Carambola Cir S #27232 Coconut Creek, FL | 2.0 | 2.5 | 1244 | $2,550 | $2.05 | 24d | 1 | 0.60mi |
| 4467 Carambola Cir S Coconut Creek, FL | 3.0 | 2.0 | 1115 | $2,375 | $2.13 | 7d | 1 | 0.64mi |
| 3393 Carambola Cir S #2441 Coconut Creek, FL | 2.0 | 2.5 | 1230 | $2,500 | $2.03 | 14d | 1 | 0.65mi |
| 4854 Fishermans Dr Coconut Creek, FL | 1.0–2.0 | 1.0–2.0 | 800 | $2,400 | $3.00 | 1d | 13 | 0.67mi |
| 3325 Carambola Cir S Unit S Coconut Creek, FL | 2.0 | 2.5 | 1230 | $2,500 | $2.03 | 3d | 1 | 0.67mi |
| 4901 W Sample Rd Coconut Creek, FL | 3.0 | 2.0 | 1352 | $3,227 | $2.39 | 7d | 1 | 0.70mi |
| 4901 W Sample Rd Coconut Creek, FL | 3.0 | 2.0 | 1352 | $3,263 | $2.41 | 16d | 1 | 0.70mi |
| 3961 Cocoplum Cir Unit F Coconut Creek, FL | 2.0 | 2.5 | 1208 | $2,200 | $1.82 | 24d | 1 | 0.71mi |
| 3953 Cocoplum Cir #3611 Coconut Creek, FL | 2.0 | 2.0 | 1140 | $2,700 | $2.37 | 1d | 1 | 0.72mi |
| 3953 Cocoplum Cir #3611 Coconut Creek, FL | 2.0 | 2.0 | 1140 | $2,700 | $2.37 | 5d | 1 | 0.72mi |
| 2738 Carambola Cir S #1913 Coconut Creek, FL | 3.0 | 2.0 | 1120 | $2,300 | $2.05 | 24d | 1 | 0.73mi |
| 3950 Cocoplum Cir #3638 Coconut Creek, FL | 3.0 | 2.5 | 1388 | $3,200 | $2.31 | 24d | 1 | 0.74mi |
| 3950 Cocoplum Cir Coconut Creek, FL | 3.0 | 2.5 | 1388 | $3,200 | $2.31 | 10d | 1 | 0.74mi |
| 3427 NW 47th Ave #3190 Coconut Creek, FL | 2.0 | 2.0 | 955 | $2,300 | $2.41 | 22d | 1 | 0.75mi |
| 3427 NW 47th Ave #3190 Coconut Creek, FL | 2.0 | 2.0 | 955 | $2,300 | $2.41 | 7d | 1 | 0.75mi |
| 3150 NW 42nd Ave Unit E401 Coconut Creek, FL | 2.0 | 2.0 | 1340 | $2,049 | $1.53 | 24d | 1 | 0.76mi |
| 2407 Carambola Cir S Unit 2407 Coconut Creek, FL | 2.0 | 2.5 | 1230 | $2,500 | $2.03 | 7d | 1 | 0.76mi |
HOA detail condo
- Monthly dues
- $675 · $8,100/yr
- Assessments
- None detected in remarks — confirm with the listing agent.
Listing history 19 events
-
2026-06-18days on market $225,000 Active 23 DOM
-
2026-06-17days on market $225,000 Active 22 DOM
-
2026-06-16days on market $225,000 Active 21 DOM
-
2026-06-15days on market $225,000 Active 20 DOM
-
2026-06-13days on market $225,000 Active 18 DOM
-
2026-06-09days on market $225,000 Active 14 DOM
-
2026-06-08days on market $225,000 Active 13 DOM
-
2026-06-07days on market $225,000 Active 12 DOM
-
2026-06-04days on market $225,000 Active 9 DOM
-
2026-06-03days on market $225,000 Active 8 DOM
-
2026-06-02days on market $225,000 Active 7 DOM
-
2026-06-01days on market $225,000 Active 6 DOM
-
2026-05-31days on market $225,000 Active 5 DOM
-
2026-05-26$225,000 Active
-
2019-12-16soldstatus $165,000
-
2015-10-29soldstatus $112,600
-
2015-10-23soldstatus $112,500 193-char remark
Show marketing remark (193 chars)
GREAT 3RD FLOOR CONDO IN TOWNSHIP*VERY PRIVATE AND SECULDED*SPLIT FLOOR PLAN*MASTER BEDROOM HUGE WALKING CLOSET AND SLIDING GLASS DOOR LEADING TO PATIO*WASHER AND DRYER IN UNIT*FRESHLY PAINTED*
-
2015-08-23$125,900 193-char remark
Show marketing remark (193 chars)
GREAT 3RD FLOOR CONDO IN TOWNSHIP*VERY PRIVATE AND SECULDED*SPLIT FLOOR PLAN*MASTER BEDROOM HUGE WALKING CLOSET AND SLIDING GLASS DOOR LEADING TO PATIO*WASHER AND DRYER IN UNIT*FRESHLY PAINTED*
-
1997-11-07soldstatus $78,000
ⓘ Source: listings_history table (triggers on properties + properties_extension) + one-shot
backfill from property_details.listing_events for pre-trigger history.
Tax reassessment forecast FL · Resets to sale price
- Current annual tax
- $2,677 · $223/mo
- Projected year-2 tax
- $2,677 · $223/mo
- Expected delta
- $0/yr ($0/mo · 0.0%)
ⓘ Screening estimate from a state-policy table — verify with the county assessor before closing.
Climate risk First Street
- Flood 1/10 Low FEMA zone X (unshaded) · 0% chance over 30 yrs
- Wildfire 1/10 Low
- Heat 9/10 Extreme 6 d/yr ≥107°F today · 22 d/yr by 30 yrs out
- Wind 10/10 Extreme 99% chance of damaging wind over 30 yrs
- Air quality 3/10 Moderate 2 unhealthy d/yr today · 3 by 30 yrs out
Nearby sold comps map
Loading sold comps map…
Walkable amenities ~0.75 mi
Loading nearby amenities…
Taxation est. · year 1
- Rental income
- $28,372
- − Mortgage interest
- −$12,603
- − Property taxes
- −$2,677
- − Insurance
- −$1,125
- − Repairs & maintenance
- −$2,270
- − Management
- −$2,270
- − HOA
- −$8,100
- − Depreciation
- −$6,545
- Taxable loss
- −$7,219
- Est. tax savings @ 24.0%
- +$1,733
- After-tax cash flow
- $-1,915/yr
For passive investors: Depreciation is non-cash, so a rental often shows a tax loss while cash-flowing — sheltering income. Rental losses are passive: they offset passive income freely, and up to $25,000/yr can offset ordinary (W-2) income if you actively participate and your MAGI is under $100k (phasing out to $0 by $150k); unused losses carry forward. On sale, claimed depreciation is recaptured at up to 25%, and gains may owe capital-gains tax (a 1031 exchange can defer both). Figures are a year-1 estimate at your 24.0% rate — not tax advice; consult a CPA.
Schools (NCES district)
- District
- Broward
- NCES district ID
- 1200180
- Math proficiency
- 42% ▼ -18.00%
- Reading proficiency
- 53% ▼ -5.00%
- Median HH income
- $52,139
- Composite
- 40.88/100
- National rank
- #3621
- State rank
- #46 of 73 in FL
Livability — Coconut Creek
- Score
- 85/100
- State rank
- #30
- US rank
- #617
Category grades
Schools grade is shown separately in the Schools card above.
Census & demographics
- Census place
- Coconut Creek, FL
- County
- Broward County · 1,963,430 people
- City population
- 50,557
- Metro
- Miami-Fort Lauderdale-Pompano Beach, FL
- Population (ZIP)
- 33,838
- Household income
- $97,412
- Rent vs Own
- Severe rent burden
- 1109.0
Population outlook (Broward County) Hauer SSP2
- Today (2025)
- 2,207,033 people
- By 2030
- 2,360,704 · +7.0%
- By 2040
- 2,661,208 · +20.6%
- By 2050
- 2,946,698 · +33.5%
- By 2075
- 3,602,273 · +63.2%
- By 2100
- 3,970,984 · +79.9%
Race, ethnicity, and origin ACS 2023
- Neighborhood character
- Highly diverse neighborhood (Simpson 0.70)
- Race & ethnicity
- White 43% Hispanic / Latino 28% Two or more races 18% Black 17% Asian 3%
- Hispanic origin (detail)
- Mexican 2% Puerto Rican 4% Cuban 4% Dominican 2%
- Common ancestry
- Estonian 6% Hispanic 3% Romanian 2%
- Foreign-born
- 35% · Canada, Jamaica, China
- Languages at home
- 58% English-only · Spanish 23% Other Indo-European 11% French/Haitian/Cajun 4%
Political lean MEDSL · Broward
- 2024 margin
- D (+17.0) · D 58.0% · R 41.0%
- 2008→2024 swing
- -17.8pp toward R · 2008: 34.7pp · 2024: 17.0pp
- All cycles
- 2024: D+17.0 2020: D+29.8 2016: D+35.0 2012: D+34.9 2008: D+34.7
Not yet ingested
- Civics
- —
Market trends
- HPI YoY
- ▼ -0.77%
- Current HPI
- 337.0725
- Rent YoY
- ▲ 1.64%
- Metro
- Miami-Fort Lauderdale-Pompano Beach, FL
- State GDP YoY
- ▲ 3.28%
- F500 in state
- 36
Industry mix (Fortune 500 HQ in FL)
| Industry | F500 HQs | Revenue |
|---|---|---|
| Industrial Technology | 2 | $29B |
|
||
| Insurance | 2 | $17B |
|
||
| Retail | 1 | $60B |
|
||
| Technology Distribution | 1 | $58B |
|
||
| Homebuilding | 1 | $35B |
|
||
| Technology Manufacturing | 1 | $35B |
|
||
Price history
+188.5% since first listed6 events — show timeline
- 2026-05-26 Listed $225,000 MARMLS
- 2019-12-16 Sold (Public Records) $165,000 Public Records
- 2015-10-29 Sold (Public Records) $112,600 Public Records
- 2015-10-23 Sold (MLS) $112,500 Beaches MLS
- 2015-08-23 Listed $125,900 Beaches MLS
- 1997-11-07 Sold (Public Records) $78,000 Public Records
Property tax history
+4.5%/yrLatest (2025): $2,677 · +4.1% YoY. Source: county tax records.
Cash-flow waterfall
monthlySold comps — $/sqft
last 12 mo · ≤1 miLoading sold comps…