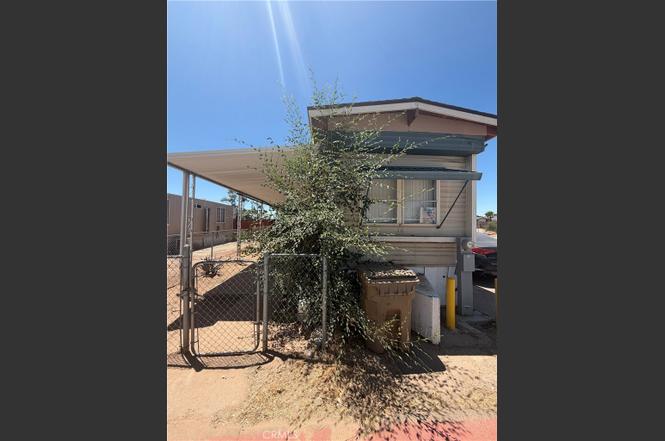
9120 Hesperia Rd #18 · Hesperia, CA
Flood risk 1/10 · Minimal
- FEMA flood zone
- X (unshaded)
- Chance of flooding over 30 yrs
- 0.0%
- Est. flood insurance / yr
- $507 – $1,088
Fire risk 6/10 · Moderate
- Est. fire insurance / yr
- $659 – $1,223
Heat risk 6/10 · Moderate
- Hot days now (above 98°F)
- 7 days/yr
- Hot days in 30 yrs
- 19 days/yr
Wind risk 1/10 · Minimal
- Chance of severe wind over 30 yrs
- —
Air-quality risk 10/10 · Severe
- Unhealthy air days now
- 24 days/yr
- Unhealthy air days in 30 yrs
- 29 days/yr
Risk factors via First Street. Map © Google.
Why this score? — see what drove the C- grade
The composite is a weighted blend of 9 inputs, each scored 0–100. Each bar is that input's sub-score; the figure is the points it added to the 100-point composite (weight × sub-score).
- Cash flow +15.0/30.0
- ARV discount +15.0/15.0
- 1% rule +5.0/10.0
- DSCR +5.0/10.0
- Rent growth +3.2/5.0
- Schools +2.6/10.0
- Livability +2.6/5.0
- Condition / age +2.5/5.0
- Appreciation +0.0/10.0
$35,000
🖨 Deal sheet 📄 Offer letter ✓ Due diligence
Listing remarks
Value & Potential! Affordable Single-Wide with a Brand-New Roof! Stop renting and start owning! This affordable single-wide mobile home, nestled in a welcoming land-lease community, offers the perfect opportunity to customize a space exactly to your taste. Best of all, the biggest ticket item is already done—this home features a brand-new roof, giving you peace of mind while you finish the interior!Whether you are a savvy investor looking for a great rental property or a buyer wanting to exit the rent cycle, this fixer-upper is bursting with potential. The compact, low-maintenance layout features an open kitchen and living area, maximizing every square inch of space. Outside, th
Key facts
- Brand-new roof
- Private parking
- Built 1968
Tags
Property features AI
Finance
- HOA & community: Land lease of $700 per month (park-managed); property is in a land lease community; Manager approval required
Exterior
- Parking: Located in Highlanders Mobile Home Park
- Utilities: Private water; Septic (type unknown)
- Home design: Single-story property; Mobile home remains on site; Living area per public records
- Construction: Year built per public records
- Exterior features: No pool; Lot zoned approximately 0–1 unit per acre; Located in a rural community
Interior
- Bathrooms: 1 full bathroom
- Interior features: One-level home; Side entry
- Laundry & utility: No laundry hookups on site
Neighborhood map
What this means for you Summary
Snapshot
- This is a 1-bed/1.0-bath manufactured listed at $35k.
Deal economics
- At list price, monthly cash flow is $1k ($12k/yr) — positive.
- The deal already cash-flows at list — no discount required.
- Meets the 1% rule at list price ($2k rent vs $35k).
- Cap rate 40.6% vs local median 3.7% in Hesperia — top-decile yield for the area; either an underpriced asset or a hidden risk that comps aren't pricing in. Stress-test before assuming the spread holds.
Location & tenants
- Location reads 52/100 on livability (#1,009 in CA) — a working-class tenant base; expect higher turnover. Strengths: housing A+; Watch: employment D, schools F, crime D-.
- Hesperia Unified (suburban): math 20% / reading 39% proficiency, ranked #353 of 517 in CA (top 68%) — low school quality limits family demand, transient renter base, plan for 1-2y turnover; 61% free/reduced lunch — lower-income household profile, screen leases tightly.
- Market conditions: Rents rising (+2.9%/yr); 463 active listings in the ZIP; 6 comparable units currently listed for rent nearby; rentals at typical pace (median 24d on market — plan ~3-4 weeks tenant-placement turnaround); 5,458 units permitted in San Bernardino County in 2024 (1,500 in 5+ unit buildings).
Forward outlook
- Local home prices are declining (-3.0%/yr); year-one equity from $242 of loan paydown is wiped out by about $1k of value loss. Plan a longer hold.
- San Bernardino County population projected at +15% by 2050 — modest demand growth; plan on rents tracking national, not racing it.
- At projected returns (-3.0% appreciation + 2.9% rent growth), your $10k cash investment doubles in ~1 year — after that, you're playing with house money.
Negotiation context
- Only 1 days on market — expect competitive offers; lowballing is unlikely to land.
Risks & watch-outs
- Climate carrying-cost: major wildfire risk; extreme-heat days projected 7→19/yr by 2055 (HVAC capex compounding) — expect insurance premiums to compound above CPI over the hold.
Questions for the listing agent
- Built in 1968 — when were the roof, HVAC, electrical panel, plumbing, and water heater last replaced?
- Is there a deadline driving the sale (1031 exchange, divorce, estate, relocation)? That informs how much negotiation room exists.
- Schools are F-rated, which usually means shorter tenancies and higher turnover. Who's the typical renter profile here, and what's been the actual vacancy rate?
- Crime grade is D in this area — have there been break-ins, vandalism, or insurance claims at this property in the last 3 years? What carrier currently insures it and at what premium?
- What's the average days-on-market for RENTAL listings here right now (not sales)? A rising rental-DOM trend means longer vacancies and softer asking-rent achievability than the comps imply.
- What's the recent tenant-quality profile in this submarket — average credit score on applications, eviction rate, late-payment / NSF rate, and stable-employment percentage? A property-management company in the area should have these aggregated.
- How much new for-sale + rental construction is in the pipeline within 1–3 miles? Heavy new supply typically softens prices + rents 12–24 months out; constrained supply supports both.
Investment metrics
- 1% rule
- 4.50% ✓
- Cap rate
- 40.64%
- Cash-on-cash
- 122.66%
- DSCR
- 6.46
- GRM
- 1.9
CMA / ARV
- ARV (on-the-fly)
- $65,500
- Comps found
- 2
Show comp detail 2 sales within ~0.75 mi
| Address | Dist | Beds/Ba | Sqft | Sold | Price | $/sf | Match |
|---|---|---|---|---|---|---|---|
| 9241 C Ave #43 | 0.44mi | 2/1.0 (+1) | 531 (+6%) | 4mo | $36,500 | $69 | 61 |
| 8562 C Ave #35 | 0.63mi | 2/1.0 (+1) | 533 (+7%) | 9mo | $70,000 | $131 | 48 |
Match score weights: distance 35% · size 25% · config 20% · recency 20%. Top-matched comps best support the ARV.
Projected returns pro-forma
-3.0% appreciation · 2.85% rent growth · sell at horizon
- IRR
- —
- Equity multiple
- 6.91×
- Total profit
- $57,917
- Equity at exit
- $5,219
- IRR
- —
- Equity multiple
- 14.44×
- Total profit
- $131,714
- Equity at exit
- $3,026
Cash invested: $9,800 (down + closing). Projections, not guarantees.
Landlord ↔ Tenant lean methodology
- Overall (STATE)
- 18 Strongly Tenant-Friendly
- State California
- 18 Strongly Tenant-Friendly · D+13
- County
- — inherits STATE
- City
- — inherits STATE
ZIP-level market 92345
- Rents YoY
- 2.9%
- Active inventory
- 463
- Price-to-rent
- 1.9×
Monthly cashflow live
- Estimated rent
- $1,574 high interval (Pro) →
- Mortgage (P&I)
- −$184
- Tax est. 1.5%
- −$44 /mo · $525/yr
- Insurance
- −$15
- HOA
- −$0
- Vacancy / Maint / Mgmt
- −$331
- Net cashflow
- $1,002
Break-even live
UW: 25.0% down · 7.5% · 30yr · 1.5% tax · 5.0% vac · 8.0% maint · 8.0% mgmt
Financing live
Cash to close
- Down payment
- $8,750
- Closing costs
- $1,050
- Reserves months
- —
- Total cash needed
- —
Loan-product check · same deal, 3 products live
Conventional
25% down · 7.5% · 30yr
- Down + closing
- —
- Monthly P&I
- —
- Monthly cashflow
- —
- DSCR
- —
- Eligible?
- —
Personal DTI + credit; lowest rate.
DSCR
20% down · 8.5% · 30yr
- Down + closing
- —
- Monthly P&I
- —
- Monthly cashflow
- —
- DSCR
- —
- Eligible?
- —
No personal income docs; deal must DSCR.
Hard money
10% down · 12.0% · 12mo
- Down + closing
- —
- Monthly P&I
- —
- Monthly cashflow
- —
- DSCR
- —
- Eligible?
- —
Short-term bridge; refi at stabilization.
Rent comps 6 comps
| Address | Beds | Baths | Sqft | Rent | $/sqft | DOM | Units | Dist |
|---|---|---|---|---|---|---|---|---|
| 16837 Sultana St Apt 4 Hesperia, CA | 2.0 | 1.0 | 750 | $1,624 | $2.17 | 43d | 1 | 0.52mi |
| 16209 Juniper St Unit 2 Hesperia, CA | 2.0 | 1.0 | 730 | $2,200 | $3.01 | 24d | 1 | 0.65mi |
| 8820 5th Ave Unit 3 Hesperia, CA | — | 1.0 | 350 | $1,195 | $3.41 | 20d | 1 | 0.67mi |
| 8956 G Ave Hesperia, CA | 1.0 | 1.0 | 650 | $1,370 | $2.11 | 43d | 1 | 0.82mi |
| 9090 G Ave Apt 2 Hesperia, CA | 1.0 | 1.0 | 720 | $1,100 | $1.53 | 24d | 1 | 0.87mi |
| 16001 Live Oak St Unit Upstairs ADU Hesperia, CA | 1.0 | 1.0 | 492 | $1,295 | $2.63 | 24d | 1 | 1.19mi |
Listing history 2 events
-
2026-06-18remarks 689-char remark
-
2026-06-18$35,000 Active 1 DOM
ⓘ Source: listings_history table (triggers on properties + properties_extension) + one-shot
backfill from property_details.listing_events for pre-trigger history.
Climate risk First Street
- Flood 1/10 Low FEMA zone X (unshaded) · 0% chance over 30 yrs
- Wildfire 6/10 Major
- Heat 6/10 Major 7 d/yr ≥98°F today · 19 d/yr by 30 yrs out
- Wind 1/10 Low
- Air quality 10/10 Extreme 24 unhealthy d/yr today · 29 by 30 yrs out
Nearby sold comps map
Loading sold comps map…
Walkable amenities ~0.75 mi
Loading nearby amenities…
Taxation est. · year 1
- Rental income
- $18,891
- − Mortgage interest
- −$1,961
- − Property taxes
- −$525
- − Insurance
- −$175
- − Repairs & maintenance
- −$1,511
- − Management
- −$1,511
- − Depreciation
- −$1,018
- Taxable income
- $12,189
- Est. tax owed @ 24.0%
- −$2,925
- After-tax cash flow
- $9,096/yr
For passive investors: Depreciation is non-cash, so a rental often shows a tax loss while cash-flowing — sheltering income. Rental losses are passive: they offset passive income freely, and up to $25,000/yr can offset ordinary (W-2) income if you actively participate and your MAGI is under $100k (phasing out to $0 by $150k); unused losses carry forward. On sale, claimed depreciation is recaptured at up to 25%, and gains may owe capital-gains tax (a 1031 exchange can defer both). Figures are a year-1 estimate at your 24.0% rate — not tax advice; consult a CPA.
Schools (NCES district)
- District
- Hesperia Unified
- NCES district ID
- 0600014
- Math proficiency
- 20% ▼ -4.00%
- Reading proficiency
- 39% ▲ 4.00%
- Median HH income
- $49,376
- Composite
- 25.66/100
- National rank
- #7397
- State rank
- #353 of 517 in CA
Livability — Hesperia
- Score
- 52/100
- State rank
- #1009
- US rank
- #24896
Category grades
Schools grade is shown separately in the Schools card above.
Census & demographics
- Census place
- Hesperia, CA
- County
- San Bernardino County · 2,030,291 people
- City population
- 110,055
- Metro
- Riverside-San Bernardino-Ontario, CA
- Population (ZIP)
- 88,706
- Household income
- $69,485
- Rent vs Own
- Severe rent burden
- 2768.0
Population outlook (San Bernardino County) Hauer SSP2
- Today (2025)
- 2,300,329 people
- By 2030
- 2,378,907 · +3.4%
- By 2040
- 2,523,137 · +9.7%
- By 2050
- 2,642,388 · +14.9%
- By 2075
- 2,880,769 · +25.2%
- By 2100
- 2,909,436 · +26.5%
Race, ethnicity, and origin ACS 2023
- Neighborhood character
- Majority Hispanic (61%)
- Race & ethnicity
- Hispanic / Latino 61% White 30% Two or more races 19% Black 4% Asian 1% Native American 1%
- Hispanic origin (detail)
- Mexican 54%
- Common ancestry
- Italian 1% Lithuanian 1% Iranian 1%
- Foreign-born
- 17% · Canada
- Languages at home
- 65% English-only · Spanish 34%
Political lean MEDSL · San Bernardino
- 2024 margin
- Toss-up / Even · D 47.5% · R 49.7% · Other 2.8%
- 2008→2024 swing
- -8.5pp toward R · 2008: 6.3pp · 2024: -2.1pp
- All cycles
- 2024: R+2.1 2020: D+10.7 2016: D+9.8 2012: D+5.4 2008: D+6.3
Not yet ingested
- Civics
- —
Market trends
- HPI YoY
- ▼ -375.87%
- Current HPI
- 433.2103
- Rent YoY
- ▲ 2.85%
- Metro
- Riverside-San Bernardino-Ontario, CA
- State GDP YoY
- ▲ 3.21%
- F500 in state
- 116
Industry mix (Fortune 500 HQ in CA)
| Industry | F500 HQs | Revenue |
|---|---|---|
| Technology | 27 | $1,492B |
|
||
| Financial Services | 3 | $174B |
|
||
| Retail | 3 | $44B |
|
||
| Insurance | 3 | $26B |
|
||
| Media / Entertainment | 2 | $115B |
|
||
| Pharmaceuticals / Biotech | 2 | $62B |
|
||
Price history
1 event — show timeline
- 2026-06-17 Listed $35,000 CRMLS
Property tax history
+0.2%/yrLatest (2015): $61 · +0.0% YoY. Source: county tax records.
Cash-flow waterfall
monthlySold comps — $/sqft
last 12 mo · ≤1 miLoading sold comps…