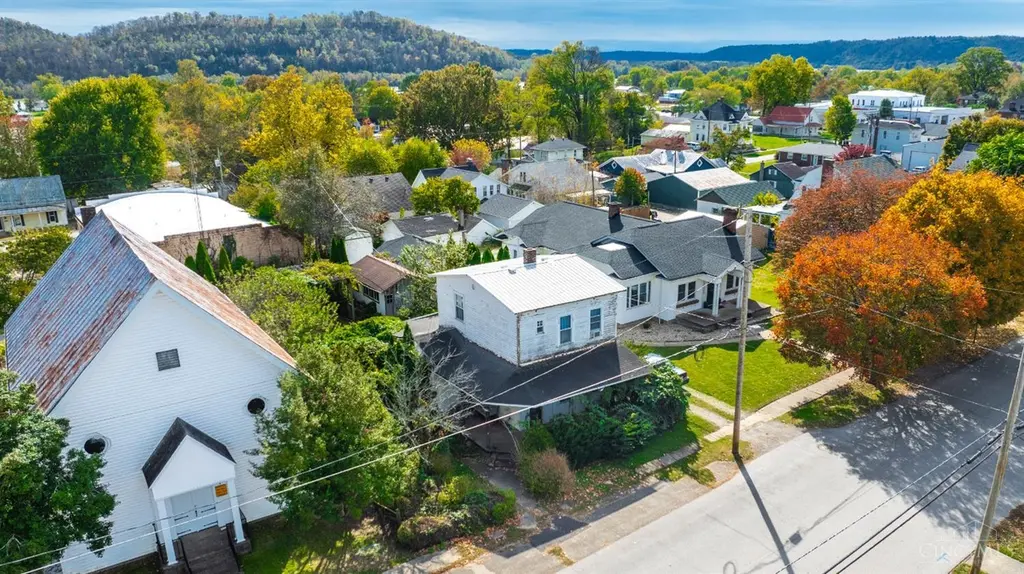
312 E Eighth St · Manchester, OH
Flood risk 1/10 · Minimal
- FEMA flood zone
- X (unshaded)
- Chance of flooding over 30 yrs
- 0.0%
- Est. flood insurance / yr
- $473 – $860
Fire risk 3/10 · Minor
- Est. fire insurance / yr
- $713 – $1,323
Heat risk 5/10 · Moderate
- Hot days now (above 101°F)
- 7 days/yr
- Hot days in 30 yrs
- 21 days/yr
Wind risk 2/10 · Minimal
- Chance of severe wind over 30 yrs
- 2.0%
Air-quality risk 2/10 · Minimal
- Unhealthy air days now
- 1 days/yr
- Unhealthy air days in 30 yrs
- 1 days/yr
Risk factors via First Street. Map © Google.
Why this score? — see what drove the B grade
The composite is a weighted blend of 9 inputs, each scored 0–100. Each bar is that input's sub-score; the figure is the points it added to the 100-point composite (weight × sub-score).
- Cash flow +30.0/30.0
- 1% rule +10.0/10.0
- DSCR +10.0/10.0
- ARV discount +7.5/15.0
- Appreciation +5.5/10.0
- Schools +3.8/10.0
- Livability +3.1/5.0
- Rent growth +2.5/5.0
- Condition / age +2.5/5.0
$59,900
🖨 Deal sheet 📄 Offer letter ✓ Due diligence
Listing remarks MLS
Great opportunity to finish bringing this home back to life!! This home has some original woodwork, 3 beds, 10' ceilings, winding staircase, covered porches, a nice workshop in backyard that could easily be converted into a cottage! Off street parking in the back. This home is located in nice residential area, walking distance to the Ohio River!
Key facts
- Winding staircase
- Covered porches
- Off street parking
Tags
Property features AI
Finance
- Other: Lease not considered
- HOA & community: No HOA
Exterior
- Utilities: Public water; Public sewer; Natural gas; Electric water heater
- Home design: Traditional single-family home; Two levels
- Construction: Vinyl siding; Stone foundation; Shingle roof; Second-floor area approximately 520
- Exterior features: Wood windows
Interior
- Kitchen: Kitchen approximately 16 x 18
- Bedrooms: Three bedrooms total; Primary bedroom on level 1 (12 x 14); Bedroom 2 on level 2 (10 x 12); Bedroom 3 on level 2 (11 x 12)
- Bathrooms: One full bathroom on level 1; Primary bathroom with shower
- Heating & cooling: Forced-air heating (gas)
- Interior features: Six total rooms
- Laundry & utility: Main-level laundry room (8 x 10)
Neighborhood map
What this means for you Summary
Snapshot
- This is a 3-bed/1.0-bath single-family listed at $60k.
Deal economics
- At list price, monthly cash flow is $366 ($4k/yr) — positive.
- The deal already cash-flows at list — no discount required.
- Meets the 1% rule at list price ($946 rent vs $60k).
Location & tenants
- Location reads 61/100 on livability (#957 in OH) — a middle-class / working-renter tenant base. Strengths: crime A+, cost of living A+, housing B+; Watch: schools C-, health & safety C-, amenities F.
- Manchester Local (rural): math 38% / reading 55% proficiency, ranked #497 of 656 in OH (top 76%) — families likely to look elsewhere, expect single-tenant / working-renter base with shorter leases; 67% free/reduced lunch — lower-income household profile, screen leases tightly.
- Market conditions: 37 active listings in the ZIP; lower-income renter base — watch delinquency; 42 units permitted in Adams County in 2024 (0 in 5+ unit buildings).
Forward outlook
- In year one you build about $991 of equity ($414 loan paydown + $577 appreciation (1.0% local appreciation)).
- Adams County population projected at -23% by 2050 — secular population decline; favor cash flow + early exit over multi-decade hold.
- At projected returns (1.0% appreciation + 3.0% rent growth), your $17k cash investment doubles in ~3 years — after that, you're playing with house money.
Negotiation context
- Only 1 days on market — expect competitive offers; lowballing is unlikely to land.
- 2 sale attempts; this cycle's ask has dropped $5k (8%) from the opening price — seller is motivated, your offer sets the floor, not the list.
- Current owner paid $20k; list at $60k implies a 200% gain — meaningful room to come down on a strong offer.
Risks & watch-outs
- Watch-outs: built in 1901 — expect roof / HVAC / electrical / plumbing capex.
- Climate carrying-cost: extreme-heat days projected 7→21/yr by 2055 (HVAC capex compounding) — expect insurance premiums to compound above CPI over the hold.
Questions for the listing agent
- Built in 1901 — when were the roof, HVAC, electrical panel, plumbing, and water heater last replaced?
- Is there a deadline driving the sale (1031 exchange, divorce, estate, relocation)? That informs how much negotiation room exists.
- What's the average days-on-market for RENTAL listings here right now (not sales)? A rising rental-DOM trend means longer vacancies and softer asking-rent achievability than the comps imply.
- What's the recent tenant-quality profile in this submarket — average credit score on applications, eviction rate, late-payment / NSF rate, and stable-employment percentage? A property-management company in the area should have these aggregated.
- How much new for-sale + rental construction is in the pipeline within 1–3 miles? Heavy new supply typically softens prices + rents 12–24 months out; constrained supply supports both.
Investment metrics
- 1% rule
- 1.58% ✓
- Cap rate
- 13.63%
- Cash-on-cash
- 26.21%
- DSCR
- 2.17
- GRM
- 5.3
CMA / ARV
- ARV (on-the-fly)
- $125,580
- Comps found
- 10
Show comp detail 10 sales within ~0.75 mi
| Address | Dist | Beds/Ba | Sqft | Sold | Price | $/sf | Match |
|---|---|---|---|---|---|---|---|
| 704 Broadway St | 0.35mi | 3/1.0 | 1,176 (-2%) | 1mo | $25,000 | $21 | 80 |
| 516 E Eighth St | 0.25mi | 3/1.0 | 1,160 (-3%) | 14mo | $121,500 | $105 | 72 |
| 732 Easy St | 0.53mi | 3/2.0 | 1,184 (-1%) | 3mo | $127,500 | $108 | 67 |
| 516 E Second St | 0.42mi | 2/1.0 (-1) | 1,153 (-4%) | 8mo | $107,900 | $94 | 63 |
| 304 W Eighth St | 0.31mi | 3/2.0 | 1,164 (-3%) | 20mo | $140,000 | $120 | 60 |
| 602 Jack Roush Way | 0.19mi | 2/1.0 (-1) | 1,096 (-8%) | 19mo | $10,000 | $9 | 56 |
| 608 E Eighth St | 0.34mi | 2/1.0 (-1) | 1,024 (-14%) | 1mo | $147,000 | $144 | 54 |
| 204 W Eighth St | 0.25mi | 3/1.5 | 1,293 (+8%) | 24mo | $121,900 | $94 | 53 |
| 208 W Second St | 0.43mi | 2/2.0 (-1) | 1,036 (-13%) | 4mo | $47,500 | $46 | 46 |
| 776 Linda Vista Dr | 0.70mi | 3/1.0 | 1,345 (+12%) | 2mo | $150,000 | $112 | 45 |
Match score weights: distance 35% · size 25% · config 20% · recency 20%. Top-matched comps best support the ARV.
Projected returns pro-forma
0.96% appreciation · 3.0% rent growth · sell at horizon
- IRR
- 28.4%
- Equity multiple
- 2.45×
- Total profit
- $24,336
- Equity at exit
- $20,337
- IRR
- 31.0%
- Equity multiple
- 4.72×
- Total profit
- $62,323
- Equity at exit
- $26,939
Cash invested: $16,772 (down + closing). Projections, not guarantees.
Landlord ↔ Tenant lean methodology
- Overall (STATE)
- 73 Landlord-Friendly
- State Ohio
- 73 Landlord-Friendly · R+6
- County
- — inherits STATE
- City
- — inherits STATE
ZIP-level market 45144
- Home prices YoY
- 0.5%
- Active inventory
- 37
- Price-to-rent
- 5.3×
Monthly cashflow live
- Estimated rent
- $946 medium interval (Pro) →
- Mortgage (P&I)
- −$314
- Tax from tax record
- −$42 /mo · $500/yr
- Insurance
- −$25
- HOA
- −$0
- Vacancy / Maint / Mgmt
- −$199
- Net cashflow
- $366
Break-even live
UW: 25.0% down · 7.5% · 30yr · 1.5% tax · 5.0% vac · 8.0% maint · 8.0% mgmt
Financing live
Cash to close
- Down payment
- $14,975
- Closing costs
- $1,797
- Reserves months
- —
- Total cash needed
- —
Loan-product check · same deal, 3 products live
Conventional
25% down · 7.5% · 30yr
- Down + closing
- —
- Monthly P&I
- —
- Monthly cashflow
- —
- DSCR
- —
- Eligible?
- —
Personal DTI + credit; lowest rate.
DSCR
20% down · 8.5% · 30yr
- Down + closing
- —
- Monthly P&I
- —
- Monthly cashflow
- —
- DSCR
- —
- Eligible?
- —
No personal income docs; deal must DSCR.
Hard money
10% down · 12.0% · 12mo
- Down + closing
- —
- Monthly P&I
- —
- Monthly cashflow
- —
- DSCR
- —
- Eligible?
- —
Short-term bridge; refi at stabilization.
Listing history 7 events
-
2026-06-18pricedays on market $59,900 Active 1 DOM
-
2026-05-31days on market $65,000 Active 116 DOM
-
2026-05-31days on market $65,000 Active 115 DOM
-
2026-02-04$65,000 Active
-
2026-01-31historical 351-char remark
Show marketing remark (351 chars)
Great opportunity to finish bringing this home back to life!! This home has some original woodwork, 3 beds, 10' ceilings, winding staircase, covered porches, a nice workshop in backyard that could easily be converted into a cottage! Off street parking in the back. This home is located in nice residential area, walking distance to the Ohio River!
-
2025-10-30$69,900 Active 351-char remark
Show marketing remark (351 chars)
Great opportunity to finish bringing this home back to life!! This home has some original woodwork, 3 beds, 10' ceilings, winding staircase, covered porches, a nice workshop in backyard that could easily be converted into a cottage! Off street parking in the back. This home is located in nice residential area, walking distance to the Ohio River!
-
1996-12-19soldstatus $20,000
ⓘ Source: listings_history table (triggers on properties + properties_extension) + one-shot
backfill from property_details.listing_events for pre-trigger history.
Tax reassessment forecast OH · Partial reset (capped growth)
- Current annual tax
- $500 · $42/mo
- Projected year-2 tax
- $717 · $60/mo
- Expected delta
- +$217/yr (+$18/mo · 43.4%)
ⓘ Screening estimate from a state-policy table — verify with the county assessor before closing.
Climate risk First Street
- Flood 1/10 Low FEMA zone X (unshaded) · 0% chance over 30 yrs
- Wildfire 3/10 Moderate
- Heat 5/10 Major 7 d/yr ≥101°F today · 21 d/yr by 30 yrs out
- Wind 2/10 Low 2% chance of damaging wind over 30 yrs
- Air quality 2/10 Low 1 unhealthy d/yr today · 1 by 30 yrs out
Nearby sold comps map
Loading sold comps map…
Walkable amenities ~0.75 mi
Loading nearby amenities…
Taxation est. · year 1
- Rental income
- $11,347
- − Mortgage interest
- −$3,355
- − Property taxes
- −$500
- − Insurance
- −$300
- − Repairs & maintenance
- −$908
- − Management
- −$908
- − Depreciation
- −$1,743
- Taxable income
- $3,634
- Est. tax owed @ 24.0%
- −$872
- After-tax cash flow
- $3,523/yr
For passive investors: Depreciation is non-cash, so a rental often shows a tax loss while cash-flowing — sheltering income. Rental losses are passive: they offset passive income freely, and up to $25,000/yr can offset ordinary (W-2) income if you actively participate and your MAGI is under $100k (phasing out to $0 by $150k); unused losses carry forward. On sale, claimed depreciation is recaptured at up to 25%, and gains may owe capital-gains tax (a 1031 exchange can defer both). Figures are a year-1 estimate at your 24.0% rate — not tax advice; consult a CPA.
Schools (NCES district)
- District
- Manchester Local
- NCES district ID
- 3900537
- Math proficiency
- 38% ▼ -20.00%
- Reading proficiency
- 55% ▼ -10.00%
- Median HH income
- $33,374
- Composite
- 38.23/100
- National rank
- #4246
- State rank
- #497 of 656 in OH
Livability — Manchester
- Score
- 61/100
- State rank
- #957
- US rank
- #18445
Category grades
Schools grade is shown separately in the Schools card above.
Census & demographics
- Census place
- Manchester, OH
- County
- Adams · 32,832 people
- Population (ZIP)
- 4,256
- Household income
- $43,896
- Rent vs Own
- Severe rent burden
- 9.5
Population outlook (Adams County) Hauer SSP2
- Today (2025)
- 26,467 people
- By 2030
- 25,354 · -4.2%
- By 2040
- 22,951 · -13.3%
- By 2050
- 20,394 · -22.9%
- By 2075
- 14,824 · -44.0%
- By 2100
- 9,909 · -62.6%
Race, ethnicity, and origin ACS 2023
- Neighborhood character
- Predominantly White (95%)
- Race & ethnicity
- White 95% Hispanic / Latino 2% Two or more races 2%
- Common ancestry
- Lithuanian 2% Slovak 2% Serbian 1%
- Foreign-born
- 2%
Political lean MEDSL · Adams
- 2024 margin
- Solid R (+65.7) · D 16.9% · R 82.6%
- 2008→2024 swing
- -41.6pp toward R · 2008: -24.1pp · 2024: -65.7pp
- All cycles
- 2024: R+65.7 2020: R+63.5 2016: R+55.6 2012: R+26.3 2008: R+24.1
Not yet ingested
- Civics
- —
Market trends
- HPI YoY
- ▲ 0.96%
- Current HPI
- 189.9563
- Rent YoY
- —
- Metro
- —
- State GDP YoY
- ▲ 1.98%
- F500 in state
- 48
Industry mix (Fortune 500 HQ in OH)
| Industry | F500 HQs | Revenue |
|---|---|---|
| Insurance | 3 | $145B |
|
||
| Industrial Machinery | 3 | $49B |
|
||
| Financial Services | 3 | $24B |
|
||
| Consumer Goods | 2 | $93B |
|
||
| Aerospace / Defense | 2 | $47B |
|
||
| Utilities | 2 | $33B |
|
||
Price history
+225.0% since first listed4 events — show timeline
- 2026-02-04 Listed $65,000 Cincy MLS
- 2026-01-31 Listing Removed — Cincy MLS
- 2025-10-30 Listed $69,900 Cincy MLS
- 1996-12-19 Sold (Public Records) $20,000 Public Records
Property tax history
+3.5%/yrLatest (2025): $500 · +16.5% YoY. Source: county tax records.
Cash-flow waterfall
monthlySold comps — $/sqft
last 12 mo · ≤1 miLoading sold comps…