1404 Marble St · Princeton, TX
Flood risk 1/10 · Minimal
- FEMA flood zone
- X (unshaded)
- Chance of flooding over 30 yrs
- 0.0%
- Est. flood insurance / yr
- $507 – $1,088
Fire risk 5/10 · Moderate
- Est. fire insurance / yr
- $1,222 – $2,270
Heat risk 8/10 · Major
- Hot days now (above 110°F)
- 7 days/yr
- Hot days in 30 yrs
- 24 days/yr
Wind risk 6/10 · Moderate
- Chance of severe wind over 30 yrs
- 27.0%
Air-quality risk 3/10 · Minor
- Unhealthy air days now
- 3 days/yr
- Unhealthy air days in 30 yrs
- 3 days/yr
Risk factors via First Street. Map © Google.
Why this score? — see what drove the D- grade
The composite is a weighted blend of 9 inputs, each scored 0–100. Each bar is that input's sub-score; the figure is the points it added to the 100-point composite (weight × sub-score).
- ARV discount +15.0/15.0
- Cash flow +7.6/30.0
- Schools +4.2/10.0
- Livability +3.1/5.0
- 1% rule +3.0/10.0
- Condition / age +2.5/5.0
- Rent growth +2.2/5.0
- DSCR +1.7/10.0
- Appreciation +0.0/10.0
$275,000
🖨 Deal sheet (PDF) 📄 Offer letter ✓ Due diligence
Listing remarks MLS
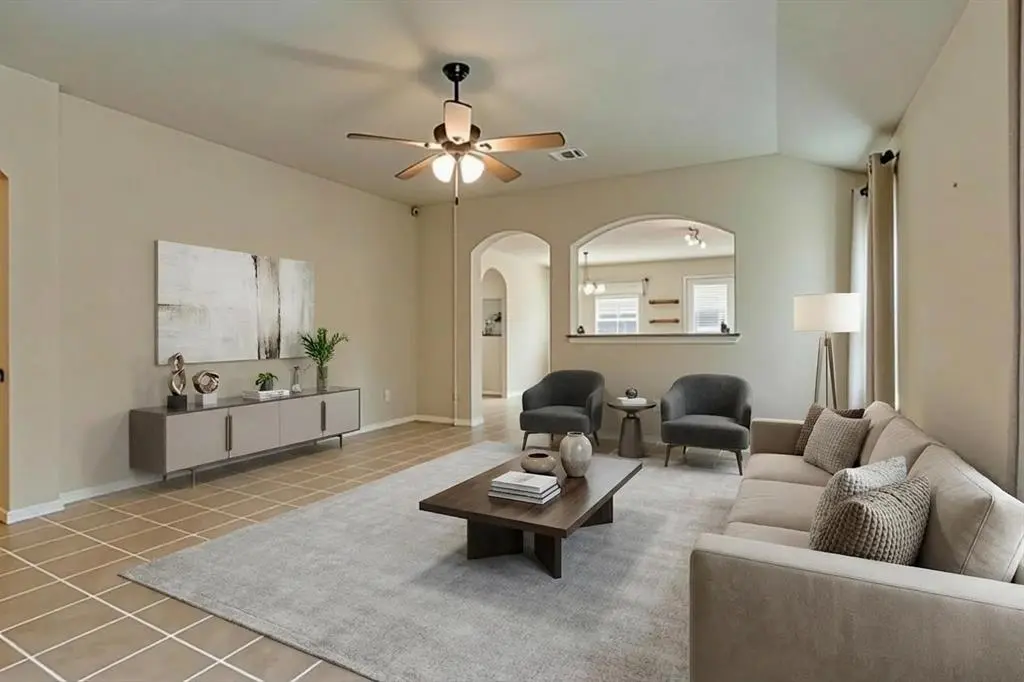
Beautifully maintained home located on an interior lot just minutes from shopping, dining, and convenient access to McKinney and the 75 tollways. This inviting home features an open-concept floor plan ideal for both everyday living and entertaining, with a spacious layout offering 4 bedrooms and 2 full bathrooms. The kitchen is well-appointed with granite countertops, stainless steel appliances, ample cabinetry, and generous pantry space. The primary suite provides a relaxing retreat with a walk-in shower, double-sink vanity, and a spacious walk-in closet. Upgraded flooring throughout the home adds a modern and cohesive touch to the living spaces. Conveniently located within walking distance to Smith Elementary and Southard Middle School. Residents can enjoy community amenities including a pool, splash pad, and park, and the property comes with the added benefit of NO MUD or PID taxes.
Key facts
- Interior lot
- Walk-in shower
- Granite countertops
Tags
Neighborhood map
What this means for you Summary
Snapshot
- This is a 4-bed/2.0-bath single-family listed at $275k.
Deal economics
- At list price, monthly cash flow is $-331 ($-4k/yr) — negative.
- To cash-flow at today's rent, offer at most $217k (21.3% below list).
- To meet the 1% rule (rent ≥ 1% of price), the offer needs to be $221k (19.7% below list).
- Recommended offer: $217k (21.3% below list) — sets the bar for cash-flow.
Location & tenants
- Location reads 62/100 on livability (#969 in TX) — a middle-class / working-renter tenant base. Strengths: employment A+, housing A+, cost of living A; Watch: amenities F, commute F, health & safety F.
- Princeton ISD (suburban): math 51% / reading 47% proficiency, ranked #188 of 826 in TX (top 23%) — families likely to look elsewhere, expect single-tenant / working-renter base with shorter leases.
- Zoned schools: Smith El (math 53% / reading 48%, grade D+, #833 of 4,322 statewide, top 20%, 683 students, 54% FRL); Clark Middle (math 53% / reading 42%, grade C-, #408 of 1,662 statewide, top 25%, 707 students, 66% FRL); Princeton H S (math 52% / reading 54%, grade C-, #437 of 1,632 statewide, top 27%, 1,521 students, 57% FRL) — zoned schools at 59% FRL track the district average.
- Market conditions: Rents soft (-1.0%/yr); 1415 active listings in the ZIP; 40 comparable units currently listed for rent nearby; rentals at typical pace (median 20d on market — plan ~3-4 weeks tenant-placement turnaround); solid renter incomes; 19,194 units permitted in Collin County in 2024 (3,988 in 5+ unit buildings).
Forward outlook
- Local home prices are declining (-3.0%/yr); year-one equity from $2k of loan paydown is wiped out by about $8k of value loss. Plan a longer hold.
- Collin County population projected at +60% by 2050 — long-run rental-demand tailwind backs the buy-and-hold thesis.
Negotiation context
- It's been on market 61 days — a 6% lower offer ($258k) is reasonable based on typical stale-listing flexibility.
Risks & watch-outs
- Climate carrying-cost: major wind risk, 27% chance of damaging wind over 30y; moderate wildfire risk; extreme-heat days projected 7→24/yr by 2055 (HVAC capex compounding) — expect insurance premiums to compound above CPI over the hold.
Questions for the listing agent
- What do current leases actually rent for vs. the listed asking? Can we see a recent rent roll and the last 12 months of T-12 income?
- It's been on market 61 days. Have you received any prior offers? Is the seller open to a 21% concession, seller financing, or rate buy-down credit?
- What does the HOA fee cover, when was the last increase, and are there any pending special assessments or reserve-fund shortfalls?
- Why hasn't it sold? Are there any deal-killer items the seller is aware of (foundation, flood, title, zoning, code violations)?
- Is there a deadline driving the sale (1031 exchange, divorce, estate, relocation)? That informs how much negotiation room exists.
- The area grade is low — what's the realistic commute time and amenity access for the typical tenant pool here? Any planned neighborhood developments (good or bad) we should know about?
- What's the average days-on-market for RENTAL listings here right now (not sales)? A rising rental-DOM trend means longer vacancies and softer asking-rent achievability than the comps imply.
- What's the recent tenant-quality profile in this submarket — average credit score on applications, eviction rate, late-payment / NSF rate, and stable-employment percentage? A property-management company in the area should have these aggregated.
- How much new for-sale + rental construction is in the pipeline within 1–3 miles? Heavy new supply typically softens prices + rents 12–24 months out; constrained supply supports both.
Investment metrics
- 1% rule
- 0.80% ✗
- Cap rate
- 4.85%
- Cash-on-cash
- -5.16%
- DSCR
- 0.77
- GRM
- 10.4
CMA / ARV
- ARV (median comp)
- $338,638
- List price
- $275,000
- Delta
- -18.79%
- Verdict
- UNDERPRICED
- Comps
- 20 within 1.0 mi
Show comp detail 12 sales within ~0.75 mi
| Address | Dist | Beds/Ba | Sqft | Sold | Price | $/sf | Match |
|---|---|---|---|---|---|---|---|
| 1404 Marble St | 0.00mi | 4/2.5 | 1,650 (0%) | 0mo | $275,000 | $167 | 98 |
| 806 Opal Path | 0.11mi | 4/2.0 | 1,590 (-4%) | 1mo | $259,000 | $163 | 88 |
| 1003 Sapphire Dr | 0.28mi | 4/2.0 | 1,630 (-1%) | 1mo | $285,000 | $175 | 84 |
| 1217 Lambert Dr | 0.46mi | 3/2.0 (-1) | 1,635 (-1%) | 2mo | $275,000 | $168 | 70 |
| 2001 Partridge Rd | 0.46mi | 3/2.0 (-1) | 1,692 (+2%) | 2mo | $318,990 | $189 | 68 |
| 1312 Riviera Dr | 0.54mi | 4/2.0 | 1,748 (+6%) | 1mo | $275,000 | $157 | 64 |
| 1208 Augustin Dr | 0.53mi | 3/2.0 (-1) | 1,591 (-4%) | 1mo | $258,000 | $162 | 64 |
| 1211 Longneck Rd | 0.69mi | 3/2.0 (-1) | 1,652 (+0%) | 1mo | $375,000 | $227 | 62 |
| 409 Kingsbury Ave | 0.70mi | 3/2.0 (-1) | 1,606 (-3%) | 2mo | $308,990 | $192 | 56 |
| 521 Big Bend Pkwy | 0.75mi | 3/2.0 (-1) | 1,606 (-3%) | 1mo | $289,990 | $181 | 55 |
| 1204 Bellevue Dr | 0.54mi | 3/2.0 (-1) | 1,432 (-13%) | 2mo | $220,000 | $154 | 46 |
| 406 Kingsbury Ave | 0.68mi | 3/2.5 (-1) | 1,810 (+10%) | 2mo | $319,990 | $177 | 44 |
Match score weights: distance 35% · size 25% · config 20% · recency 20%. Top-matched comps best support the ARV.
Projected returns pro-forma
-3.0% appreciation · 0.0% rent growth · sell at horizon
- IRR
- -28.8%
- Equity multiple
- 0.07×
- Total profit
- $-71,980
- Equity at exit
- $41,003
- IRR
- -48.8%
- Equity multiple
- -0.48×
- Total profit
- $-114,264
- Equity at exit
- $23,777
Cash invested: $77,000 (down + closing). Projections, not guarantees.
Landlord ↔ Tenant lean methodology
- Overall (STATE)
- 87 Strongly Landlord-Friendly
- State Texas
- 87 Strongly Landlord-Friendly · R+5
- County
- — inherits STATE
- City
- — inherits STATE
ZIP-level market 75407
- Home prices YoY
- -30.3%
- Rents YoY
- -1.0%
- Active inventory
- 1415
- Price-to-rent
- 10.4×
Monthly cashflow live
- Estimated rent
- $2,207 high interval (Pro) →
- Mortgage (P&I)
- −$1,442
- Tax from tax record
- −$474 /mo · $5,690/yr
- Insurance
- −$115
- HOA
- −$44
- Vacancy / Maint / Mgmt
- −$464
- Net cashflow
- $-331
Break-even live
Sensitivity live
| Price | -10% $-175 | -5% $-253 | +0% $-331 | +5% $-409 | +10% $-487 |
|---|---|---|---|---|---|
| Rent | -10% $-506 | -5% $-418 | +0% $-331 | +5% $-244 | +10% $-157 |
| Rate | -1.0pp $-193 | -0.5pp $-261 | base $-331 | +0.5pp $-402 | +1.0pp $-475 |
UW: 25.0% down · 7.5% · 30yr · 1.5% tax · 5.0% vac · 8.0% maint · 8.0% mgmt
Financing live
Cash to close
- Down payment
- $68,750
- Closing costs
- $8,250
- Reserves months
- —
- Total cash needed
- —
Loan-product check · same deal, 3 products live
Conventional
25% down · 7.5% · 30yr
- Down + closing
- —
- Monthly P&I
- —
- Monthly cashflow
- —
- DSCR
- —
- Eligible?
- —
Personal DTI + credit; lowest rate.
DSCR
20% down · 8.5% · 30yr
- Down + closing
- —
- Monthly P&I
- —
- Monthly cashflow
- —
- DSCR
- —
- Eligible?
- —
No personal income docs; deal must DSCR.
Hard money
10% down · 12.0% · 12mo
- Down + closing
- —
- Monthly P&I
- —
- Monthly cashflow
- —
- DSCR
- —
- Eligible?
- —
Short-term bridge; refi at stabilization.
Rent comps 40 comps
| Address | Beds | Baths | Sqft | Rent | $/sqft | DOM | Units | Dist |
|---|---|---|---|---|---|---|---|---|
| 802 Platinum Dr Princeton, TX | 4.0 | 2.0 | 1710 | $1,875 | $1.10 | 23d | 1 | 0.11mi |
| 904 Opal Path Princeton, TX | 4.0 | 2.0 | 1891 | $1,995 | $1.05 | 46d | 1 | 0.13mi |
| 1101 Emerald Dr Princeton, TX | 4.0 | 2.0 | 1630 | $1,800 | $1.10 | 26d | 1 | 0.21mi |
| 1655 Ratama Dr Princeton, TX | 4.0 | 2.0 | 1851 | $2,250 | $1.22 | 15d | 1 | 0.22mi |
| 1008 Emerald Dr Princeton, TX | 4.0 | 2.5 | 2119 | $2,300 | $1.09 | 46d | 1 | 0.23mi |
| 1009 Riverstone Trl Princeton, TX | 5.0 | 2.0 | 2047 | $2,195 | $1.07 | 12d | 1 | 0.26mi |
| 908 Mercury Dr Princeton, TX | 4.0 | 2.0 | 1630 | $1,875 | $1.15 | 46d | 1 | 0.30mi |
| 600 W Monte Carlo Blvd Princeton, TX | 1.0–3.0 | 1.0–2.0 | 1245 | $1,728 | $1.39 | 0d | 30 | 0.30mi |
| 900 Sapphire Dr Princeton, TX | 5.0 | 2.0 | 2046 | $2,300 | $1.12 | 46d | 1 | 0.32mi |
| 909 Cormorant St Princeton, TX | 3.0 | 2.5 | 2141 | $2,100 | $0.98 | 7d | 1 | 0.34mi |
| 811 Emerald Dr Princeton, TX | 4.0 | 2.0 | 2080 | $2,250 | $1.08 | 46d | 1 | 0.35mi |
| 1405 Diamond Ct Princeton, TX | 4.0 | 2.0 | 1891 | $1,925 | $1.02 | 46d | 1 | 0.37mi |
| 1123 Garnet St Princeton, TX | 3.0 | 2.0 | 1891 | $1,980 | $1.05 | 23d | 1 | 0.37mi |
| 1911 Sandpiper Way Princeton, TX | 3.0 | 2.0 | 1977 | $1,950 | $0.99 | 1d | 1 | 0.44mi |
| 1048 Churchill Dr Princeton, TX | 4.0 | 2.0 | 1901 | $1,950 | $1.03 | 46d | 1 | 0.45mi |
| 1118 Grace Dr Princeton, TX | 4.0 | 2.0 | 1924 | $2,850 | $1.48 | 1d | 1 | 0.46mi |
| 1210 Antoinette Dr Princeton, TX | 3.0 | 2.5 | 2244 | $2,045 | $0.91 | 6d | 1 | 0.48mi |
| 1114 Augustin Dr Princeton, TX | 3.0 | 2.5 | 2226 | $1,700 | $0.76 | 46d | 1 | 0.48mi |
| 1213 Lambert Dr Princeton, TX | 3.0 | 2.0 | 1691 | $1,950 | $1.15 | 1d | 1 | 0.49mi |
| 1062 Churchill Dr Princeton, TX | 4.0 | 2.0 | 1901 | $1,889 | $0.99 | 9d | 1 | 0.50mi |
| 1217 Caroline Dr Princeton, TX | 4.0 | 2.0 | 1948 | $1,975 | $1.01 | 7d | 1 | 0.52mi |
| 1114 Bellevue Dr Princeton, TX | 4.0 | 2.0 | 1591 | $1,949 | $1.23 | 4d | 1 | 0.52mi |
| 1101 Rainer Dr Princeton, TX | 4.0 | 2.0 | 1712 | $2,150 | $1.26 | 26d | 1 | 0.55mi |
| 1202 Meadow Wood Ct Princeton, TX | 5.0 | 2.0 | 2044 | $2,400 | $1.17 | 6d | 1 | 0.55mi |
| 812 Indigo Rd Princeton, TX | 3.0 | 2.0 | 1653 | $2,200 | $1.33 | 46d | 1 | 0.56mi |
| 1302 Meadow Creek Dr Princeton, TX | 4.0 | 2.0 | 1889 | $2,095 | $1.11 | 9d | 1 | 0.57mi |
| 1218 Meadow Creek Dr Princeton, TX | 4.0 | 2.0 | 1567 | $1,726 | $1.10 | 19d | 1 | 0.57mi |
| 1218 Meadow Creek Dr Princeton, TX | 4.0 | 2.0 | 1567 | $1,715 | $1.09 | 12d | 1 | 0.57mi |
| 2107 Camellia St Princeton, TX | 4.0 | 2.0 | 1829 | $2,200 | $1.20 | 15d | 1 | 0.57mi |
| 1210 Augustin Dr Princeton, TX | 4.0 | 2.0 | 1760 | $1,750 | $0.99 | 19d | 1 | 0.58mi |
| 1111 Meadow Side Dr Princeton, TX | 4.0 | 4.0 | 1567 | $2,195 | $1.40 | 9d | 1 | 0.59mi |
| 1121 Rainer Dr Princeton, TX | 4.0 | 2.0 | 1892 | $1,900 | $1.00 | 1d | 1 | 0.60mi |
| 418 Kingsbury Ave Princeton, TX | 4.0 | 2.0 | 1810 | $2,095 | $1.16 | 46d | 1 | 0.61mi |
| 406 Kingsbury Ave Princeton, TX | 3.0 | 2.0 | 1810 | $2,095 | $1.16 | 46d | 1 | 0.63mi |
| 515 Creekside Dr Princeton, TX | 3.0 | 2.0 | 1540 | $1,900 | $1.23 | 46d | 1 | 0.64mi |
| 1212 Roman Dr Princeton, TX | 4.0 | 2.0 | 1712 | $1,895 | $1.11 | 19d | 1 | 0.65mi |
| 610 Union Dr Princeton, TX | 4.0 | 2.0 | 1829 | $2,350 | $1.28 | 26d | 1 | 0.67mi |
| 1658 Palladio Loop Unit 1658 Princeton, TX | 3.0 | 3.5 | 1994 | $1,950 | $0.98 | 23d | 1 | 0.68mi |
| 1610 Palladio Loop Princeton, TX | 3.0 | 2.5 | 1957 | $1,899 | $0.97 | 46d | 1 | 0.69mi |
| 1011 Meadow Green Ct Princeton, TX | 3.0 | 2.0 | 1580 | $1,895 | $1.20 | 15d | 1 | 0.69mi |
HOA detail
- Monthly dues
- $44 · $528/yr
- Likely covers
- pool
Listing history 2 events
-
2026-05-17historical Active Option Contract 898-char remark
Show marketing remark (898 chars)
Beautifully maintained home located on an interior lot just minutes from shopping, dining, and convenient access to McKinney and the 75 tollways. This inviting home features an open-concept floor plan ideal for both everyday living and entertaining, with a spacious layout offering 4 bedrooms and 2 full bathrooms. The kitchen is well-appointed with granite countertops, stainless steel appliances, ample cabinetry, and generous pantry space. The primary suite provides a relaxing retreat with a walk-in shower, double-sink vanity, and a spacious walk-in closet. Upgraded flooring throughout the home adds a modern and cohesive touch to the living spaces. Conveniently located within walking distance to Smith Elementary and Southard Middle School. Residents can enjoy community amenities including a pool, splash pad, and park, and the property comes with the added benefit of NO MUD or PID taxes.
-
2026-03-13$275,000 Active 898-char remark
Show marketing remark (898 chars)
Beautifully maintained home located on an interior lot just minutes from shopping, dining, and convenient access to McKinney and the 75 tollways. This inviting home features an open-concept floor plan ideal for both everyday living and entertaining, with a spacious layout offering 4 bedrooms and 2 full bathrooms. The kitchen is well-appointed with granite countertops, stainless steel appliances, ample cabinetry, and generous pantry space. The primary suite provides a relaxing retreat with a walk-in shower, double-sink vanity, and a spacious walk-in closet. Upgraded flooring throughout the home adds a modern and cohesive touch to the living spaces. Conveniently located within walking distance to Smith Elementary and Southard Middle School. Residents can enjoy community amenities including a pool, splash pad, and park, and the property comes with the added benefit of NO MUD or PID taxes.
ⓘ Source: listings_history table (triggers on properties + properties_extension) + one-shot
backfill from property_details.listing_events for pre-trigger history.
Tax reassessment forecast TX · Resets to sale price
- Current annual tax
- $5,690 · $474/mo
- Projected year-2 tax
- $5,690 · $474/mo
- Expected delta
- $0/yr ($0/mo · 0.0%)
ⓘ Screening estimate from a state-policy table — verify with the county assessor before closing.
Climate risk First Street
- Flood 1/10 Low FEMA zone X (unshaded) · 0% chance over 30 yrs
- Wildfire 5/10 Major
- Heat 8/10 Severe 7 d/yr ≥110°F today · 24 d/yr by 30 yrs out
- Wind 6/10 Major 27% chance of damaging wind over 30 yrs
- Air quality 3/10 Moderate 3 unhealthy d/yr today · 3 by 30 yrs out
Nearby sold comps map
Loading sold comps map…
Walkable amenities ~0.75 mi
Loading nearby amenities…
Taxation est. · year 1
- Rental income
- $26,487
- − Mortgage interest
- −$15,404
- − Property taxes
- −$5,690
- − Insurance
- −$1,375
- − Repairs & maintenance
- −$2,119
- − Management
- −$2,119
- − HOA
- −$528
- − Depreciation
- −$8,000
- Taxable loss
- −$8,748
- Est. tax savings @ 24.0%
- +$2,100
- After-tax cash flow
- $-1,874/yr
For passive investors: Depreciation is non-cash, so a rental often shows a tax loss while cash-flowing — sheltering income. Rental losses are passive: they offset passive income freely, and up to $25,000/yr can offset ordinary (W-2) income if you actively participate and your MAGI is under $100k (phasing out to $0 by $150k); unused losses carry forward. On sale, claimed depreciation is recaptured at up to 25%, and gains may owe capital-gains tax (a 1031 exchange can defer both). Figures are a year-1 estimate at your 24.0% rate — not tax advice; consult a CPA.
Schools (NCES district)
- District
- Princeton ISD
- NCES district ID
- 4835850
- Math proficiency
- 51% ▼ -8.00%
- Reading proficiency
- 47% ▬ 0.00%
- Median HH income
- $54,827
- Composite
- 42.44/100
- National rank
- #3226
- State rank
- #188 of 826 in TX
Livability — Princeton
- Score
- 62/100
- State rank
- #969
- US rank
- #17215
Category grades
Schools grade is shown separately in the Schools card above.
Census & demographics
- Census place
- Princeton, TX
- County
- Collin County · 1,159,394 people
- City population
- 34,171
- Metro
- Dallas-Fort Worth-Arlington, TX
- Population (ZIP)
- 34,171
- Household income
- $100,037
- Rent vs Own
- Severe rent burden
- 368.0
Population outlook (Collin County) Hauer SSP2
- Today (2025)
- 1,210,074 people
- By 2030
- 1,358,201 · +12.2%
- By 2040
- 1,654,061 · +36.7%
- By 2050
- 1,937,359 · +60.1%
- By 2075
- 2,567,039 · +112.1%
- By 2100
- 2,952,048 · +144.0%
Race, ethnicity, and origin ACS 2023
- Neighborhood character
- Diverse neighborhood (Simpson 0.66)
- Race & ethnicity
- White 47% Hispanic / Latino 30% Black 17% Two or more races 10% Asian 4% Native American 1%
- Hispanic origin (detail)
- Mexican 26%
- Common ancestry
- Lithuanian 2% Romanian 1% Russian 1%
- Foreign-born
- 15% · Canada, China, Mexico
- Languages at home
- 70% English-only · Spanish 22% Other Indo-European 2% Other Asian/Pacific 1%
Political lean MEDSL · Collin
- 2024 margin
- R (+11.1) · D 43.1% · R 54.3% · Other 2.6%
- 2008→2024 swing
- +14.4pp toward D · 2008: -25.6pp · 2024: -11.1pp
- All cycles
- 2024: R+11.1 2020: R+4.3 2016: R+17.0 2012: R+31.6 2008: R+25.6
Not yet ingested
- Civics
- —
Market trends
- HPI YoY
- ▼ -103.99%
- Current HPI
- 238.9373
- Rent YoY
- ▼ -1.02%
- Metro
- Dallas-Fort Worth-Arlington, TX
- State GDP YoY
- ▲ 3.95%
- F500 in state
- 110
Industry mix (Fortune 500 HQ in TX)
| Industry | F500 HQs | Revenue |
|---|---|---|
| Energy | 16 | $1,198B |
|
||
| Technology | 5 | $198B |
|
||
| Engineering / Construction | 4 | $72B |
|
||
| Energy Services | 3 | $60B |
|
||
| Utilities | 3 | $41B |
|
||
| Healthcare | 2 | $330B |
|
||
Price history
2 events — show timeline
- 2026-05-17 Contingent — NTREIS
- 2026-03-13 Listed $275,000 NTREIS
Property tax history
+0.7%/yrLatest (2025): $5,690 · -1.5% YoY. Source: county tax records.
Cash-flow waterfall
monthlySold comps — $/sqft
last 12 mo · ≤1 miLoading sold comps…