308 S Charleston St · Blacksburg, SC
Flood risk 1/10 · Minimal
- FEMA flood zone
- X (unshaded)
- Chance of flooding over 30 yrs
- 0.0%
- Est. flood insurance / yr
- $507 – $1,088
Fire risk 4/10 · Minor
- Est. fire insurance / yr
- $783 – $1,453
Heat risk 6/10 · Moderate
- Hot days now (above 103°F)
- 7 days/yr
- Hot days in 30 yrs
- 17 days/yr
Wind risk 3/10 · Minor
- Chance of severe wind over 30 yrs
- 6.0%
Air-quality risk 4/10 · Minor
- Unhealthy air days now
- 4 days/yr
- Unhealthy air days in 30 yrs
- 4 days/yr
Risk factors via First Street. Map © Google.
Why this score? — see what drove the B- grade
The composite is a weighted blend of 9 inputs, each scored 0–100. Each bar is that input's sub-score; the figure is the points it added to the 100-point composite (weight × sub-score).
- Cash flow +27.4/30.0
- ARV discount +15.0/15.0
- DSCR +9.6/10.0
- 1% rule +7.2/10.0
- Schools +2.8/10.0
- Livability +2.8/5.0
- Rent growth +2.5/5.0
- Condition / age +2.5/5.0
- Appreciation +0.0/10.0
$125,000
🖨 Deal sheet 📄 Offer letter ✓ Due diligence
Listing remarks
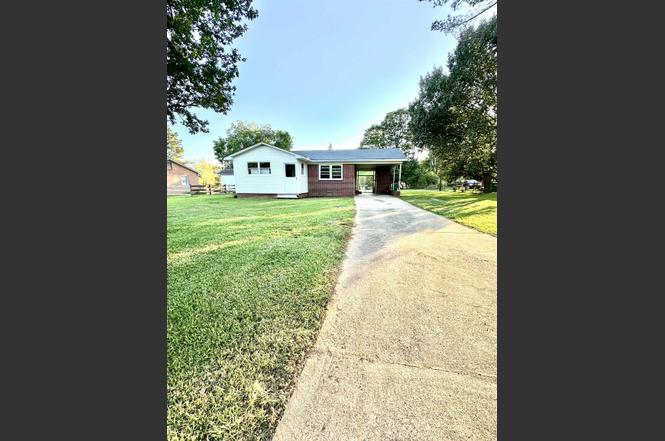
EXCELLENT LOCATION AND AFFORDABILITY . .. You don't find those two together very often! This home has tons of potential for a great starter home, investment property OR for someone looking to down size! Featuring a timeless brick exterior and hardwood floors throughout, this home has vinyl windows, formal dining room, enclosed front porch, covered car port, enclosed utility room and an extra concrete pad! This property is just minutes to I-85, public schools, police and fire department. This could be an excellent project and an even better place to call home!
Key facts
- Vinyl windows
- Brick exterior
- Formal dining room
Tags
Property features AI
Exterior
- Parking: Attached garage; 1 garage space; Carport; Driveway
- Utilities: Public water; Public sewer
- Home design: Single-family residence; One story
- Construction: Brick veneer construction; Composition roof
- Exterior features: Level lot
Interior
- Kitchen: Range; Refrigerator
- Flooring: Hardwood; Laminate
- Bathrooms: 1 full bathroom
- Heating & cooling: Central air; Ceiling fan(s); Electric cooling; Electric forced-air heating
- Interior features: Ceiling fan(s); Storm windows
- Laundry & utility: Laundry located in kitchen; Electric water heater
Neighborhood map
What this means for you Summary
Snapshot
- This is a 1-bed/1.0-bath single-family listed at $125k.
Deal economics
- At list price, monthly cash flow is $364 ($4k/yr) — positive.
- The deal already cash-flows at list — no discount required.
- Meets the 1% rule at list price ($2k rent vs $125k).
- Recommended offer: $114k (9.0% below list) — sets the bar for market timing.
Location & tenants
- Location reads 56/100 on livability (#289 in SC) — a working-class tenant base; expect higher turnover. Strengths: cost of living A+; Watch: amenities F, commute F, employment F.
- Cherokee 01 (rural): math 29% / reading 40% proficiency, ranked #47 of 80 in SC (top 59%) — families likely to look elsewhere, expect single-tenant / working-renter base with shorter leases; 64% free/reduced lunch — lower-income household profile, screen leases tightly.
- Zoned schools: Blacksburg Elementary (math 34% / reading 36%, grade F, #339 of 597 statewide, top 57%, 362 students, 100% FRL); Blacksburg Middle (math 23% / reading 32%, grade F, #147 of 229 statewide, top 66%, 360 students, 72% FRL); Blacksburg High (math 42% / reading 92%, grade B, #73 of 196 statewide, top 41%, 553 students, 80% FRL) — zoned schools average 84% FRL vs 64% district-wide (20 pts higher); higher-poverty schools than district average — tighter screening recommended.
- Market conditions: 45 active listings in the ZIP; 200 units permitted in Cherokee County in 2024 (0 in 5+ unit buildings).
Forward outlook
- Local home prices are declining (-3.0%/yr); year-one equity from $864 of loan paydown is wiped out by about $4k of value loss. Plan a longer hold.
- At projected returns (-3.0% appreciation + 3.0% rent growth), your $35k cash investment doubles in ~10 years — after that, you're playing with house money.
Negotiation context
- It's been on market 95 days — a 9% lower offer ($114k) is reasonable based on typical stale-listing flexibility.
- 2 sale attempts with the ask held roughly flat each time — persistent listings suggest the price (not the market) is what's stuck; bring a comps-based counter.
Risks & watch-outs
- Climate carrying-cost: extreme-heat days projected 7→17/yr by 2055 (HVAC capex compounding) — expect insurance premiums to compound above CPI over the hold.
Questions for the listing agent
- It's been on market 95 days. Have you received any prior offers? Is the seller open to a 9% concession, seller financing, or rate buy-down credit?
- Built in 1965 — when were the roof, HVAC, electrical panel, plumbing, and water heater last replaced?
- Why hasn't it sold? Are there any deal-killer items the seller is aware of (foundation, flood, title, zoning, code violations)?
- Is there a deadline driving the sale (1031 exchange, divorce, estate, relocation)? That informs how much negotiation room exists.
- Schools are D-rated, which usually means shorter tenancies and higher turnover. Who's the typical renter profile here, and what's been the actual vacancy rate?
- What's the average days-on-market for RENTAL listings here right now (not sales)? A rising rental-DOM trend means longer vacancies and softer asking-rent achievability than the comps imply.
- What's the recent tenant-quality profile in this submarket — average credit score on applications, eviction rate, late-payment / NSF rate, and stable-employment percentage? A property-management company in the area should have these aggregated.
- How much new for-sale + rental construction is in the pipeline within 1–3 miles? Heavy new supply typically softens prices + rents 12–24 months out; constrained supply supports both.
Investment metrics
- 1% rule
- 1.22% ✓
- Cap rate
- 9.79%
- Cash-on-cash
- 12.48%
- DSCR
- 1.56
- GRM
- 6.8
CMA / ARV
- ARV (on-the-fly)
- $168,640
- Comps found
- 3
Show comp detail 3 sales within ~0.75 mi
| Address | Dist | Beds/Ba | Sqft | Sold | Price | $/sf | Match |
|---|---|---|---|---|---|---|---|
| 304 S Rutherford St | 0.45mi | 2/1.0 (+1) | 1,025 (+3%) | 3mo | $89,250 | $87 | 66 |
| 401 N Charleston St | 0.63mi | 2/2.0 (+1) | 1,000 (+1%) | 6mo | $188,000 | $188 | 55 |
| 204 E Ramseur Dr | 0.66mi | 2/1.0 (+1) | 1,114 (+12%) | 8mo | $189,000 | $170 | 37 |
Match score weights: distance 35% · size 25% · config 20% · recency 20%. Top-matched comps best support the ARV.
Projected returns pro-forma
-3.0% appreciation · 3.0% rent growth · sell at horizon
- IRR
- 2.2%
- Equity multiple
- 1.08×
- Total profit
- $2,947
- Equity at exit
- $18,638
- IRR
- 11.8%
- Equity multiple
- 1.93×
- Total profit
- $32,471
- Equity at exit
- $10,808
Cash invested: $35,000 (down + closing). Projections, not guarantees.
Landlord ↔ Tenant lean methodology
- Overall (STATE)
- 90 Strongly Landlord-Friendly
- State South Carolina
- 90 Strongly Landlord-Friendly · R+6
- County
- — inherits STATE
- City
- — inherits STATE
ZIP-level market 29702
- Home prices YoY
- -23.9%
- Active inventory
- 45
- Price-to-rent
- 6.8×
Monthly cashflow live
- Estimated rent
- $1,528 medium interval (Pro) →
- Mortgage (P&I)
- −$656
- Tax from tax record
- −$136 /mo · $1,628/yr
- Insurance
- −$52
- HOA
- −$0
- Vacancy / Maint / Mgmt
- −$321
- Net cashflow
- $364
Break-even live
UW: 25.0% down · 7.5% · 30yr · 1.5% tax · 5.0% vac · 8.0% maint · 8.0% mgmt
Financing live
Cash to close
- Down payment
- $31,250
- Closing costs
- $3,750
- Reserves months
- —
- Total cash needed
- —
Loan-product check · same deal, 3 products live
Conventional
25% down · 7.5% · 30yr
- Down + closing
- —
- Monthly P&I
- —
- Monthly cashflow
- —
- DSCR
- —
- Eligible?
- —
Personal DTI + credit; lowest rate.
DSCR
20% down · 8.5% · 30yr
- Down + closing
- —
- Monthly P&I
- —
- Monthly cashflow
- —
- DSCR
- —
- Eligible?
- —
No personal income docs; deal must DSCR.
Hard money
10% down · 12.0% · 12mo
- Down + closing
- —
- Monthly P&I
- —
- Monthly cashflow
- —
- DSCR
- —
- Eligible?
- —
Short-term bridge; refi at stabilization.
Listing history 17 events
-
2026-06-18status $125,000 Pending 95 DOM
-
2026-06-17days on market $125,000 Active 95 DOM
-
2026-06-16days on market $125,000 Active 94 DOM
-
2026-06-15days on market $125,000 Active 93 DOM
-
2026-06-14days on market $125,000 Active 91 DOM
-
2026-06-13days on market $125,000 Active 90 DOM
-
2026-06-10days on market $125,000 Active 88 DOM
-
2026-06-09days on market $125,000 Active 87 DOM
-
2026-06-08days on market $125,000 Active 86 DOM
-
2026-06-07days on market $125,000 Active 85 DOM
-
2026-06-02days on market $125,000 Active 80 DOM
-
2026-06-01days on market $125,000 Active 79 DOM
-
2026-05-31days on market $125,000 Active 78 DOM
-
2026-05-30days on market $125,000 Active 77 DOM
-
2026-04-05status Active
-
2026-03-22status Pending
-
2026-02-28$125,000 Active
ⓘ Source: listings_history table (triggers on properties + properties_extension) + one-shot
backfill from property_details.listing_events for pre-trigger history.
Tax reassessment forecast SC · Resets to sale price
- Current annual tax
- $1,628 · $136/mo
- Projected year-2 tax
- $1,628 · $136/mo
- Expected delta
- $0/yr ($0/mo · 0.0%)
ⓘ Screening estimate from a state-policy table — verify with the county assessor before closing.
Climate risk First Street
- Flood 1/10 Low FEMA zone X (unshaded) · 0% chance over 30 yrs
- Wildfire 4/10 Moderate
- Heat 6/10 Major 7 d/yr ≥103°F today · 17 d/yr by 30 yrs out
- Wind 3/10 Moderate 6% chance of damaging wind over 30 yrs
- Air quality 4/10 Moderate 4 unhealthy d/yr today · 4 by 30 yrs out
Nearby sold comps map
Loading sold comps map…
Walkable amenities ~0.75 mi
Loading nearby amenities…
Taxation est. · year 1
- Rental income
- $18,340
- − Mortgage interest
- −$7,002
- − Property taxes
- −$1,628
- − Insurance
- −$625
- − Repairs & maintenance
- −$1,467
- − Management
- −$1,467
- − Depreciation
- −$3,636
- Taxable income
- $2,514
- Est. tax owed @ 24.0%
- −$603
- After-tax cash flow
- $3,766/yr
For passive investors: Depreciation is non-cash, so a rental often shows a tax loss while cash-flowing — sheltering income. Rental losses are passive: they offset passive income freely, and up to $25,000/yr can offset ordinary (W-2) income if you actively participate and your MAGI is under $100k (phasing out to $0 by $150k); unused losses carry forward. On sale, claimed depreciation is recaptured at up to 25%, and gains may owe capital-gains tax (a 1031 exchange can defer both). Figures are a year-1 estimate at your 24.0% rate — not tax advice; consult a CPA.
Schools (NCES district)
- District
- Cherokee 01
- NCES district ID
- 4501500
- Math proficiency
- 29% ▼ -9.00%
- Reading proficiency
- 40% ▼ -2.00%
- Median HH income
- $34,262
- Composite
- 28.39/100
- National rank
- #6768
- State rank
- #47 of 80 in SC
Livability — Blacksburg
- Score
- 56/100
- State rank
- #289
- US rank
- #22576
Category grades
Schools grade is shown separately in the Schools card above.
Census & demographics
- Census place
- Blacksburg, SC
- Population (ZIP)
- 9,855
Population outlook (Cherokee County) Hauer SSP2
- Today (2025)
- 58,602 people
- By 2030
- 59,336 · +1.3%
- By 2040
- 60,266 · +2.8%
- By 2050
- 60,314 · +2.9%
- By 2075
- 59,276 · +1.2%
- By 2100
- 53,788 · -8.2%
Race, ethnicity, and origin ACS 2023
- Neighborhood character
- Predominantly White (87%)
- Race & ethnicity
- White 87% Two or more races 5% Black 5% Hispanic / Latino 4%
- Common ancestry
- Serbian 1% Lithuanian 1% Scottish 1%
- Foreign-born
- 2% · Canada, Jamaica
- Languages at home
- 97% English-only · Spanish 2%
Political lean MEDSL · Cherokee
- 2024 margin
- Solid R (+51.4) · D 23.9% · R 75.3%
- 2008→2024 swing
- -22.0pp toward R · 2008: -29.3pp · 2024: -51.4pp
- All cycles
- 2024: R+51.4 2020: R+43.8 2016: R+41.7 2012: R+29.3 2008: R+29.3
Not yet ingested
- Civics
- —
Market trends
- HPI YoY
- ▼ -49.63%
- Current HPI
- 158.1138
- Rent YoY
- —
- Metro
- —
- State GDP YoY
- ▲ 4.51%
- F500 in state
- 2
Industry mix (Fortune 500 HQ in SC)
| Industry | F500 HQs | Revenue |
|---|---|---|
| Packaging | 1 | $7B |
|
||
Price history
3 events — show timeline
- 2026-04-05 Relisted — SPMLS
- 2026-03-22 Pending — SPMLS
- 2026-02-28 Listed $125,000 SPMLS
Property tax history
+9.5%/yrLatest (2025): $1,628 · +4.1% YoY. Source: county tax records.
Cash-flow waterfall
monthlySold comps — $/sqft
last 12 mo · ≤1 miLoading sold comps…