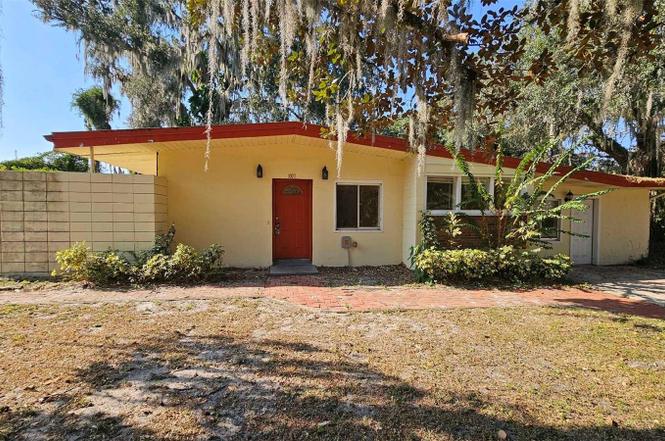
1017 Cypress St · Leesburg, FL
Flood risk 1/10 · Minimal
- FEMA flood zone
- X (unshaded)
- Chance of flooding over 30 yrs
- 0.0%
- Est. flood insurance / yr
- $507 – $1,088
Fire risk 2/10 · Minimal
- Est. fire insurance / yr
- $947 – $1,759
Heat risk 8/10 · Major
- Hot days now (above 107°F)
- 7 days/yr
- Hot days in 30 yrs
- 22 days/yr
Wind risk 9/10 · Severe
- Chance of severe wind over 30 yrs
- 99.0%
Air-quality risk 2/10 · Minimal
- Unhealthy air days now
- 1 days/yr
- Unhealthy air days in 30 yrs
- 1 days/yr
Risk factors via First Street. Map © Google.
Why this score? — see what drove the D+ grade
The composite is a weighted blend of 9 inputs, each scored 0–100. Each bar is that input's sub-score; the figure is the points it added to the 100-point composite (weight × sub-score).
- ARV discount +15.0/15.0
- Cash flow +14.2/30.0
- DSCR +4.3/10.0
- 1% rule +4.2/10.0
- Schools +4.2/10.0
- Livability +3.1/5.0
- Condition / age +2.5/5.0
- Rent growth +2.3/5.0
- Appreciation +0.0/10.0
$255,000
🖨 Deal sheet (PDF) 📄 Offer letter ✓ Due diligence
Listing remarks MLS
GREAT FAMILY HOME IN DESIREABLE LEESBURG LOCATION. ALL NEW WOOD FLOORING, NEW FIXTURES, INGROUND SWIMMING POOL, FIREPLACE IN GREAT ROOM, MANY IMPROVEMENTS MADE TO THIS HOME, COME AND SEE! EASY ACCESS-VACANT!
Key facts
- Refreshing pool
- Corner-lot location
- 0.29 acre lot
Tags
Property features AI
Finance
- Other: Lot size about 0.29 acres (1/4 to less than 1/2 acre)
Exterior
- Utilities: Public water; Public sewer; Electricity connected; Water connected
- Home design: Single family residence; Residential property; One story; Faces east
- Construction: Stucco exterior; Other roof; Slab foundation
- Exterior features: Private in-ground pool; Asphalt road access
Interior
- Kitchen: Convection oven; Dishwasher; Microwave; Refrigerator
- Bedrooms: 4 bedrooms
- Flooring: Ceramic tile; Wood
- Bathrooms: 3 full baths; 1 half bath
- Heating & cooling: Central air; Other heating
- Interior features: Walk-in closets; Living room fireplace
- Laundry & utility: Separate laundry room
Neighborhood map
What this means for you Summary
Snapshot
- This is a 4-bed/4.0-bath single-family listed at $255k.
Deal economics
- At list price, monthly cash flow is $42 ($509/yr) — positive.
- The deal already cash-flows at list — no discount required.
- To meet the 1% rule (rent ≥ 1% of price), the offer needs to be $235k (7.8% below list).
- Recommended offer: $224k (12.0% below list) — sets the bar for market timing.
- Cap rate 6.5% vs local median 4.4% in Leesburg — top-decile yield for the area; either an underpriced asset or a hidden risk that comps aren't pricing in. Stress-test before assuming the spread holds.
Location & tenants
- Location reads 62/100 on livability (#751 in FL) — a middle-class / working-renter tenant base. Strengths: cost of living A+, housing A+; Watch: crime D, amenities F, commute F.
- Lake (suburban): math 49% / reading 50% proficiency, ranked #37 of 73 in FL (top 51%) — families likely to look elsewhere, expect single-tenant / working-renter base with shorter leases.
- Zoned schools: Beverly Shores Elementary School (math 38% / reading 31%, grade F, #1,709 of 2,144 statewide, top 81%, 626 students, 73% FRL); Carver Middle School (math 41% / reading 41%, grade F, #353 of 571 statewide, top 63%, 837 students, 65% FRL); Leesburg High School (math 24% / reading 32%, grade F, #464 of 667 statewide, top 70%, 1,641 students, 58% FRL) — zoned schools average 65% FRL vs 49% district-wide (16 pts higher); higher-poverty schools than district average — tighter screening recommended.
- Zoned-school proficiency averages 34% at this address vs 50% district-wide (-15 pts) — the specific schools serving this property underperform the Lake average; the district grade overstates school quality for this exact location.
- Market conditions: Rents soft (-0.9%/yr); 798 active listings in the ZIP; 3 comparable units currently listed for rent nearby; rentals at typical pace (median 26d on market — plan ~3-4 weeks tenant-placement turnaround); 4,799 units permitted in Lake County in 2024 (814 in 5+ unit buildings).
- At $2,352/mo this rent would consume 49% of the median local household income ($58k/yr) (locally 1745% of renters already pay >50% of income on rent) — very limited rent-growth headroom before tenants either downsize or default.
Forward outlook
- Local home prices are declining (-3.0%/yr); year-one equity from $2k of loan paydown is wiped out by about $8k of value loss. Plan a longer hold.
- Lake County population projected at +37% by 2050 — long-run rental-demand tailwind backs the buy-and-hold thesis.
Negotiation context
- It's been on market 188 days — a 12% lower offer ($224k) is reasonable based on typical stale-listing flexibility.
- 11 sale attempts since 20y ago; this cycle's ask has dropped $45k (15%) from the opening price — seller is motivated, your offer sets the floor, not the list.
Risks & watch-outs
- Watch-outs: built in 1957 — expect roof / HVAC / electrical / plumbing capex.
- Climate carrying-cost: severe wind risk, 99% chance of damaging wind over 30y; extreme-heat days projected 7→22/yr by 2055 (HVAC capex compounding) — expect insurance premiums to compound above CPI over the hold.
Questions for the listing agent
- It's been on market 188 days. Have you received any prior offers? Is the seller open to a 12% concession, seller financing, or rate buy-down credit?
- Built in 1957 — when were the roof, HVAC, electrical panel, plumbing, and water heater last replaced?
- Why hasn't it sold? Are there any deal-killer items the seller is aware of (foundation, flood, title, zoning, code violations)?
- Is there a deadline driving the sale (1031 exchange, divorce, estate, relocation)? That informs how much negotiation room exists.
- Schools are D-rated, which usually means shorter tenancies and higher turnover. Who's the typical renter profile here, and what's been the actual vacancy rate?
- Crime grade is D in this area — have there been break-ins, vandalism, or insurance claims at this property in the last 3 years? What carrier currently insures it and at what premium?
- The area grade is low — what's the realistic commute time and amenity access for the typical tenant pool here? Any planned neighborhood developments (good or bad) we should know about?
- What's the average days-on-market for RENTAL listings here right now (not sales)? A rising rental-DOM trend means longer vacancies and softer asking-rent achievability than the comps imply.
- What's the recent tenant-quality profile in this submarket — average credit score on applications, eviction rate, late-payment / NSF rate, and stable-employment percentage? A property-management company in the area should have these aggregated.
- How much new for-sale + rental construction is in the pipeline within 1–3 miles? Heavy new supply typically softens prices + rents 12–24 months out; constrained supply supports both.
Investment metrics
- 1% rule
- 0.92% ✗
- Cap rate
- 6.49%
- Cash-on-cash
- 0.71%
- DSCR
- 1.03
- GRM
- 9.0
CMA / ARV
- ARV (on-the-fly)
- $351,054
- Comps found
- 1
Show comp detail 1 sale within ~0.75 mi
| Address | Dist | Beds/Ba | Sqft | Sold | Price | $/sf | Match |
|---|---|---|---|---|---|---|---|
| 1206 Sunshine Ave | 0.66mi | 4/2.0 | 2,309 (+7%) | 10mo | $375,000 | $162 | 42 |
Match score weights: distance 35% · size 25% · config 20% · recency 20%. Top-matched comps best support the ARV.
Projected returns pro-forma
-3.0% appreciation · 0.0% rent growth · sell at horizon
- IRR
- -18.7%
- Equity multiple
- 0.36×
- Total profit
- $-45,445
- Equity at exit
- $38,021
- IRR
- -19.0%
- Equity multiple
- 0.13×
- Total profit
- $-62,457
- Equity at exit
- $22,048
Cash invested: $71,400 (down + closing). Projections, not guarantees.
Landlord ↔ Tenant lean methodology
- Overall (STATE)
- 87 Strongly Landlord-Friendly
- State Florida
- 87 Strongly Landlord-Friendly · R+3
- County
- — inherits STATE
- City
- — inherits STATE
ZIP-level market 34748
- Home prices YoY
- -25.3%
- Rents YoY
- -0.9%
- Active inventory
- 798
- Price-to-rent
- 9.0×
Monthly cashflow live
- Estimated rent
- $2,352 medium interval (Pro) →
- Mortgage (P&I)
- −$1,337
- Tax from tax record
- −$372 /mo · $4,469/yr
- Insurance
- −$106
- HOA
- −$0
- Vacancy / Maint / Mgmt
- −$494
- Net cashflow
- $42
Break-even live
Sensitivity live
| Price | -10% $187 | -5% $115 | +0% $42 | +5% $-30 | +10% $-102 |
|---|---|---|---|---|---|
| Rent | -10% $-143 | -5% $-51 | +0% $42 | +5% $135 | +10% $228 |
| Rate | -1.0pp $171 | -0.5pp $107 | base $42 | +0.5pp $-24 | +1.0pp $-91 |
UW: 25.0% down · 7.5% · 30yr · 1.5% tax · 5.0% vac · 8.0% maint · 8.0% mgmt
Financing live
Cash to close
- Down payment
- $63,750
- Closing costs
- $7,650
- Reserves months
- —
- Total cash needed
- —
Loan-product check · same deal, 3 products live
Conventional
25% down · 7.5% · 30yr
- Down + closing
- —
- Monthly P&I
- —
- Monthly cashflow
- —
- DSCR
- —
- Eligible?
- —
Personal DTI + credit; lowest rate.
DSCR
20% down · 8.5% · 30yr
- Down + closing
- —
- Monthly P&I
- —
- Monthly cashflow
- —
- DSCR
- —
- Eligible?
- —
No personal income docs; deal must DSCR.
Hard money
10% down · 12.0% · 12mo
- Down + closing
- —
- Monthly P&I
- —
- Monthly cashflow
- —
- DSCR
- —
- Eligible?
- —
Short-term bridge; refi at stabilization.
Rent comps 3 comps
| Address | Beds | Baths | Sqft | Rent | $/sqft | DOM | Units | Dist |
|---|---|---|---|---|---|---|---|---|
| 3019 Tackle Dr Leesburg, FL | 4.0 | 2.5 | 2405 | $2,600 | $1.08 | 25d | 1 | 1.01mi |
| 415 S 9th St Leesburg, FL | 3.0 | 2.5 | 1757 | $2,400 | $1.37 | 25d | 1 | 1.20mi |
| 2127 Aitkin Loop Leesburg, FL | 3.0 | 2.0 | 1667 | $1,865 | $1.12 | 25d | 1 | 1.22mi |
Listing history 47 events
-
2026-06-21days on market $255,000 Active 188 DOM
-
2026-06-18price $255,000 Active 185 DOM
-
2026-06-18days on market $258,000 Active 185 DOM
-
2026-06-17days on market $258,000 Active 184 DOM
-
2026-06-16days on market $258,000 Active 183 DOM
-
2026-06-15days on market $258,000 Active 182 DOM
-
2026-06-13days on market $258,000 Active 180 DOM
-
2026-06-09days on market $258,000 Active 176 DOM
-
2026-06-08days on market $258,000 Active 175 DOM
-
2026-06-07days on market $258,000 Active 174 DOM
-
2026-06-04days on market $258,000 Active 171 DOM
-
2026-06-03days on market $258,000 Active 170 DOM
-
2026-06-02days on market $258,000 Active 169 DOM
-
2026-06-02days on market $258,000 Active 168 DOM
-
2026-05-31days on market $258,000 Active 167 DOM
-
2026-05-22price $258,000
-
2026-04-24price $261,000
-
2026-03-20price $266,000
-
2026-02-27price $274,000
-
2026-01-30price $282,000
-
2026-01-09price $291,000
-
2025-12-15$300,000 Active
-
2025-09-22historical $2,305
-
2025-09-20price $2,305
-
2025-09-18$2,390
-
2021-04-30historical 208-char remark
Show marketing remark (208 chars)
GREAT FAMILY HOME IN DESIREABLE LEESBURG LOCATION. ALL NEW WOOD FLOORING, NEW FIXTURES, INGROUND SWIMMING POOL, FIREPLACE IN GREAT ROOM, MANY IMPROVEMENTS MADE TO THIS HOME, COME AND SEE! EASY ACCESS-VACANT!
-
2018-06-19soldstatus $464,412
-
2015-01-12status Pending
-
2015-01-11historical
-
2014-12-10status Active
-
2014-12-09status Pending
-
2014-11-13status Active
-
2014-10-28historical
-
2014-06-14status Active
-
2014-06-10historical
-
2013-11-19$115,000 Active
-
2010-10-07$79,900
-
2010-10-05historical
-
2010-04-27$99,900
-
2007-04-20$249,000 208-char remark
Show marketing remark (208 chars)
GREAT FAMILY HOME IN DESIREABLE LEESBURG LOCATION. ALL NEW WOOD FLOORING, NEW FIXTURES, INGROUND SWIMMING POOL, FIREPLACE IN GREAT ROOM, MANY IMPROVEMENTS MADE TO THIS HOME, COME AND SEE! EASY ACCESS-VACANT!
-
2006-12-20historical
-
2006-08-15$279,900
-
2006-07-11soldstatus $181,000
-
2006-06-30soldstatus $181,000
-
2006-03-14$199,900
-
2000-11-02soldstatus $119,000
-
1981-06-01soldstatus $62,000
ⓘ Source: listings_history table (triggers on properties + properties_extension) + one-shot
backfill from property_details.listing_events for pre-trigger history.
Tax reassessment forecast FL · Resets to sale price
- Current annual tax
- $4,469 · $372/mo
- Projected year-2 tax
- $4,469 · $372/mo
- Expected delta
- $0/yr ($0/mo · 0.0%)
ⓘ Screening estimate from a state-policy table — verify with the county assessor before closing.
Climate risk First Street
- Flood 1/10 Low FEMA zone X (unshaded) · 0% chance over 30 yrs
- Wildfire 2/10 Low
- Heat 8/10 Severe 7 d/yr ≥107°F today · 22 d/yr by 30 yrs out
- Wind 9/10 Extreme 99% chance of damaging wind over 30 yrs
- Air quality 2/10 Low 1 unhealthy d/yr today · 1 by 30 yrs out
Nearby sold comps map
Loading sold comps map…
Walkable amenities ~0.75 mi
Loading nearby amenities…
Taxation est. · year 1
- Rental income
- $28,227
- − Mortgage interest
- −$14,284
- − Property taxes
- −$4,469
- − Insurance
- −$1,275
- − Repairs & maintenance
- −$2,258
- − Management
- −$2,258
- − Depreciation
- −$7,418
- Taxable loss
- −$3,735
- Est. tax savings @ 24.0%
- +$896
- After-tax cash flow
- $1,405/yr
For passive investors: Depreciation is non-cash, so a rental often shows a tax loss while cash-flowing — sheltering income. Rental losses are passive: they offset passive income freely, and up to $25,000/yr can offset ordinary (W-2) income if you actively participate and your MAGI is under $100k (phasing out to $0 by $150k); unused losses carry forward. On sale, claimed depreciation is recaptured at up to 25%, and gains may owe capital-gains tax (a 1031 exchange can defer both). Figures are a year-1 estimate at your 24.0% rate — not tax advice; consult a CPA.
Schools (NCES district)
- District
- Lake
- NCES district ID
- 1201050
- Math proficiency
- 49% ▼ -7.00%
- Reading proficiency
- 50% ▼ -4.00%
- Median HH income
- $46,632
- Composite
- 42.05/100
- National rank
- #3327
- State rank
- #37 of 73 in FL
Livability — Leesburg
- Score
- 62/100
- State rank
- #751
- US rank
- #16429
Category grades
Schools grade is shown separately in the Schools card above.
Census & demographics
- Census place
- Leesburg, FL
- County
- Lake County · 364,602 people
- City population
- 70,232
- Metro
- Orlando-Kissimmee-Sanford, FL
- Population (ZIP)
- 48,095
- Household income
- $58,192
- Rent vs Own
- Severe rent burden
- 1745.0
Population outlook (Lake County) Hauer SSP2
- Today (2025)
- 386,640 people
- By 2030
- 417,107 · +7.9%
- By 2040
- 476,676 · +23.3%
- By 2050
- 531,296 · +37.4%
- By 2075
- 648,303 · +67.7%
- By 2100
- 698,530 · +80.7%
Race, ethnicity, and origin ACS 2023
- Neighborhood character
- Majority White (64%)
- Race & ethnicity
- White 64% Black 16% Hispanic / Latino 15% Two or more races 9% Asian 1%
- Hispanic origin (detail)
- Mexican 4% Puerto Rican 5% Cuban 3%
- Common ancestry
- Romanian 3% Lithuanian 3% Slovak 2%
- Foreign-born
- 9% · Canada, Vietnam, Jamaica
- Languages at home
- 88% English-only · Spanish 10% French/Haitian/Cajun 1%
Political lean MEDSL · Lake
- 2024 margin
- Strong R (+24.7) · D 37.3% · R 62.0%
- 2008→2024 swing
- -11.2pp toward R · 2008: -13.5pp · 2024: -24.7pp
- All cycles
- 2024: R+24.7 2020: R+20.0 2016: R+23.1 2012: R+17.1 2008: R+13.5
Not yet ingested
- Civics
- —
Market trends
- HPI YoY
- ▼ -88.97%
- Current HPI
- 262.1766
- Rent YoY
- ▼ -0.95%
- Metro
- Orlando-Kissimmee-Sanford, FL
- State GDP YoY
- ▲ 3.28%
- F500 in state
- 36
Industry mix (Fortune 500 HQ in FL)
| Industry | F500 HQs | Revenue |
|---|---|---|
| Industrial Technology | 2 | $29B |
|
||
| Insurance | 2 | $17B |
|
||
| Retail | 1 | $60B |
|
||
| Technology Distribution | 1 | $58B |
|
||
| Homebuilding | 1 | $35B |
|
||
| Technology Manufacturing | 1 | $35B |
|
||
Price history
+316.1% since first listed32 events — show timeline
- 2026-05-22 Price Changed $258,000 Stellar MLS as Distributed by MLS Grid
- 2026-04-24 Price Changed $261,000 Stellar MLS as Distributed by MLS Grid
- 2026-03-20 Price Changed $266,000 Stellar MLS as Distributed by MLS Grid
- 2026-02-27 Price Changed $274,000 Stellar MLS as Distributed by MLS Grid
- 2026-01-30 Price Changed $282,000 Stellar MLS as Distributed by MLS Grid
- 2026-01-09 Price Changed $291,000 Stellar MLS as Distributed by MLS Grid
- 2025-12-15 Listed $300,000 Stellar MLS as Distributed by MLS Grid
- 2025-09-22 Rental Removed $2,305 RENTLY
- 2025-09-20 Price Changed $2,305 RENTLY
- 2025-09-18 Listed for Rent $2,390 RENTLY
- 2021-04-30 Listing Removed — Stellar MLS as Distributed by MLS Grid
- 2018-06-19 Sold (Public Records) $464,412 Public Records
- 2015-01-12 Pending — Stellar MLS as Distributed by MLS Grid
- 2015-01-11 Listing Removed — Stellar MLS as Distributed by MLS Grid
- 2014-12-10 Relisted — Stellar MLS as Distributed by MLS Grid
- 2014-12-09 Pending — Stellar MLS as Distributed by MLS Grid
- 2014-11-13 Relisted — Stellar MLS as Distributed by MLS Grid
- 2014-10-28 Listing Removed — Stellar MLS as Distributed by MLS Grid
- 2014-06-14 Relisted — Stellar MLS as Distributed by MLS Grid
- 2014-06-10 Listing Removed — Stellar MLS as Distributed by MLS Grid
- 2013-11-19 Listed $115,000 Stellar MLS as Distributed by MLS Grid
- 2010-10-07 Listed $79,900 Stellar MLS as Distributed by MLS Grid
- 2010-10-05 Listing Removed — Stellar MLS as Distributed by MLS Grid
- 2010-04-27 Listed $99,900 Stellar MLS as Distributed by MLS Grid
- 2007-04-20 Listed $249,000 Stellar MLS as Distributed by MLS Grid
- 2006-12-20 Listing Removed — Stellar MLS as Distributed by MLS Grid
- 2006-08-15 Listed $279,900 Stellar MLS as Distributed by MLS Grid
- 2006-07-11 Sold (Public Records) $181,000 Public Records
- 2006-06-30 Sold (MLS) $181,000 Stellar MLS as Distributed by MLS Grid
- 2006-03-14 Listed $199,900 Stellar MLS as Distributed by MLS Grid
- 2000-11-02 Sold (Public Records) $119,000 Public Records
- 1981-06-01 Sold (Public Records) $62,000 Public Records
Property tax history
+6.1%/yrLatest (2025): $4,469 · -0.1% YoY. Source: county tax records.
Cash-flow waterfall
monthlySold comps — $/sqft
last 12 mo · ≤1 miLoading sold comps…