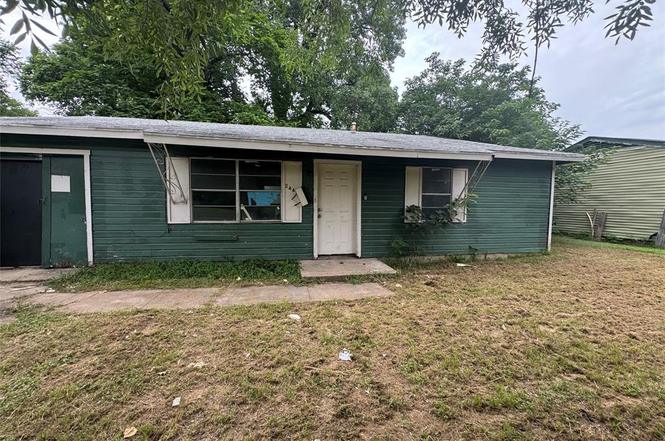
2447 E Pentagon Pkwy · Dallas, TX
Flood risk 1/10 · Minimal
- FEMA flood zone
- X (unshaded)
- Chance of flooding over 30 yrs
- 0.0%
- Est. flood insurance / yr
- $507 – $1,088
Fire risk 3/10 · Minor
- Est. fire insurance / yr
- $1,222 – $2,270
Heat risk 7/10 · Major
- Hot days now (above 110°F)
- 7 days/yr
- Hot days in 30 yrs
- 24 days/yr
Wind risk 6/10 · Moderate
- Chance of severe wind over 30 yrs
- 27.0%
Air-quality risk 2/10 · Minimal
- Unhealthy air days now
- 1 days/yr
- Unhealthy air days in 30 yrs
- 2 days/yr
Risk factors via First Street. Map © Google.
Why this score? — see what drove the B- grade
The composite is a weighted blend of 9 inputs, each scored 0–100. Each bar is that input's sub-score; the figure is the points it added to the 100-point composite (weight × sub-score).
- Cash flow +25.7/30.0
- ARV discount +15.0/15.0
- DSCR +8.6/10.0
- 1% rule +8.1/10.0
- Livability +4.0/5.0
- Schools +2.8/10.0
- Condition / age +2.5/5.0
- Rent growth +1.8/5.0
- Appreciation +0.0/10.0
$110,000
🖨 Deal sheet 📄 Offer letter ✓ Due diligence
Listing remarks
Opportunity is knocking! ALL YOU NEED IS LOVE AND MONEY! This charming fixer-upper is ready for someone with vision, creativity, and elbow grease. While it needs a full renovation, the potential is undeniable. Imagine transforming this diamond in the rough into the home you've always wanted. Enjoy a peaceful setting with no homes directly across the street—just beautiful green space, plus easy access to Five Mile Parkway Trail, Arden Terrace Park, and nearby ball fields. Whether you're an investor, flipper, or buyer looking to create your dream home, this property offers endless possibilities. Cash buyers only. Property is being sold strictly AS IS. No blind offers will be considered.
Key facts
- Full renovation
- Peaceful setting
- Nearby ball fields
Tags
Property features AI
Finance
- Other: County: Dallas; Country: United States; High geocode confidence
- Financial info: Listing terms: Cash; Loan treated as clear; No second mortgage indicated
- HOA & community: No association
Exterior
- Parking: Covered parking (1 space); Attached garage (1-car)
- Utilities: City water; City sewer; Not in a municipal utility district
- Home design: Single family residence; Attached property; Built in 1959
- Construction: Year built: 1959
- Exterior features: Lot under 0.5 acre (approximately 0.153 acres); Subdivision: Arden Terrace Rev
Interior
- Kitchen: No appliances included
- Bedrooms: 3 bedrooms (primary bedroom on the main level)
- Bathrooms: 1 full bathroom
- Interior features: One level layout; One living area; One dining area; Other interior features
- Laundry & utility: No specific laundry or utility appliances listed
Neighborhood map
What this means for you Summary
Snapshot
- This is a 2-bed/1.0-bath single-family listed at $110k.
Deal economics
- At list price, monthly cash flow is $265 ($3k/yr) — positive.
- The deal already cash-flows at list — no discount required.
- Meets the 1% rule at list price ($1k rent vs $110k).
- Cap rate 9.2% vs local median 2.3% in Dallas — top-decile yield for the area; either an underpriced asset or a hidden risk that comps aren't pricing in. Stress-test before assuming the spread holds.
Location & tenants
- Location reads 81/100 on livability (#24 in TX, #1,380 nationally) — a professional / high-income tenant draw. Strengths: amenities A+, commute A+, housing A+; Watch: crime F.
- Dallas ISD (urban): math 31% / reading 36% proficiency, ranked #559 of 826 in TX (top 68%) — families likely to look elsewhere, expect single-tenant / working-renter base with shorter leases; 83% free/reduced lunch — lower-income household profile, screen leases tightly.
- Zoned schools: Whitney M Young Jr El (math 12% / reading 12%, grade F, #4,207 of 4,322 statewide, top 98%, 313 students, 91% FRL).
- Zoned-school proficiency averages 12% at this address vs 34% district-wide (-22 pts) — the specific schools serving this property underperform the Dallas ISD average; the district grade overstates school quality for this exact location.
- Market conditions: Rents soft (-2.8%/yr); 207 active listings in the ZIP; 21 comparable units currently listed for rent nearby; rentals leasing fast (median 8d on market — plan ~1-2 weeks tenant-placement turnaround); 12,577 units permitted in Dallas County in 2024 (6,829 in 5+ unit buildings).
- This rent runs 32% of the median local income ($54k/yr) — at the standard rent-burdened threshold; future hikes will face affordability resistance.
Forward outlook
- Local home prices are declining (-3.0%/yr); year-one equity from $761 of loan paydown is wiped out by about $3k of value loss. Plan a longer hold.
- Dallas County population projected at +35% by 2050 — long-run rental-demand tailwind backs the buy-and-hold thesis.
Negotiation context
- Only 2 days on market — expect competitive offers; lowballing is unlikely to land.
Risks & watch-outs
- Watch-outs: property tax is 2.8% of price; built in 1959 — expect roof / HVAC / electrical / plumbing capex.
- Climate carrying-cost: major wind risk, 27% chance of damaging wind over 30y; extreme-heat days projected 7→24/yr by 2055 (HVAC capex compounding) — expect insurance premiums to compound above CPI over the hold.
Questions for the listing agent
- Built in 1959 — when were the roof, HVAC, electrical panel, plumbing, and water heater last replaced?
- Property tax is high relative to price — has the assessment been appealed recently, and will the sale trigger a re-assessment?
- Is there a deadline driving the sale (1031 exchange, divorce, estate, relocation)? That informs how much negotiation room exists.
- Crime grade is F in this area — have there been break-ins, vandalism, or insurance claims at this property in the last 3 years? What carrier currently insures it and at what premium?
- What's the average days-on-market for RENTAL listings here right now (not sales)? A rising rental-DOM trend means longer vacancies and softer asking-rent achievability than the comps imply.
- What's the recent tenant-quality profile in this submarket — average credit score on applications, eviction rate, late-payment / NSF rate, and stable-employment percentage? A property-management company in the area should have these aggregated.
- How much new for-sale + rental construction is in the pipeline within 1–3 miles? Heavy new supply typically softens prices + rents 12–24 months out; constrained supply supports both.
Investment metrics
- 1% rule
- 1.31% ✓
- Cap rate
- 9.18%
- Cash-on-cash
- 10.32%
- DSCR
- 1.46
- GRM
- 6.3
CMA / ARV
- ARV (on-the-fly)
- $140,070
- Comps found
- 3
Show comp detail 3 sales within ~0.75 mi
| Address | Dist | Beds/Ba | Sqft | Sold | Price | $/sf | Match |
|---|---|---|---|---|---|---|---|
| 2353 Talco Dr | 0.16mi | 2/1.0 | 924 (-4%) | 11mo | $125,000 | $135 | 76 |
| 5143 Watson Dr | 0.28mi | 2/1.0 | 864 (-11%) | 8mo | $125,000 | $145 | 62 |
| 5166 Lauderdale St | 0.39mi | 3/1.5 (+1) | 870 (-10%) | 5mo | $219,999 | $253 | 54 |
Match score weights: distance 35% · size 25% · config 20% · recency 20%. Top-matched comps best support the ARV.
Projected returns pro-forma
-3.0% appreciation · 0.0% rent growth · sell at horizon
- IRR
- -4.6%
- Equity multiple
- 0.83×
- Total profit
- $-5,093
- Equity at exit
- $16,401
- IRR
- 0.7%
- Equity multiple
- 1.04×
- Total profit
- $1,311
- Equity at exit
- $9,511
Cash invested: $30,800 (down + closing). Projections, not guarantees.
Landlord ↔ Tenant lean methodology
- Overall (STATE)
- 87 Strongly Landlord-Friendly
- State Texas
- 87 Strongly Landlord-Friendly · R+5
- County
- — inherits STATE
- City
- — inherits STATE
ZIP-level market 75241
- Home prices YoY
- -16.9%
- Rents YoY
- -2.8%
- Active inventory
- 207
- Price-to-rent
- 6.3×
Monthly cashflow live
- Estimated rent
- $1,444 high interval (Pro) →
- Mortgage (P&I)
- −$577
- Tax from tax record
- −$253 /mo · $3,038/yr
- Insurance
- −$46
- HOA
- −$0
- Vacancy / Maint / Mgmt
- −$303
- Net cashflow
- $265
Break-even live
UW: 25.0% down · 7.5% · 30yr · 1.5% tax · 5.0% vac · 8.0% maint · 8.0% mgmt
Financing live
Cash to close
- Down payment
- $27,500
- Closing costs
- $3,300
- Reserves months
- —
- Total cash needed
- —
Loan-product check · same deal, 3 products live
Conventional
25% down · 7.5% · 30yr
- Down + closing
- —
- Monthly P&I
- —
- Monthly cashflow
- —
- DSCR
- —
- Eligible?
- —
Personal DTI + credit; lowest rate.
DSCR
20% down · 8.5% · 30yr
- Down + closing
- —
- Monthly P&I
- —
- Monthly cashflow
- —
- DSCR
- —
- Eligible?
- —
No personal income docs; deal must DSCR.
Hard money
10% down · 12.0% · 12mo
- Down + closing
- —
- Monthly P&I
- —
- Monthly cashflow
- —
- DSCR
- —
- Eligible?
- —
Short-term bridge; refi at stabilization.
Rent comps 21 comps
| Address | Beds | Baths | Sqft | Rent | $/sqft | DOM | Units | Dist |
|---|---|---|---|---|---|---|---|---|
| 2751 E Ledbetter Dr Dallas, TX | 1.0–3.0 | 1.0–1.5 | 794 | $1,186 | $1.49 | 43d | 3 | 0.67mi |
| 5761 Highland Hills Dr Dallas, TX | 1.0–3.0 | 1.0–2.0 | 1040 | $1,508 | $1.45 | 3d | 7 | 0.82mi |
| 5821 Bonnie View Rd Dallas, TX | 1.0–3.0 | 1.0–2.0 | 820 | $963 | $1.17 | 7d | 7 | 0.90mi |
| 4934 Kildare Ave Dallas, TX | 3.0 | 2.0 | 1118 | $1,595 | $1.43 | 24d | 1 | 0.92mi |
| 5850 Highland Hills Dr Dallas, TX | 2.0–4.0 | 1.0–2.0 | 910 | $880 | $0.97 | 2d | 9 | 0.94mi |
| 3015 E Ledbetter Dr Dallas, TX | 2.0–3.0 | 2.0 | 1030 | $1,100 | $1.07 | 3d | 1 | 0.95mi |
| 4836 Sunnyvale St Dallas, TX | 1.0–3.0 | 1.0–2.0 | 515 | $1,330 | $2.58 | 43d | 7 | 0.95mi |
| 3131 Simpson Stuart Rd Dallas, TX | 1.0–3.0 | 1.0–2.0 | 1024 | $1,384 | $1.35 | 3d | 33 | 0.96mi |
| 2525 Lyola St Dallas, TX | 3.0 | 2.0 | 1080 | $1,895 | $1.75 | 43d | 1 | 0.98mi |
| 3035 E Ledbetter Dr Dallas, TX | 1.0–2.0 | 1.0 | 643 | $1,275 | $1.98 | 3d | 1 | 1.03mi |
| 3130 Stag Rd Dallas, TX | 1.0–3.0 | 1.0–2.0 | 831 | $1,318 | $1.59 | 43d | 3 | 1.04mi |
| 1754 E Red Bird Ln Dallas, TX | 3.0 | 1.5 | 1115 | $1,675 | $1.50 | 7d | 1 | 1.08mi |
| 3835 Basswood Dr Dallas, TX | 3.0 | 2.0 | 1000 | $1,625 | $1.62 | 24d | 1 | 1.10mi |
| 2111 Crouch Rd Dallas, TX | 1.0–2.0 | 1.0–2.0 | 866 | $1,277 | $1.47 | 6d | 1 | 1.10mi |
| 4417 S Lancaster Rd Dallas, TX | 2.0 | 1.0–2.0 | 874 | $1,595 | $1.82 | 2d | 1 | 1.22mi |
| 3440 Simpson Stuart Rd Dallas, TX | 1.0–3.0 | 1.0–2.0 | 942 | $1,788 | $1.90 | 1d | 9 | 1.23mi |
| 1435 Whispering Trl Dallas, TX | 3.0 | 1.0 | 1047 | $1,660 | $1.59 | 7d | 1 | 1.34mi |
| 3460 South Loop 12 Dallas, TX | 2.0 | 1.5 | 867 | $1,150 | $1.33 | 6d | 1 | 1.44mi |
| 3460 South Loop 12 Dallas, TX | 3.0 | 2.0 | 1048 | $1,350 | $1.29 | 24d | 1 | 1.44mi |
| 3460 South Loop 12 Dallas, TX | 1.0 | 1.0 | 650 | $999 | $1.54 | 18d | 1 | 1.44mi |
| 3460 South Loop 12 Dallas, TX | 1.0–2.0 | 1.0–1.5 | 758 | $1,150 | $1.52 | 12d | 2 | 1.44mi |
Listing history 3 events
-
2026-06-18days on market $110,000 Active 2 DOM
-
2026-06-17remarks 693-char remark
-
2026-06-17$110,000 Active 1 DOM
ⓘ Source: listings_history table (triggers on properties + properties_extension) + one-shot
backfill from property_details.listing_events for pre-trigger history.
Tax reassessment forecast TX · Resets to sale price
- Current annual tax
- $3,038 · $253/mo
- Projected year-2 tax
- $3,038 · $253/mo
- Expected delta
- $0/yr ($0/mo · 0.0%)
ⓘ Screening estimate from a state-policy table — verify with the county assessor before closing.
Climate risk First Street
- Flood 1/10 Low FEMA zone X (unshaded) · 0% chance over 30 yrs
- Wildfire 3/10 Moderate
- Heat 7/10 Severe 7 d/yr ≥110°F today · 24 d/yr by 30 yrs out
- Wind 6/10 Major 27% chance of damaging wind over 30 yrs
- Air quality 2/10 Low 1 unhealthy d/yr today · 2 by 30 yrs out
Nearby sold comps map
Loading sold comps map…
Walkable amenities ~0.75 mi
Loading nearby amenities…
Taxation est. · year 1
- Rental income
- $17,327
- − Mortgage interest
- −$6,162
- − Property taxes
- −$3,038
- − Insurance
- −$550
- − Repairs & maintenance
- −$1,386
- − Management
- −$1,386
- − Depreciation
- −$3,200
- Taxable income
- $1,605
- Est. tax owed @ 24.0%
- −$385
- After-tax cash flow
- $2,793/yr
For passive investors: Depreciation is non-cash, so a rental often shows a tax loss while cash-flowing — sheltering income. Rental losses are passive: they offset passive income freely, and up to $25,000/yr can offset ordinary (W-2) income if you actively participate and your MAGI is under $100k (phasing out to $0 by $150k); unused losses carry forward. On sale, claimed depreciation is recaptured at up to 25%, and gains may owe capital-gains tax (a 1031 exchange can defer both). Figures are a year-1 estimate at your 24.0% rate — not tax advice; consult a CPA.
Schools (NCES district)
- District
- Dallas ISD
- NCES district ID
- 4816230
- Math proficiency
- 31% ▼ -16.00%
- Reading proficiency
- 36% ▼ -4.00%
- Median HH income
- $42,881
- Composite
- 28.41/100
- National rank
- #6763
- State rank
- #559 of 826 in TX
Livability — Dallas
- Score
- 81/100
- State rank
- #24
- US rank
- #1380
Category grades
Schools grade is shown separately in the Schools card above.
Census & demographics
- Census place
- Dallas, TX
- County
- Dallas County · 2,612,404 people
- City population
- 1,168,437
- Metro
- Dallas-Fort Worth-Arlington, TX
- Population (ZIP)
- 33,840
- Household income
- $53,998
- Rent vs Own
- Severe rent burden
- 1076.0
Population outlook (Dallas County) Hauer SSP2
- Today (2025)
- 2,979,839 people
- By 2030
- 3,191,823 · +7.1%
- By 2040
- 3,619,611 · +21.5%
- By 2050
- 4,026,915 · +35.1%
- By 2075
- 4,957,073 · +66.4%
- By 2100
- 5,508,725 · +84.9%
Race, ethnicity, and origin ACS 2023
- Neighborhood character
- Majority Black (62%)
- Race & ethnicity
- Black 62% Hispanic / Latino 30% Two or more races 8% White 5% Native American 2%
- Hispanic origin (detail)
- Mexican 24%
- Foreign-born
- 13% · Canada
- Languages at home
- 73% English-only · Spanish 25%
Political lean MEDSL · Dallas
- 2024 margin
- Strong D (+22.2) · D 60.2% · R 38.0% · Other 1.8%
- 2008→2024 swing
- +6.9pp toward D · 2008: 15.3pp · 2024: 22.2pp
- All cycles
- 2024: D+22.2 2020: D+31.6 2016: D+26.2 2012: D+15.4 2008: D+15.3
Not yet ingested
- Civics
- —
Market trends
- HPI YoY
- ▼ -72.36%
- Current HPI
- 356.2348
- Rent YoY
- ▼ -2.75%
- Metro
- Dallas-Fort Worth-Arlington, TX
- State GDP YoY
- ▲ 3.95%
- F500 in state
- 110
Industry mix (Fortune 500 HQ in TX)
| Industry | F500 HQs | Revenue |
|---|---|---|
| Energy | 16 | $1,198B |
|
||
| Technology | 5 | $198B |
|
||
| Engineering / Construction | 4 | $72B |
|
||
| Energy Services | 3 | $60B |
|
||
| Utilities | 3 | $41B |
|
||
| Healthcare | 2 | $330B |
|
||
Price history
1 event — show timeline
- 2026-06-16 Listed $110,000 NTREIS
Property tax history
+9.5%/yrLatest (2025): $3,038 · -0.4% YoY. Source: county tax records.
Cash-flow waterfall
monthlySold comps — $/sqft
last 12 mo · ≤1 miLoading sold comps…