 Duplex
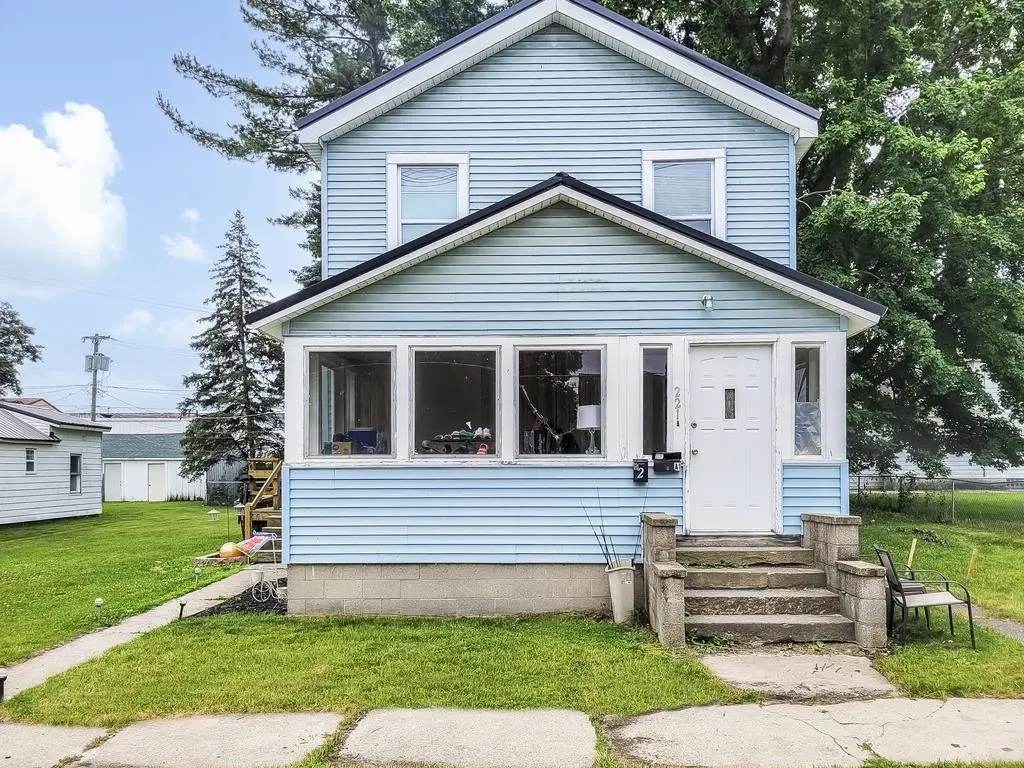
221 North St Lot : 2 · St. Louis, MI
Flood risk 1/10 · Minimal
- FEMA flood zone
- X (unshaded)
- Chance of flooding over 30 yrs
- 0.0%
- Est. flood insurance / yr
- $473 – $860
Fire risk 1/10 · Minimal
- Est. fire insurance / yr
- $784 – $1,456
Heat risk 2/10 · Minimal
- Hot days now (above 98°F)
- 7 days/yr
- Hot days in 30 yrs
- 14 days/yr
Wind risk 1/10 · Minimal
- Chance of severe wind over 30 yrs
- —
Air-quality risk 2/10 · Minimal
- Unhealthy air days now
- 1 days/yr
- Unhealthy air days in 30 yrs
- 2 days/yr
Risk factors via First Street. Map © Google.
Why this score? — see what drove the C+ grade
The composite is a weighted blend of 9 inputs, each scored 0–100. Each bar is that input's sub-score; the figure is the points it added to the 100-point composite (weight × sub-score).
- Cash flow +30.0/30.0
- 1% rule +10.0/10.0
- DSCR +10.0/10.0
- Condition / age +4.0/5.0
- Rent growth +2.5/5.0
- Livability +2.5/5.0
- Schools +2.3/10.0
- ARV discount +0.0/15.0
- Appreciation +0.0/10.0
$129,000
🖨 Deal sheet 📄 Offer letter ✓ Due diligence
Multi-family units
County records classify this as Multi-Family (2-4 Unit). Listing-text estimate: 2 units. confirmed
Listing remarks MLS
Back on the market due to buyer's inability to close! Great Cash-flowing Investment Opportunity in Downtown St. Louis! Check out this fully remodeled up/down duplex in the heart of downtown St. Louis! This well-maintained property features two spacious units, each with 1,100 square feet of living space. The bottom unit (month to month)offers 3 bedrooms and 1 bathroom and currently rents for $750/month. The top unit (lease until January) includes 4 bedrooms and 2 bathrooms, bringing in $850/month. Both tenants are on year-long leases and are current on rent. Both units were completely remodeled in 2022, so you’ll find updated finishes and systems throughout. This is a turnkey investment with steady cash flow from day one. Whether you're looking to add to your rental portfolio or start one, this property is a smart choice. Ask your agent about property management services, as they are an option for this property! Don't miss your chance to own a solid income-producing property in a great location!
Key facts
- Updated finishes
- Great location
- Turnkey investment
Tags
Neighborhood map
What this means for you Summary
Snapshot
- This is a 1×3bd/1ba + 1×4bd/2ba units multifamily listed at $129k. Condition is rated good.
Deal economics
- At list price, monthly cash flow is $643 ($8k/yr) — positive. Per door: $322/mo.
- The deal already cash-flows at list — no discount required.
- Meets the 1% rule at list price ($2k rent vs $129k).
- Recommended offer: $114k (12.0% below list) — sets the bar for market timing.
- Cap rate 12.3% vs local median 5.5% in St. Louis — top-decile yield for the area; either an underpriced asset or a hidden risk that comps aren't pricing in. Stress-test before assuming the spread holds.
Location & tenants
- Location reads: area grade C — affects rentability + tenant quality, not the cash-flow math above.
- St. Louis Public Schools (town): math 19% / reading 37% proficiency, ranked #397 of 540 in MI (top 74%) — low school quality limits family demand, transient renter base, plan for 1-2y turnover.
- Market conditions: 28 active listings in the ZIP; 47 units permitted in Gratiot County in 2024 (0 in 5+ unit buildings).
Forward outlook
- Local home prices are declining (-3.0%/yr); year-one equity from $892 of loan paydown is wiped out by about $4k of value loss. Plan a longer hold.
- Gratiot County population projected at -14% by 2050 — secular population decline; favor cash flow + early exit over multi-decade hold.
- At projected returns (-3.0% appreciation + 3.0% rent growth), your $36k cash investment doubles in ~6 years — after that, you're playing with house money.
Negotiation context
- It's been on market 354 days — a 12% lower offer ($114k) is reasonable based on typical stale-listing flexibility.
- 2 sale attempts with the ask held roughly flat each time — persistent listings suggest the price (not the market) is what's stuck; bring a comps-based counter.
Risks & watch-outs
- Watch-outs: built in 1910 — expect roof / HVAC / electrical / plumbing capex.
Questions for the listing agent
- It's been on market 354 days. Have you received any prior offers? Is the seller open to a 12% concession, seller financing, or rate buy-down credit?
- Can we see the unit-by-unit rent roll, current vacancy, and any below-market leases? What's the average tenancy length?
- What capital expenditures (roof, boiler, parking lot, exteriors) have been made in the last 5 years, and what's planned in the next 2?
- Built in 1910 — when were the roof, HVAC, electrical panel, plumbing, and water heater last replaced?
- Why hasn't it sold? Are there any deal-killer items the seller is aware of (foundation, flood, title, zoning, code violations)?
- Is there a deadline driving the sale (1031 exchange, divorce, estate, relocation)? That informs how much negotiation room exists.
- What's the average days-on-market for RENTAL listings here right now (not sales)? A rising rental-DOM trend means longer vacancies and softer asking-rent achievability than the comps imply.
- What's the recent tenant-quality profile in this submarket — average credit score on applications, eviction rate, late-payment / NSF rate, and stable-employment percentage? A property-management company in the area should have these aggregated.
- How much new apartment / multifamily construction is in the pipeline within 1–3 miles? Heavy new supply (>2% of stock underway) typically softens rents 12–24 months out; light construction supports rent growth.
Investment metrics
- 1% rule
- 1.51% ✓
- Cap rate
- 12.28%
- Cash-on-cash
- 21.38%
- DSCR
- 1.95
- GRM
- 5.5
CMA / ARV
- ARV (median comp)
- $103,762
- List price
- $129,000
- Delta
- 24.32%
- Verdict
- OVERPRICED
- Comps
- 3 within 1.0 mi
Show comp detail 1 sale within ~0.75 mi
| Address | Dist | Beds/Ba | Sqft | Sold | Price | $/sf | Match |
|---|---|---|---|---|---|---|---|
| 112 Pine | 0.31mi | —/— | 1,200 (+9%) | 22mo | $110,000 | $92 | 52 |
Match score weights: distance 35% · size 25% · config 20% · recency 20%. Top-matched comps best support the ARV.
Projected returns pro-forma
-3.0% appreciation · 3.0% rent growth · sell at horizon
- IRR
- 13.9%
- Equity multiple
- 1.56×
- Total profit
- $20,109
- Equity at exit
- $19,234
- IRR
- 22.7%
- Equity multiple
- 2.95×
- Total profit
- $70,403
- Equity at exit
- $11,154
Cash invested: $36,120 (down + closing). Projections, not guarantees.
Landlord ↔ Tenant lean methodology
- Overall (STATE)
- 62 Landlord-Friendly
- State Michigan
- 62 Landlord-Friendly · EVEN
- County
- — inherits STATE
- City
- — inherits STATE
ZIP-level market 48880
- Home prices YoY
- -28.5%
- Active inventory
- 28
- Price-to-rent
- 11.5×
Monthly cashflow live
- Estimated rent
- $1,943 medium interval (Pro) →
- Mortgage (P&I)
- −$676
- Tax est. 1.5%
- −$161 /mo · $1,935/yr
- Insurance
- −$54
- HOA
- −$0
- Vacancy / Maint / Mgmt
- −$408
- Net cashflow
- $643
Break-even live
2-unit breakdown (identical units grouped — click to expand)
| Units | Beds | Baths | Est. rent |
|---|---|---|---|
| 1× unit | 3 | 1 | $936 |
| 1× unit | 4 | 2 | $1,007 |
| Total (2 units) | $1,943 | ||
UW: 25.0% down · 7.5% · 30yr · 1.5% tax · 5.0% vac · 8.0% maint · 8.0% mgmt
Financing live
Cash to close
- Down payment
- $32,250
- Closing costs
- $3,870
- Reserves months
- —
- Total cash needed
- —
Loan-product check · same deal, 3 products live
Conventional
25% down · 7.5% · 30yr
- Down + closing
- —
- Monthly P&I
- —
- Monthly cashflow
- —
- DSCR
- —
- Eligible?
- —
Personal DTI + credit; lowest rate.
DSCR
20% down · 8.5% · 30yr
- Down + closing
- —
- Monthly P&I
- —
- Monthly cashflow
- —
- DSCR
- —
- Eligible?
- —
No personal income docs; deal must DSCR.
Hard money
10% down · 12.0% · 12mo
- Down + closing
- —
- Monthly P&I
- —
- Monthly cashflow
- —
- DSCR
- —
- Eligible?
- —
Short-term bridge; refi at stabilization.
Listing history 19 events
-
2026-06-19days on market $129,000 Active 354 DOM
-
2026-06-18days on market $129,000 Active 353 DOM
-
2026-06-17days on market $129,000 Active 352 DOM
-
2026-06-16days on market $129,000 Active 351 DOM
-
2026-06-15days on market $129,000 Active 350 DOM
-
2026-06-14days on market $129,000 Active 348 DOM
-
2026-06-13days on market $129,000 Active 347 DOM
-
2026-06-10days on market $129,000 Active 345 DOM
-
2026-06-09days on market $129,000 Active 344 DOM
-
2026-06-08days on market $129,000 Active 343 DOM
-
2026-06-07days on market $129,000 Active 342 DOM
-
2026-06-03days on market $129,000 Active 338 DOM
-
2026-06-02days on market $129,000 Active 337 DOM
-
2026-06-01days on market $129,000 Active 336 DOM
-
2026-05-31days on market $129,000 Active 335 DOM
-
2026-05-30days on market $129,000 Active 334 DOM
-
2025-12-04status Back on Market 1028-char remark
Show marketing remark (1028 chars)
Back on the market due to buyer's inability to close! Great Cash-flowing Investment Opportunity in Downtown St. Louis! Check out this fully remodeled up/down duplex in the heart of downtown St. Louis! This well-maintained property features two spacious units, each with 1,100 square feet of living space. The bottom unit (month to month)offers 3 bedrooms and 1 bathroom and currently rents for $750/month. The top unit (lease until January) includes 4 bedrooms and 2 bathrooms, bringing in $850/month. Both tenants are on year-long leases and are current on rent. Both units were completely remodeled in 2022, so you’ll find updated finishes and systems throughout. This is a turnkey investment with steady cash flow from day one. Whether you're looking to add to your rental portfolio or start one, this property is a smart choice. Ask your agent about property management services, as they are an option for this property! Don't miss your chance to own a solid income-producing property in a great location!
-
2025-10-13historical Keep Showing-Contgcy Appl 1028-char remark
Show marketing remark (1028 chars)
Back on the market due to buyer's inability to close! Great Cash-flowing Investment Opportunity in Downtown St. Louis! Check out this fully remodeled up/down duplex in the heart of downtown St. Louis! This well-maintained property features two spacious units, each with 1,100 square feet of living space. The bottom unit (month to month)offers 3 bedrooms and 1 bathroom and currently rents for $750/month. The top unit (lease until January) includes 4 bedrooms and 2 bathrooms, bringing in $850/month. Both tenants are on year-long leases and are current on rent. Both units were completely remodeled in 2022, so you’ll find updated finishes and systems throughout. This is a turnkey investment with steady cash flow from day one. Whether you're looking to add to your rental portfolio or start one, this property is a smart choice. Ask your agent about property management services, as they are an option for this property! Don't miss your chance to own a solid income-producing property in a great location!
-
2025-06-30$129,000 Active 1028-char remark
Show marketing remark (1028 chars)
Back on the market due to buyer's inability to close! Great Cash-flowing Investment Opportunity in Downtown St. Louis! Check out this fully remodeled up/down duplex in the heart of downtown St. Louis! This well-maintained property features two spacious units, each with 1,100 square feet of living space. The bottom unit (month to month)offers 3 bedrooms and 1 bathroom and currently rents for $750/month. The top unit (lease until January) includes 4 bedrooms and 2 bathrooms, bringing in $850/month. Both tenants are on year-long leases and are current on rent. Both units were completely remodeled in 2022, so you’ll find updated finishes and systems throughout. This is a turnkey investment with steady cash flow from day one. Whether you're looking to add to your rental portfolio or start one, this property is a smart choice. Ask your agent about property management services, as they are an option for this property! Don't miss your chance to own a solid income-producing property in a great location!
ⓘ Source: listings_history table (triggers on properties + properties_extension) + one-shot
backfill from property_details.listing_events for pre-trigger history.
Climate risk First Street
- Flood 1/10 Low FEMA zone X (unshaded) · 0% chance over 30 yrs
- Wildfire 1/10 Low
- Heat 2/10 Low 7 d/yr ≥98°F today · 14 d/yr by 30 yrs out
- Wind 1/10 Low
- Air quality 2/10 Low 1 unhealthy d/yr today · 2 by 30 yrs out
Nearby sold comps map
Loading sold comps map…
Walkable amenities ~0.75 mi
Loading nearby amenities…
Taxation est. · year 1
- Rental income
- $23,316
- − Mortgage interest
- −$7,226
- − Property taxes
- −$1,935
- − Insurance
- −$645
- − Repairs & maintenance
- −$1,865
- − Management
- −$1,865
- − Depreciation
- −$3,753
- Taxable income
- $6,027
- Est. tax owed @ 24.0%
- −$1,446
- After-tax cash flow
- $6,275/yr
For passive investors: Depreciation is non-cash, so a rental often shows a tax loss while cash-flowing — sheltering income. Rental losses are passive: they offset passive income freely, and up to $25,000/yr can offset ordinary (W-2) income if you actively participate and your MAGI is under $100k (phasing out to $0 by $150k); unused losses carry forward. On sale, claimed depreciation is recaptured at up to 25%, and gains may owe capital-gains tax (a 1031 exchange can defer both). Figures are a year-1 estimate at your 24.0% rate — not tax advice; consult a CPA.
Condition & rehab AI · 12 photos
This fully remodeled, two-unit duplex in St. Louis is in good condition with no major repairs needed. A fresh coat of paint and a deep clean would significantly enhance its curb appeal and rental value.
Value-add opportunities
- Both Paint exterior — Enhances curb appeal and resale value
- Both Deep clean carpets — Improves living conditions and rental appeal
Renovation cost estimate screening
Value-add ROI direction
- Both Paint exterior — Enhances curb appeal and resale value ↑
- Both Deep clean carpets — Improves living conditions and rental appeal ↑
ⓘ Cost ranges are severity-bucket heuristics (US national rule-of-thumb). Get contractor quotes + a written scope before underwriting a rehab budget.
Schools (NCES district)
- District
- St. Louis Public Schools
- NCES district ID
- 2632880
- Math proficiency
- 19% ▼ -4.00%
- Reading proficiency
- 37% ▼ -7.00%
- Median HH income
- $38,717
- Composite
- 23.4/100
- National rank
- #7899
- State rank
- #397 of 540 in MI
Livability — St. Louis
No livability data for this city. (Only ~50 U.S. cities are tracked.)
Census & demographics
- Census place
- St. Louis, MI
- Population (ZIP)
- 9,952
Population outlook (Gratiot County) Hauer SSP2
- Today (2025)
- 39,991 people
- By 2030
- 38,944 · -2.6%
- By 2040
- 36,694 · -8.2%
- By 2050
- 34,314 · -14.2%
- By 2075
- 27,693 · -30.8%
- By 2100
- 20,809 · -48.0%
Race, ethnicity, and origin ACS 2023
- Neighborhood character
- Predominantly White (67%)
- Race & ethnicity
- White 67% Black 19% Hispanic / Latino 9% Two or more races 7%
- Hispanic origin (detail)
- Mexican 6% Puerto Rican 1%
- Common ancestry
- Romanian 2% Slovak 2% Italian 2%
- Foreign-born
- 2% · Canada
- Languages at home
- 94% English-only · Spanish 5%
Political lean MEDSL · Gratiot
- 2024 margin
- Solid R (+31.3) · D 33.7% · R 65.0% · Other 1.4%
- 2008→2024 swing
- -35.7pp toward R · 2008: 4.4pp · 2024: -31.3pp
- All cycles
- 2024: R+31.3 2020: R+28.3 2016: R+25.6 2012: R+3.9 2008: D+4.4
Not yet ingested
- Civics
- —
Market trends
- HPI YoY
- ▼ -82.19%
- Current HPI
- 206.4534
- Rent YoY
- —
- Metro
- —
- State GDP YoY
- ▲ 1.37%
- F500 in state
- 28
Industry mix (Fortune 500 HQ in MI)
| Industry | F500 HQs | Revenue |
|---|---|---|
| Automotive Parts | 3 | $48B |
|
||
| Automotive | 2 | $372B |
|
||
| Chemicals | 1 | $45B |
|
||
| Automotive Retail | 1 | $29B |
|
||
| Healthcare / Medical Devices | 1 | $23B |
|
||
| Automotive Technology | 1 | $20B |
|
||
Price history
3 events — show timeline
- 2025-12-04 Relisted — MiRealSource-MiMLS
- 2025-10-13 Contingent — MiRealSource-MiMLS
- 2025-06-30 Listed $129,000 MiRealSource-MiMLS
Cash-flow waterfall
monthlySold comps — $/sqft
last 12 mo · ≤1 miLoading sold comps…