12551 Hammill Path Dr Dr · Houston, TX
Flood risk 6/10 · Moderate
- FEMA flood zone
- X (unshaded)
- Chance of flooding over 30 yrs
- 0.71%
- Est. flood insurance / yr
- $507 – $1,088
Fire risk 1/10 · Minimal
- Est. fire insurance / yr
- $1,222 – $2,270
Heat risk 9/10 · Severe
- Hot days now (above 110°F)
- 7 days/yr
- Hot days in 30 yrs
- 24 days/yr
Wind risk 8/10 · Major
- Chance of severe wind over 30 yrs
- 99.0%
Air-quality risk 3/10 · Minor
- Unhealthy air days now
- 3 days/yr
- Unhealthy air days in 30 yrs
- 3 days/yr
Risk factors via First Street. Map © Google.
Why this score? — see what drove the D grade
The composite is a weighted blend of 9 inputs, each scored 0–100. Each bar is that input's sub-score; the figure is the points it added to the 100-point composite (weight × sub-score).
- ARV discount +12.3/15.0
- Cash flow +8.0/30.0
- Appreciation +4.5/10.0
- Schools +4.1/10.0
- Livability +3.7/5.0
- 1% rule +3.0/10.0
- Condition / age +2.5/5.0
- DSCR +2.0/10.0
- Rent growth +1.3/5.0
$187,000
🖨 Deal sheet (PDF) 📄 Offer letter ✓ Due diligence
Key facts
- 3,598 sq ft lot
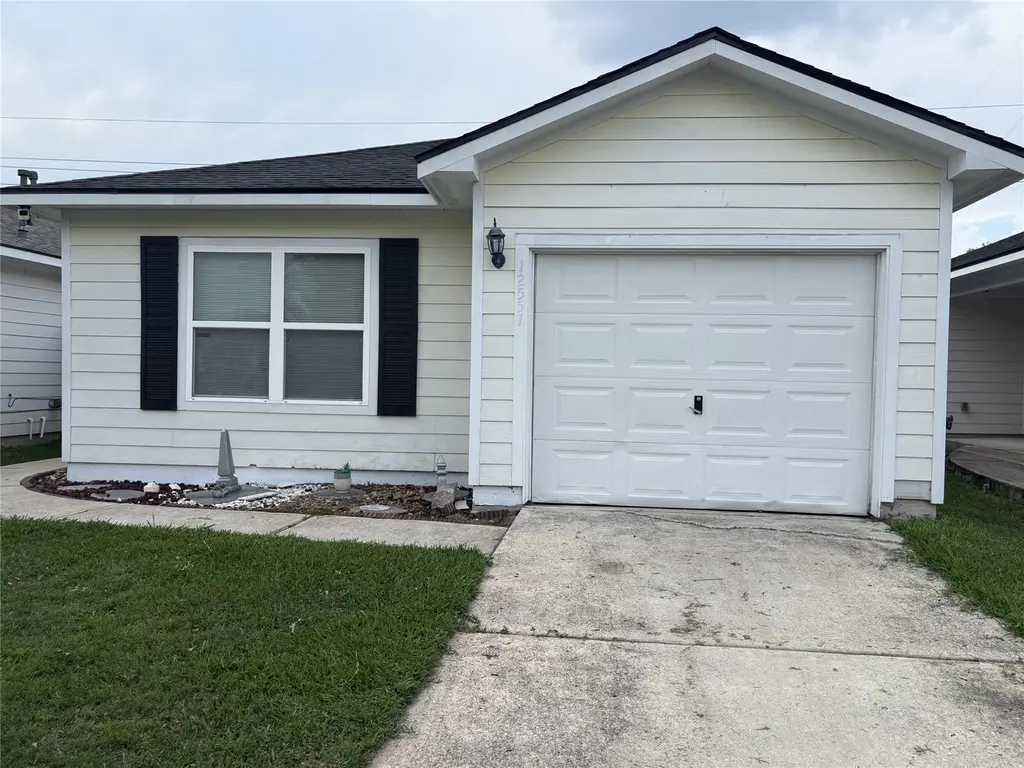
- Garage
- Built 2015
Property features AI
Finance
- Other: Municipal Utility District disclosure; Seller disclosure
- Financial info: Lease not considered
- HOA & community: Hamill Crossing HOA
Exterior
- Parking: Attached garage (1 space)
- Utilities: Public water; Public sewer
- Home design: Residential property; Entry on slab foundation
- Construction: Built in 2015; Cement siding; Composition roof; Slab foundation
- Exterior features: Cul-de-sac lot; Concrete road surface
Interior
- Kitchen: Disposal
- Bedrooms: 3 total rooms
- Bathrooms: 2 full bathrooms
- Heating & cooling: Central heating (electric); Central air conditioning; Gas cooling
- Interior features: Gas fireplace (1); Disposal
Neighborhood map
What this means for you Summary
Snapshot
- This is a 3-bed/2.0-bath single-family listed at $187k.
Deal economics
- At list price, monthly cash flow is $-194 ($-2k/yr) — negative.
- To cash-flow at today's rent, offer at most $153k (18.3% below list).
- To meet the 1% rule (rent ≥ 1% of price), the offer needs to be $150k (19.6% below list).
- Recommended offer: $150k (19.6% below list) — sets the bar for 1% rule.
- Cap rate 5.0% vs local median 3.2% in Houston — top-decile yield for the area; either an underpriced asset or a hidden risk that comps aren't pricing in. Stress-test before assuming the spread holds.
Location & tenants
- Location reads 74/100 on livability (#184 in TX, #4,771 nationally) — a middle-class / working-renter tenant base. Strengths: amenities A+, cost of living A+, housing A+; Watch: crime F.
- Klein ISD (suburban): math 41% / reading 48% proficiency, ranked #213 of 826 in TX (top 26%) — families likely to look elsewhere, expect single-tenant / working-renter base with shorter leases.
- Zoned schools: Greenwood Forest El (math 30% / reading 34%, grade F, #2,268 of 4,322 statewide, top 55%, 672 students, 75% FRL); Wunderlich Int (math 24% / reading 34%, grade F, #1,103 of 1,662 statewide, top 67%, 1,316 students, 77% FRL); Klein H S (math 58% / reading 67%, grade B-, #234 of 1,632 statewide, top 14%, 3,352 students, 45% FRL) — zoned schools average 66% FRL vs 37% district-wide (28 pts higher); higher-poverty schools than district average — tighter screening recommended.
- Market conditions: Rents falling (-4.7%/yr); 164 active listings in the ZIP; 27 comparable units currently listed for rent nearby; rentals leasing fast (median 10d on market — plan ~1-2 weeks tenant-placement turnaround); solid renter incomes; 29,883 units permitted in Harris County in 2024 (8,621 in 5+ unit buildings).
Forward outlook
- Local home prices are declining (-1.0%/yr); year-one equity from $1k of loan paydown is wiped out by about $2k of value loss. Plan a longer hold.
- Harris County population projected at +47% by 2050 — long-run rental-demand tailwind backs the buy-and-hold thesis.
Negotiation context
- It's been on market 39 days — a 3% lower offer ($181k) is reasonable based on typical stale-listing flexibility.
- 2 sale attempts with the ask held roughly flat each time — persistent listings suggest the price (not the market) is what's stuck; bring a comps-based counter.
Risks & watch-outs
- Climate carrying-cost: major flood risk; severe wind risk, 99% chance of damaging wind over 30y; extreme-heat days projected 7→24/yr by 2055 (HVAC capex compounding) — expect insurance premiums to compound above CPI over the hold.
Questions for the listing agent
- What do current leases actually rent for vs. the listed asking? Can we see a recent rent roll and the last 12 months of T-12 income?
- It's been on market 39 days. Have you received any prior offers? Is the seller open to a 20% concession, seller financing, or rate buy-down credit?
- Is there a deadline driving the sale (1031 exchange, divorce, estate, relocation)? That informs how much negotiation room exists.
- Schools are D-rated, which usually means shorter tenancies and higher turnover. Who's the typical renter profile here, and what's been the actual vacancy rate?
- Crime grade is F in this area — have there been break-ins, vandalism, or insurance claims at this property in the last 3 years? What carrier currently insures it and at what premium?
- The area grade is low — what's the realistic commute time and amenity access for the typical tenant pool here? Any planned neighborhood developments (good or bad) we should know about?
- What's the average days-on-market for RENTAL listings here right now (not sales)? A rising rental-DOM trend means longer vacancies and softer asking-rent achievability than the comps imply.
- What's the recent tenant-quality profile in this submarket — average credit score on applications, eviction rate, late-payment / NSF rate, and stable-employment percentage? A property-management company in the area should have these aggregated.
- How much new for-sale + rental construction is in the pipeline within 1–3 miles? Heavy new supply typically softens prices + rents 12–24 months out; constrained supply supports both.
Investment metrics
- 1% rule
- 0.80% ✗
- Cap rate
- 5.05%
- Cash-on-cash
- -4.45%
- DSCR
- 0.80
- GRM
- 10.4
CMA / ARV
- ARV (median comp)
- $209,233
- List price
- $187,000
- Delta
- -10.63%
- Verdict
- UNDERPRICED
- Comps
- 20 within 1.0 mi
Show comp detail 6 sales within ~0.75 mi
| Address | Dist | Beds/Ba | Sqft | Sold | Price | $/sf | Match |
|---|---|---|---|---|---|---|---|
| 5527 Hamill Ranch Ln | 0.25mi | 3/2.0 | 1,154 (-0%) | 8mo | $200,000 | $173 | 81 |
| 5050 Kleinway Dr | 0.50mi | 3/2.0 | 1,192 (+3%) | 14mo | $225,000 | $189 | 60 |
| 13151 Gatton Park Dr | 0.52mi | 3/2.0 | 1,199 (+3%) | 15mo | $199,900 | $167 | 58 |
| 5418 Forest Bridge Way | 0.59mi | 3/2.0 | 1,257 (+8%) | 2mo | $215,000 | $171 | 57 |
| 11411 Amber Valley Ct | 0.69mi | 3/2.0 | 1,306 (+13%) | 9mo | $230,000 | $176 | 39 |
| 12506 Jacobs Trce | 0.64mi | 3/2.0 | 1,321 (+14%) | 17mo | $213,000 | $161 | 33 |
Match score weights: distance 35% · size 25% · config 20% · recency 20%. Top-matched comps best support the ARV.
Projected returns pro-forma
-1.02% appreciation · 0.0% rent growth · sell at horizon
- IRR
- -14.1%
- Equity multiple
- 0.41×
- Total profit
- $-30,946
- Equity at exit
- $44,949
- IRR
- -10.4%
- Equity multiple
- 0.15×
- Total profit
- $-44,527
- Equity at exit
- $47,038
Cash invested: $52,360 (down + closing). Projections, not guarantees.
Landlord ↔ Tenant lean methodology
- Overall (STATE)
- 87 Strongly Landlord-Friendly
- State Texas
- 87 Strongly Landlord-Friendly · R+5
- County
- — inherits STATE
- City
- — inherits STATE
ZIP-level market 77066
- Home prices YoY
- -0.4%
- Rents YoY
- -4.7%
- Active inventory
- 164
- Price-to-rent
- 10.4×
Monthly cashflow live
- Estimated rent
- $1,504 high interval (Pro) →
- Mortgage (P&I)
- −$981
- Tax from tax record
- −$323 /mo · $3,880/yr
- Insurance
- −$78
- HOA
- −$0
- Vacancy / Maint / Mgmt
- −$316
- Net cashflow
- $-194
Break-even live
Sensitivity live
| Price | -10% $-88 | -5% $-141 | +0% $-194 | +5% $-247 | +10% $-300 |
|---|---|---|---|---|---|
| Rent | -10% $-313 | -5% $-253 | +0% $-194 | +5% $-135 | +10% $-75 |
| Rate | -1.0pp $-100 | -0.5pp $-146 | base $-194 | +0.5pp $-242 | +1.0pp $-292 |
UW: 25.0% down · 7.5% · 30yr · 1.5% tax · 5.0% vac · 8.0% maint · 8.0% mgmt
Financing live
Cash to close
- Down payment
- $46,750
- Closing costs
- $5,610
- Reserves months
- —
- Total cash needed
- —
Loan-product check · same deal, 3 products live
Conventional
25% down · 7.5% · 30yr
- Down + closing
- —
- Monthly P&I
- —
- Monthly cashflow
- —
- DSCR
- —
- Eligible?
- —
Personal DTI + credit; lowest rate.
DSCR
20% down · 8.5% · 30yr
- Down + closing
- —
- Monthly P&I
- —
- Monthly cashflow
- —
- DSCR
- —
- Eligible?
- —
No personal income docs; deal must DSCR.
Hard money
10% down · 12.0% · 12mo
- Down + closing
- —
- Monthly P&I
- —
- Monthly cashflow
- —
- DSCR
- —
- Eligible?
- —
Short-term bridge; refi at stabilization.
Rent comps 27 comps
| Address | Beds | Baths | Sqft | Rent | $/sqft | DOM | Units | Dist |
|---|---|---|---|---|---|---|---|---|
| 12407 Hosanna Way Houston, TX | 4.0 | 2.0 | 1275 | $2,200 | $1.73 | 26d | 1 | 0.16mi |
| 4203 Stonehenge Trl Houston, TX | 3.0 | 2.0 | 1500 | $1,811 | $1.21 | 14d | 1 | 0.93mi |
| 13949 Bammel North Houston Rd Unit 2162 Houston, TX | 2.0 | 2.0 | 902 | $830 | $0.92 | 9d | 1 | 1.28mi |
| 13949 Bammel North Houston Rd Unit 2047 Houston, TX | 2.0 | 2.0 | 902 | $865 | $0.96 | 6d | 1 | 1.29mi |
| 13949 Bammel North Houston Rd Unit 2047 Houston, TX | 2.0 | 2.0 | 902 | $855 | $0.95 | 0d | 1 | 1.29mi |
| 13955 Bammel North Houston Rd Houston, TX | 2.0 | 1.0 | 914 | $980 | $1.07 | 13d | 1 | 1.31mi |
| 13955 Bammel North Houston Rd Houston, TX | 2.0 | 1.0 | 914 | $980 | $1.07 | 23d | 1 | 1.31mi |
| 12817 Greenwood Forest Dr Houston, TX | 2.0 | 2.0 | 983 | $1,020 | $1.04 | 23d | 1 | 1.38mi |
| 12817 Greenwood Forest Dr Houston, TX | 2.0 | 2.0 | 983 | $1,020 | $1.04 | 45d | 1 | 1.38mi |
| 12801 Champion Forest Dr Houston, TX | 1.0–3.0 | 1.0–2.0 | 1039 | $1,477 | $1.42 | 0d | 15 | 1.40mi |
| 12801 Champion Forest Dr Houston, TX | 1.0–3.0 | 1.0–2.0 | 925 | $1,478 | $1.60 | 45d | 28 | 1.40mi |
| 12820 Greenwood Forest Dr Apt 420 Houston, TX | 2.0 | 2.0 | 979 | $985 | $1.01 | 17d | 1 | 1.46mi |
| 12820 Greenwood Forest Dr Unit 3047 Houston, TX | 3.0 | 2.0 | 1458 | $1,884 | $1.29 | 4d | 1 | 1.46mi |
| 12820 Greenwood Forest Dr Unit 525 Houston, TX | 3.0 | 2.0 | 1458 | $1,844 | $1.26 | 0d | 1 | 1.46mi |
| 12820 Greenwood Forest Dr Apt 424 Houston, TX | 2.0 | 2.0 | 979 | $1,110 | $1.13 | 9d | 1 | 1.46mi |
| 12820 Greenwood Forest Dr Unit 2148 Houston, TX | 2.0 | 2.0 | 979 | $1,135 | $1.16 | 0d | 1 | 1.46mi |
| 12820 Greenwood Forest Dr Unit 3047 Houston, TX | 3.0 | 2.0 | 1458 | $1,895 | $1.30 | 0d | 1 | 1.46mi |
| 12820 Greenwood Forest Dr Unit 425 Houston, TX | 2.0 | 2.0 | 979 | $1,094 | $1.12 | 0d | 1 | 1.46mi |
| 5959 Farm to Market 1960 Rd W Unit 2174 Houston, TX | 2.0 | 2.0 | 880 | $1,080 | $1.23 | 12d | 1 | 1.46mi |
| 5959 Farm to Market 1960 Rd W Unit 424 Houston, TX | 2.0 | 2.0 | 880 | $1,056 | $1.20 | 7d | 1 | 1.46mi |
| 5959 Farm to Market 1960 Rd W Unit 6016 Houston, TX | 2.0 | 2.0 | 880 | $1,145 | $1.30 | 14d | 1 | 1.46mi |
| 5959 Farm to Market 1960 Rd W Unit 2112 Houston, TX | 2.0 | 2.0 | 880 | $1,040 | $1.18 | 0d | 1 | 1.46mi |
| 5959 Farm to Market 1960 Rd W Apt 422 Houston, TX | 2.0 | 2.0 | 880 | $1,056 | $1.20 | 9d | 1 | 1.46mi |
| 12811 Greenwood Forest Dr Unit 422 Houston, TX | 2.0 | 2.0 | 983 | $1,095 | $1.11 | 9d | 1 | 1.48mi |
| 12811 Greenwood Forest Dr Unit 12838 Houston, TX | 2.0 | 2.0 | 983 | $1,119 | $1.14 | 12d | 1 | 1.48mi |
| 12811 Greenwood Forest Dr Houston, TX | 1.0–2.0 | 1.0–2.5 | 935 | $1,307 | $1.40 | 0d | 25 | 1.48mi |
| 12811 Greenwood Forest Dr Unit 2047 Houston, TX | 2.0 | 2.0 | 983 | $1,130 | $1.15 | 12d | 1 | 1.49mi |
Listing history 19 events
-
2026-06-21days on market $187,000 Active 39 DOM
-
2026-06-18days on market $187,000 Active 36 DOM
-
2026-06-17days on market $187,000 Active 35 DOM
-
2026-06-16days on market $187,000 Active 34 DOM
-
2026-06-15days on market $187,000 Active 33 DOM
-
2026-06-13days on market $187,000 Active 31 DOM
-
2026-06-09days on market $187,000 Active 27 DOM
-
2026-06-08days on market $187,000 Active 26 DOM
-
2026-06-07days on market $187,000 Active 25 DOM
-
2026-06-04days on market $187,000 Active 22 DOM
-
2026-06-03days on market $187,000 Active 21 DOM
-
2026-06-02days on market $187,000 Active 20 DOM
-
2026-06-01days on market $187,000 Active 19 DOM
-
2026-05-31days on market $187,000 Active 18 DOM
-
2026-05-13$187,000 Active
-
2026-04-27historical
-
2026-04-07price $199,500
-
2026-03-06price $203,000
-
2026-01-14$210,000 Active
ⓘ Source: listings_history table (triggers on properties + properties_extension) + one-shot
backfill from property_details.listing_events for pre-trigger history.
Tax reassessment forecast TX · Resets to sale price
- Current annual tax
- $3,880 · $323/mo
- Projected year-2 tax
- $3,880 · $323/mo
- Expected delta
- $0/yr ($0/mo · 0.0%)
ⓘ Screening estimate from a state-policy table — verify with the county assessor before closing.
Climate risk First Street
- Flood 6/10 Major FEMA zone X (unshaded) · 71% chance over 30 yrs
- Wildfire 1/10 Low
- Heat 9/10 Extreme 7 d/yr ≥110°F today · 24 d/yr by 30 yrs out
- Wind 8/10 Severe 99% chance of damaging wind over 30 yrs
- Air quality 3/10 Moderate 3 unhealthy d/yr today · 3 by 30 yrs out
Nearby sold comps map
Loading sold comps map…
Walkable amenities ~0.75 mi
Loading nearby amenities…
Taxation est. · year 1
- Rental income
- $18,043
- − Mortgage interest
- −$10,475
- − Property taxes
- −$3,880
- − Insurance
- −$935
- − Repairs & maintenance
- −$1,443
- − Management
- −$1,443
- − Depreciation
- −$5,440
- Taxable loss
- −$5,573
- Est. tax savings @ 24.0%
- +$1,338
- After-tax cash flow
- $-991/yr
For passive investors: Depreciation is non-cash, so a rental often shows a tax loss while cash-flowing — sheltering income. Rental losses are passive: they offset passive income freely, and up to $25,000/yr can offset ordinary (W-2) income if you actively participate and your MAGI is under $100k (phasing out to $0 by $150k); unused losses carry forward. On sale, claimed depreciation is recaptured at up to 25%, and gains may owe capital-gains tax (a 1031 exchange can defer both). Figures are a year-1 estimate at your 24.0% rate — not tax advice; consult a CPA.
Schools (NCES district)
- District
- Klein ISD
- NCES district ID
- 4825740
- Math proficiency
- 41% ▼ -12.00%
- Reading proficiency
- 48% ▼ -3.00%
- Median HH income
- $78,288
- Composite
- 40.91/100
- National rank
- #3615
- State rank
- #213 of 826 in TX
Livability — Houston
- Score
- 74/100
- State rank
- #184
- US rank
- #4771
Category grades
Schools grade is shown separately in the Schools card above.
Census & demographics
- County
- Harris County · 4,702,590 people
- City population
- 3,226,434
- Metro
- Houston-The Woodlands-Sugar Land, TX
- Population (ZIP)
- 39,311
- Household income
- $87,138
- Rent vs Own
- Severe rent burden
- 815.0
Population outlook (Harris County) Hauer SSP2
- Today (2025)
- 5,571,493 people
- By 2030
- 6,089,821 · +9.3%
- By 2040
- 7,142,806 · +28.2%
- By 2050
- 8,185,864 · +46.9%
- By 2075
- 10,574,329 · +89.8%
- By 2100
- 12,109,958 · +117.4%
Race, ethnicity, and origin ACS 2023
- Neighborhood character
- Diverse neighborhood (Simpson 0.69)
- Race & ethnicity
- Hispanic / Latino 47% Black 23% Two or more races 21% Asian 15% White 13%
- Hispanic origin (detail)
- Mexican 32%
- Common ancestry
- Romanian 1%
- Foreign-born
- 31% · Canada, Vietnam, Jamaica
- Languages at home
- 49% English-only · Spanish 36% Vietnamese 8% Other Asian/Pacific 2%
Political lean MEDSL · Harris
- 2024 margin
- Lean D (+5.5) · D 52.0% · R 46.4% · Other 1.6%
- 2008→2024 swing
- +3.9pp toward D · 2008: 1.6pp · 2024: 5.5pp
- All cycles
- 2024: D+5.5 2020: D+13.3 2016: D+12.4 2012: D+0.1 2008: D+1.6
Not yet ingested
- Civics
- —
Market trends
- HPI YoY
- ▼ -1.02%
- Current HPI
- 261.1086
- Rent YoY
- ▼ -4.69%
- Metro
- Houston-The Woodlands-Sugar Land, TX
- State GDP YoY
- ▲ 3.95%
- F500 in state
- 110
Industry mix (Fortune 500 HQ in TX)
| Industry | F500 HQs | Revenue |
|---|---|---|
| Energy | 16 | $1,198B |
|
||
| Technology | 5 | $198B |
|
||
| Engineering / Construction | 4 | $72B |
|
||
| Energy Services | 3 | $60B |
|
||
| Utilities | 3 | $41B |
|
||
| Healthcare | 2 | $330B |
|
||
Price history
-11.0% since first listed5 events — show timeline
- 2026-05-13 Listed $187,000 HARMLS
- 2026-04-27 Listing Removed — HARMLS
- 2026-04-07 Price Changed $199,500 HARMLS
- 2026-03-06 Price Changed $203,000 HARMLS
- 2026-01-14 Listed $210,000 HARMLS
Property tax history
+27.2%/yrLatest (2025): $3,880 · +8.7% YoY. Source: county tax records.
Cash-flow waterfall
monthlySold comps — $/sqft
last 12 mo · ≤1 miLoading sold comps…