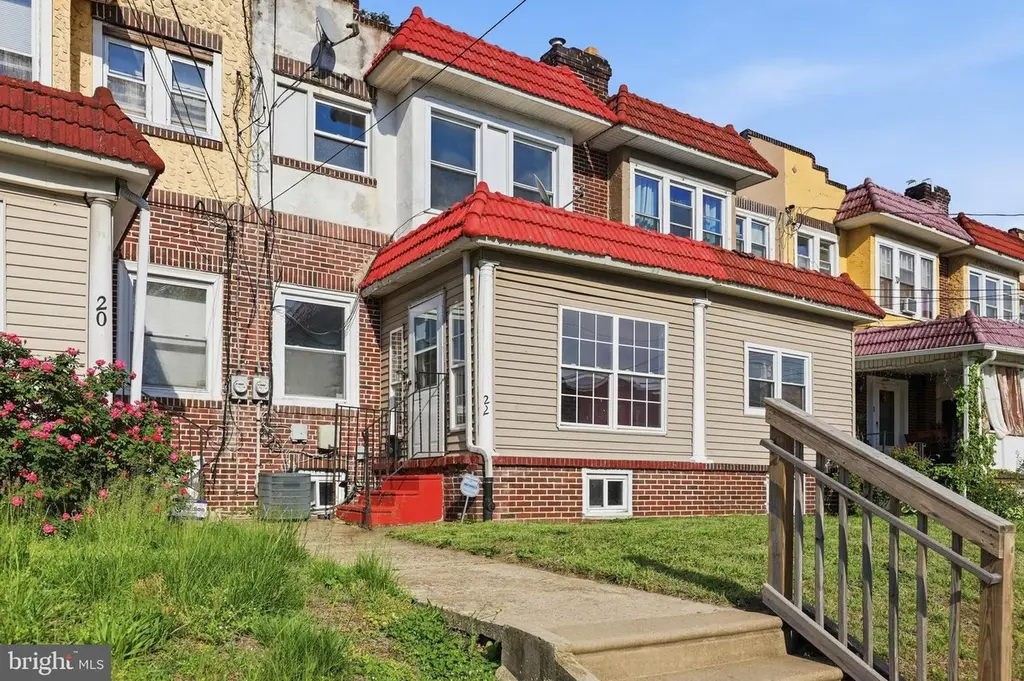
22 Terrace Ave · Camden, NJ
Flood risk 1/10 · Minimal
- FEMA flood zone
- X (unshaded)
- Chance of flooding over 30 yrs
- 0.0%
- Est. flood insurance / yr
- $507 – $1,088
Fire risk 1/10 · Minimal
- Est. fire insurance / yr
- $526 – $976
Heat risk 7/10 · Major
- Hot days now (above 104°F)
- 7 days/yr
- Hot days in 30 yrs
- 15 days/yr
Wind risk 6/10 · Moderate
- Chance of severe wind over 30 yrs
- 38.0%
Air-quality risk 4/10 · Minor
- Unhealthy air days now
- 5 days/yr
- Unhealthy air days in 30 yrs
- 6 days/yr
Risk factors via First Street. Map © Google.
Why this score? — see what drove the B grade
The composite is a weighted blend of 9 inputs, each scored 0–100. Each bar is that input's sub-score; the figure is the points it added to the 100-point composite (weight × sub-score).
- Cash flow +28.9/30.0
- ARV discount +15.0/15.0
- DSCR +10.0/10.0
- 1% rule +8.6/10.0
- Livability +3.5/5.0
- Rent growth +2.5/5.0
- Condition / age +2.5/5.0
- Schools +0.7/10.0
- Appreciation +0.0/10.0
$159,900
🖨 Deal sheet 📄 Offer letter ✓ Due diligence
Listing remarks
Handyman Special! Instant Equity To Be Earned! Welcome to 22 Terrace Avenue offering a clean 3 bedroom, 2 full bathroom home located in the desirable East Camden section. This property needs some TLC but offers tremendous upside and endless potential for the right buyer. Perfect opportunity for an investor, fix & flip project, buy and hold rental, or owner occupant looking to build equity. The home features great curb appeal and a functional layout throughout. The main level offers an enclosed front porch, spacious living room, formal dining room, and nicely sized kitchen. The second floor features 3 generously sized bedrooms and 1 full bathroom. The lower level offers additional livi
Key facts
- Garage
- Built 1925
- Listed 37 days
Property features AI
Exterior
- Parking: Built-in attached garage with one garage space
- Utilities: Public water; Public sewer
- Home design: Interior townhouse/rowhouse; Fee simple ownership
- Construction: Concrete perimeter foundation; Other structures above and below grade
- Exterior features: No tidal water
Interior
- Bedrooms: Three bedrooms on the upper level
- Bathrooms: Two full bathrooms (one on the upper level, one on the lower level)
- Heating & cooling: Heating: Other; Cooling: Other; Hot water: Other
- Interior features: Interior access to basement; Above-grade finished living area reported by assessor
Neighborhood map
What this means for you Summary
Snapshot
- This is a 3-bed/2.0-bath single-family listed at $160k.
Deal economics
- At list price, monthly cash flow is $545 ($7k/yr) — positive.
- The deal already cash-flows at list — no discount required.
- Meets the 1% rule at list price ($2k rent vs $160k).
- Recommended offer: $155k (3.0% below list) — sets the bar for market timing.
- Cap rate 10.4% vs local median 7.1% in Camden — top-decile yield for the area; either an underpriced asset or a hidden risk that comps aren't pricing in. Stress-test before assuming the spread holds.
Location & tenants
- Location reads 70/100 on livability (#262 in NJ) — a middle-class / working-renter tenant base. Strengths: amenities A+, commute A+, cost of living A; Watch: schools F, crime F, employment F.
- Camden City School District (urban): math 3% / reading 16% proficiency, ranked #472 of 472 in NJ (top 100%) — low school quality limits family demand, transient renter base, plan for 1-2y turnover; 86% free/reduced lunch — lower-income household profile, screen leases tightly.
- Market conditions: 59 active listings in the ZIP; 19 comparable units currently listed for rent nearby; rentals at typical pace (median 24d on market — plan ~3-4 weeks tenant-placement turnaround); 1,018 units permitted in Camden County in 2024 (509 in 5+ unit buildings).
Forward outlook
- Local home prices are declining (-3.0%/yr); year-one equity from $1k of loan paydown is wiped out by about $5k of value loss. Plan a longer hold.
- Camden County population projected to shrink 8% by 2050 — rents likely to lag national; underwrite the cash flow, not the appreciation.
- At projected returns (-3.0% appreciation + 3.0% rent growth), your $45k cash investment doubles in ~8 years — after that, you're playing with house money.
Negotiation context
- It's been on market 37 days — a 3% lower offer ($155k) is reasonable based on typical stale-listing flexibility.
- 5 sale attempts since 28y ago with the ask held roughly flat each time — persistent listings suggest the price (not the market) is what's stuck; bring a comps-based counter.
- Current owner paid $110k; 45% above their basis — modest negotiation headroom, anchor on the comps not their cost.
Risks & watch-outs
- Watch-outs: built in 1925 — expect roof / HVAC / electrical / plumbing capex.
- Climate carrying-cost: major wind risk, 38% chance of damaging wind over 30y; extreme-heat days projected 7→15/yr by 2055 (HVAC capex compounding) — expect insurance premiums to compound above CPI over the hold.
Questions for the listing agent
- It's been on market 37 days. Have you received any prior offers? Is the seller open to a 3% concession, seller financing, or rate buy-down credit?
- Built in 1925 — when were the roof, HVAC, electrical panel, plumbing, and water heater last replaced?
- Is there a deadline driving the sale (1031 exchange, divorce, estate, relocation)? That informs how much negotiation room exists.
- Schools are F-rated, which usually means shorter tenancies and higher turnover. Who's the typical renter profile here, and what's been the actual vacancy rate?
- Crime grade is F in this area — have there been break-ins, vandalism, or insurance claims at this property in the last 3 years? What carrier currently insures it and at what premium?
- What's the average days-on-market for RENTAL listings here right now (not sales)? A rising rental-DOM trend means longer vacancies and softer asking-rent achievability than the comps imply.
- What's the recent tenant-quality profile in this submarket — average credit score on applications, eviction rate, late-payment / NSF rate, and stable-employment percentage? A property-management company in the area should have these aggregated.
- How much new for-sale + rental construction is in the pipeline within 1–3 miles? Heavy new supply typically softens prices + rents 12–24 months out; constrained supply supports both.
Investment metrics
- 1% rule
- 1.36% ✓
- Cap rate
- 10.38%
- Cash-on-cash
- 14.60%
- DSCR
- 1.65
- GRM
- 6.1
CMA / ARV
- ARV (on-the-fly)
- $279,360
- Comps found
- 12
Show comp detail 12 sales within ~0.75 mi
| Address | Dist | Beds/Ba | Sqft | Sold | Price | $/sf | Match |
|---|---|---|---|---|---|---|---|
| 2249 39th St | 0.30mi | 3/2.0 | 1,200 (+3%) | 1mo | $201,000 | $168 | 80 |
| 2232 42nd St | 0.45mi | 3/1.5 | 1,196 (+3%) | 4mo | $268,000 | $224 | 69 |
| 243 N 40th St | 0.44mi | 3/2.0 | 1,120 (-4%) | 6mo | $229,900 | $205 | 68 |
| 6415 Walton Ave | 0.65mi | 3/2.0 | 1,144 (-2%) | 3mo | $352,000 | $308 | 65 |
| 4755 W End Ave | 0.45mi | 2/1.5 (-1) | 1,038 (-11%) | 2mo | $170,000 | $164 | 52 |
| 2201 38th St | 0.30mi | 4/1.5 (+1) | 1,328 (+14%) | 4mo | $260,000 | $196 | 52 |
| 2503 48th St | 0.63mi | 3/1.0 | 1,248 (+7%) | 3mo | $300,000 | $240 | 52 |
| 1763 41st St | 0.72mi | 3/2.0 | 1,260 (+8%) | 2mo | $364,900 | $290 | 51 |
| 6501 Roosevelt Ave | 0.59mi | 2/1.5 (-1) | 1,080 (-7%) | 6mo | $290,000 | $269 | 49 |
| 4749 Poplar Ave | 0.47mi | 3/1.0 | 996 (-14%) | 5mo | $215,000 | $216 | 46 |
| 5131 Elvena Ave | 0.68mi | 3/2.0 | 1,308 (+12%) | 4mo | $340,000 | $260 | 44 |
| 4742 Browning Rd | 0.55mi | 2/1.0 (-1) | 1,010 (-13%) | 1mo | $250,000 | $248 | 43 |
Match score weights: distance 35% · size 25% · config 20% · recency 20%. Top-matched comps best support the ARV.
Projected returns pro-forma
-3.0% appreciation · 3.0% rent growth · sell at horizon
- IRR
- 5.1%
- Equity multiple
- 1.20×
- Total profit
- $8,855
- Equity at exit
- $23,842
- IRR
- 14.6%
- Equity multiple
- 2.18×
- Total profit
- $52,694
- Equity at exit
- $13,825
Cash invested: $44,772 (down + closing). Projections, not guarantees.
Landlord ↔ Tenant lean methodology
- Overall (STATE)
- 21 Tenant-Leaning
- State New Jersey
- 21 Tenant-Leaning · D+6
- County
- — inherits STATE
- City
- — inherits STATE
ZIP-level market 08105
- Home prices YoY
- -30.6%
- Active inventory
- 59
- Price-to-rent
- 6.1×
Monthly cashflow live
- Estimated rent
- $2,181 high interval (Pro) →
- Mortgage (P&I)
- −$839
- Tax from tax record
- −$273 /mo · $3,274/yr
- Insurance
- −$67
- HOA
- −$0
- Vacancy / Maint / Mgmt
- −$458
- Net cashflow
- $545
Break-even live
UW: 25.0% down · 7.5% · 30yr · 1.5% tax · 5.0% vac · 8.0% maint · 8.0% mgmt
Financing live
Cash to close
- Down payment
- $39,975
- Closing costs
- $4,797
- Reserves months
- —
- Total cash needed
- —
Loan-product check · same deal, 3 products live
Conventional
25% down · 7.5% · 30yr
- Down + closing
- —
- Monthly P&I
- —
- Monthly cashflow
- —
- DSCR
- —
- Eligible?
- —
Personal DTI + credit; lowest rate.
DSCR
20% down · 8.5% · 30yr
- Down + closing
- —
- Monthly P&I
- —
- Monthly cashflow
- —
- DSCR
- —
- Eligible?
- —
No personal income docs; deal must DSCR.
Hard money
10% down · 12.0% · 12mo
- Down + closing
- —
- Monthly P&I
- —
- Monthly cashflow
- —
- DSCR
- —
- Eligible?
- —
Short-term bridge; refi at stabilization.
Rent comps 19 comps
| Address | Beds | Baths | Sqft | Rent | $/sqft | DOM | Units | Dist |
|---|---|---|---|---|---|---|---|---|
| 4621 Woodland Ave Pennsauken, NJ | 3.0 | 1.5 | 1148 | $2,200 | $1.92 | 24d | 1 | 0.09mi |
| 106 N 34th St Unit B Camden, NJ | 3.0 | 2.0 | 900 | $1,950 | $2.17 | 24d | 1 | 0.29mi |
| 380 Garden Ave Camden, NJ | 2.0 | 2.0 | 1184 | $2,100 | $1.77 | 24d | 1 | 0.52mi |
| 5122 Garfield Ave Pennsauken, NJ | 3.0 | 1.0 | 1308 | $2,500 | $1.91 | 24d | 1 | 0.67mi |
| 324 S 27th St Camden, NJ | 3.0 | 1.0 | 1152 | $1,900 | $1.65 | 24d | 1 | 0.72mi |
| 4137 Marlton Pike Pennsauken Township, NJ | 2.0 | 1.0 | 900 | $1,800 | $2.00 | 24d | 1 | 0.74mi |
| 2752 Mickle St Camden, NJ | 3.0 | 1.0 | 1450 | $1,850 | $1.28 | 16d | 1 | 0.75mi |
| 2323 Browning Rd Pennsauken, NJ | 3.0 | 1.0 | 923 | $2,500 | $2.71 | 24d | 1 | 0.78mi |
| 4601 High St Pennsauken, NJ | 1.0–2.0 | 1.0 | 800 | $1,675 | $2.09 | 3d | 4 | 0.82mi |
| 5729 Irving Ave Pennsauken, NJ | 3.0 | 1.5 | 1200 | $2,150 | $1.79 | 16d | 1 | 1.06mi |
| 5454 Burwood Ave Pennsauken, NJ | 3.0 | 1.5 | 1419 | $2,650 | $1.87 | 5d | 1 | 1.07mi |
| 2277 Hollinshed Ave Pennsauken, NJ | 3.0 | 1.5 | 1164 | $2,400 | $2.06 | 24d | 1 | 1.08mi |
| 1535 Gross Ave Pennsauken, NJ | 3.0 | 1.0 | 1272 | $2,150 | $1.69 | 24d | 1 | 1.23mi |
| 6366 Rogers Ave Unit 3 Pennsauken Township, NJ | 3.0 | 1.0 | 1100 | $2,100 | $1.91 | 24d | 1 | 1.29mi |
| 2395 New Jersey Cherry Hill Township, NJ | 3.0 | 1.0–3.0 | 1050 | $4,034 | $3.84 | 1d | 15 | 1.32mi |
| 200 E Maple Ave Apt 13 Merchantville, NJ | 2.0 | 1.0 | 1000 | $2,000 | $2.00 | 2d | 1 | 1.42mi |
| 200 E Maple Ave Unit 08 Merchantville, NJ | 2.0 | 1.0 | 1000 | $2,000 | $2.00 | 18d | 1 | 1.42mi |
| 200 E Maple Ave Unit 10 Merchantville, NJ | 2.0 | 1.0 | 1000 | $2,000 | $2.00 | 4d | 1 | 1.42mi |
| 202 Park Blvd Cherry Hill, NJ | 1.0–2.0 | 1.0–2.0 | 1075 | $4,570 | $4.25 | 1d | 7 | 1.42mi |
Listing history 28 events
-
2026-06-18days on market $159,900 Active 37 DOM
-
2026-06-17days on market $159,900 Active 36 DOM
-
2026-06-16days on market $159,900 Active 35 DOM
-
2026-06-15days on market $159,900 Active 34 DOM
-
2026-06-13days on market $159,900 Active 32 DOM
-
2026-06-13days on market $159,900 Active 31 DOM
-
2026-06-09days on market $159,900 Active 28 DOM
-
2026-06-08days on market $159,900 Active 27 DOM
-
2026-06-07days on market $159,900 Active 26 DOM
-
2026-06-04days on market $159,900 Active 23 DOM
-
2026-06-03days on market $159,900 Active 22 DOM
-
2026-06-02days on market $159,900 Active 21 DOM
-
2026-06-01days on market $159,900 Active 20 DOM
-
2026-05-31days on market $159,900 Active 19 DOM
-
2026-05-12$159,900 Active 1024-char remark
-
2012-02-15historical
-
2008-10-08$49,500
-
2008-10-01historical
-
2008-04-06$105,900
-
2005-12-06soldstatus $94,700
-
2005-11-04soldstatus $90,000
-
2005-10-15historical
-
2005-09-12$90,000
-
1999-05-28soldstatus $43,500
-
1998-11-16soldstatus $17,000
-
1998-10-27soldstatus $17,000
-
1998-06-09$17,000
-
1979-11-01soldstatus $19,900
ⓘ Source: listings_history table (triggers on properties + properties_extension) + one-shot
backfill from property_details.listing_events for pre-trigger history.
Tax reassessment forecast NJ · Partial reset (capped growth)
- Current annual tax
- $3,274 · $273/mo
- Projected year-2 tax
- $3,628 · $302/mo
- Expected delta
- +$354/yr (+$29/mo · 10.8%)
ⓘ Screening estimate from a state-policy table — verify with the county assessor before closing.
Climate risk First Street
- Flood 1/10 Low FEMA zone X (unshaded) · 0% chance over 30 yrs
- Wildfire 1/10 Low
- Heat 7/10 Severe 7 d/yr ≥104°F today · 15 d/yr by 30 yrs out
- Wind 6/10 Major 38% chance of damaging wind over 30 yrs
- Air quality 4/10 Moderate 5 unhealthy d/yr today · 6 by 30 yrs out
Nearby sold comps map
Loading sold comps map…
Walkable amenities ~0.75 mi
Loading nearby amenities…
Taxation est. · year 1
- Rental income
- $26,167
- − Mortgage interest
- −$8,957
- − Property taxes
- −$3,274
- − Insurance
- −$800
- − Repairs & maintenance
- −$2,093
- − Management
- −$2,093
- − Depreciation
- −$4,652
- Taxable income
- $4,298
- Est. tax owed @ 24.0%
- −$1,031
- After-tax cash flow
- $5,504/yr
For passive investors: Depreciation is non-cash, so a rental often shows a tax loss while cash-flowing — sheltering income. Rental losses are passive: they offset passive income freely, and up to $25,000/yr can offset ordinary (W-2) income if you actively participate and your MAGI is under $100k (phasing out to $0 by $150k); unused losses carry forward. On sale, claimed depreciation is recaptured at up to 25%, and gains may owe capital-gains tax (a 1031 exchange can defer both). Figures are a year-1 estimate at your 24.0% rate — not tax advice; consult a CPA.
Schools (NCES district)
- District
- Camden City School District
- NCES district ID
- 3402640
- Math proficiency
- 3% ▼ -6.00%
- Reading proficiency
- 16% ▬ 0.00%
- Median HH income
- $25,845
- Composite
- 6.85/100
- National rank
- #9981
- State rank
- #472 of 472 in NJ
Livability — Camden
- Score
- 70/100
- State rank
- #262
- US rank
- #7721
Category grades
Schools grade is shown separately in the Schools card above.
Census & demographics
- Census place
- Camden, NJ
- City population
- 20,865
- Population (ZIP)
- 26,681
Population outlook (Camden County) Hauer SSP2
- Today (2025)
- 507,964 people
- By 2030
- 502,182 · -1.1%
- By 2040
- 485,602 · -4.4%
- By 2050
- 465,630 · -8.3%
- By 2075
- 419,986 · -17.3%
- By 2100
- 369,492 · -27.3%
Race, ethnicity, and origin ACS 2023
- Neighborhood character
- Predominantly Hispanic (71%)
- Race & ethnicity
- Hispanic / Latino 71% Black 24% Two or more races 11% Asian 2% White 1% Native American 1%
- Hispanic origin (detail)
- Mexican 9% Puerto Rican 33% Dominican 20%
- Common ancestry
- Russian 1%
- Foreign-born
- 28% · Canada, Vietnam
- Languages at home
- 36% English-only · Spanish 59% French/Haitian/Cajun 2% Vietnamese 1%
Political lean MEDSL · Camden
- 2024 margin
- Strong D (+27.4) · D 63.0% · R 35.5% · Other 1.5%
- 2008→2024 swing
- -8.8pp toward R · 2008: 36.2pp · 2024: 27.4pp
- All cycles
- 2024: D+27.4 2020: D+33.5 2016: D+32.4 2012: D+36.6 2008: D+36.2
Not yet ingested
- Civics
- —
Market trends
- HPI YoY
- ▼ -130.41%
- Current HPI
- 295.6492
- Rent YoY
- —
- Metro
- —
- State GDP YoY
- ▲ 2.05%
- F500 in state
- 34
Industry mix (Fortune 500 HQ in NJ)
| Industry | F500 HQs | Revenue |
|---|---|---|
| Consumer Goods | 3 | $31B |
|
||
| Pharmaceuticals | 2 | $153B |
|
||
| Technology | 2 | $21B |
|
||
| Insurance | 2 | $20B |
|
||
| Healthcare | 2 | $19B |
|
||
| Financial Services | 1 | $70B |
|
||
Price history
+703.5% since first listed15 events — show timeline
- 2026-05-12 Listed $159,900 BRIGHT MLS
- 2026-05-08 Sold (Public Records) $110,000 Public Records
- 2012-02-15 Listing Removed — BRIGHT MLS
- 2008-10-08 Listed $49,500 BRIGHT MLS
- 2008-10-01 Listing Removed — BRIGHT MLS
- 2008-04-06 Listed $105,900 BRIGHT MLS
- 2005-12-06 Sold (Public Records) $94,700 Public Records
- 2005-11-04 Sold (MLS) $90,000 BRIGHT MLS
- 2005-10-15 Listing Removed — BRIGHT MLS
- 2005-09-12 Listed $90,000 BRIGHT MLS
- 1999-05-28 Sold (Public Records) $43,500 Public Records
- 1998-11-16 Sold (Public Records) $17,000 Public Records
- 1998-10-27 Sold (MLS) $17,000 BRIGHT MLS
- 1998-06-09 Listed $17,000 BRIGHT MLS
- 1979-11-01 Sold (Public Records) $19,900 Public Records
Property tax history
+4.1%/yrLatest (2025): $3,274 · +4.1% YoY. Source: county tax records.
Cash-flow waterfall
monthlySold comps — $/sqft
last 12 mo · ≤1 miLoading sold comps…