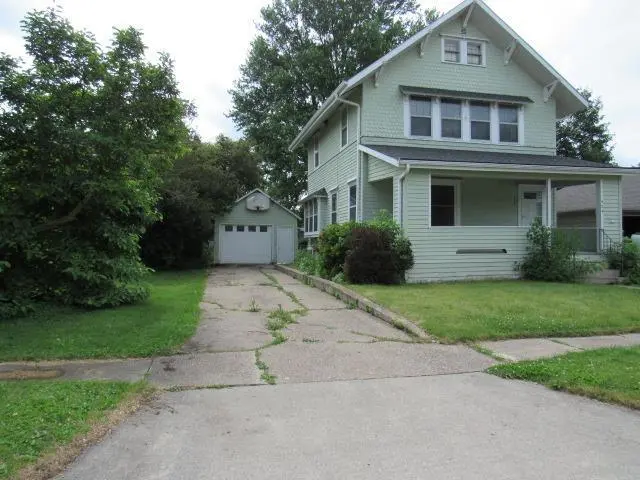
424 S Chestnut Street St · Monticello, IA
Flood risk 1/10 · Minimal
- FEMA flood zone
- X (unshaded)
- Chance of flooding over 30 yrs
- 0.0%
- Est. flood insurance / yr
- $473 – $860
Fire risk 4/10 · Minor
- Est. fire insurance / yr
- $902 – $1,676
Heat risk 3/10 · Minor
- Hot days now (above 103°F)
- 7 days/yr
- Hot days in 30 yrs
- 15 days/yr
Wind risk 2/10 · Minimal
- Chance of severe wind over 30 yrs
- —
Air-quality risk 2/10 · Minimal
- Unhealthy air days now
- 1 days/yr
- Unhealthy air days in 30 yrs
- 1 days/yr
Risk factors via First Street. Map © Google.
Why this score? — see what drove the B- grade
The composite is a weighted blend of 9 inputs, each scored 0–100. Each bar is that input's sub-score; the figure is the points it added to the 100-point composite (weight × sub-score).
- Cash flow +24.9/30.0
- ARV discount +15.0/15.0
- DSCR +8.1/10.0
- 1% rule +6.8/10.0
- Schools +6.0/10.0
- Livability +3.9/5.0
- Rent growth +2.5/5.0
- Condition / age +2.5/5.0
- Appreciation +0.0/10.0
$99,900
🖨 Deal sheet (PDF) 📄 Offer letter ✓ Due diligence
Listing remarks MLS
Imagine sitting on the front porch and watching the world go by! You can if this is your next home! A craftsman style home with wood floors throughout, nice wood work and unique features. There are three bedrooms on the second floor with a totally remodeled full bath and a laundry chute that runs from the second floor all the way to the basement laundry. The main floor has a nice sized kitchen with updated cabinets, formal dining room, large living room and an impressive stairway up plus a 1/2 bath. The basement does have the laundry room with wash sink and there is a finished family room.
Key facts
- Well-sized kitchen
- Wide grand staircase
- Natural light
Tags
Property features AI
Finance
- HOA & community: Sidewalks in the neighborhood
Exterior
- Parking: Carport (1 space)
- Security: Smoke detectors
- Utilities: Public water; Public sewer; Natural gas service
- Home design: Single-family residence; 2 stories
- Construction: Wood siding exterior; Shingle roof; Basement (partially finished, interior entry)
- Exterior features: Landscaped lot with garden; Level lot; Concrete road access; Storage structure on property; Porch (covered)
Interior
- Kitchen: Microwave; Refrigerator
- Flooring: Hardwood floors
- Bathrooms: 1 full bathroom; 1 half bathroom
- Heating & cooling: Forced air heating (natural gas); Central air conditioning
- Interior features: Water softener (owned); No fireplace reported
- Laundry & utility: Washer and dryer connections with dryer included; Laundry located on lower level; Gas water heater; Sump pump in basement
Neighborhood map
What this means for you Summary
Snapshot
- This is a 3-bed/1.5-bath single-family listed at $100k.
Deal economics
- At list price, monthly cash flow is $216 ($3k/yr) — positive.
- The deal already cash-flows at list — no discount required.
- Meets the 1% rule at list price ($1k rent vs $100k).
- Cap rate 8.9% vs local median 3.4% in Monticello — top-decile yield for the area; either an underpriced asset or a hidden risk that comps aren't pricing in. Stress-test before assuming the spread holds.
Location & tenants
- Location reads 78/100 on livability (#149 in IA, #2,739 nationally) — a middle-class / working-renter tenant base. Strengths: crime A+, cost of living A+, housing A+; Watch: amenities F, commute F.
- Monticello Community School District (town): math 68% / reading 73% proficiency, ranked #131 of 289 in IA (top 45%) — strong family-tenant draw, lease renewals of 3-5y typical.
- Zoned schools: Carpenter Elementary School (math 72% / reading 72%, grade A-, #181 of 616 statewide, top 34%, 196 students, 44% FRL); Monticello Middle School (math 65% / reading 69%, grade A-, #140 of 246 statewide, top 60%, 299 students, 34% FRL); Monticello High School (math 68% / reading 80%, grade B+, #103 of 336 statewide, top 32%, 366 students, 26% FRL).
- Market conditions: 47 active listings in the ZIP; 25 units permitted in Jones County in 2024 (0 in 5+ unit buildings).
Forward outlook
- Local home prices are declining (-3.0%/yr); year-one equity from $691 of loan paydown is wiped out by about $3k of value loss. Plan a longer hold.
- Jones County population projected to shrink 8% by 2050 — rents likely to lag national; underwrite the cash flow, not the appreciation.
Negotiation context
- Only 1 days on market — expect competitive offers; lowballing is unlikely to land.
- 2 sale attempts since 10y ago with the ask held roughly flat each time — persistent listings suggest the price (not the market) is what's stuck; bring a comps-based counter.
- Current owner paid $72k; 38% above their basis — modest negotiation headroom, anchor on the comps not their cost.
Risks & watch-outs
- Watch-outs: built in 1916 — expect roof / HVAC / electrical / plumbing capex.
Questions for the listing agent
- Built in 1916 — when were the roof, HVAC, electrical panel, plumbing, and water heater last replaced?
- Is there a deadline driving the sale (1031 exchange, divorce, estate, relocation)? That informs how much negotiation room exists.
- Schools are A-rated — typically a magnet for longer-tenancy family renters. What's the average tenant stay here, and is there a school-zone premium baked into asking?
- What's the average days-on-market for RENTAL listings here right now (not sales)? A rising rental-DOM trend means longer vacancies and softer asking-rent achievability than the comps imply.
- What's the recent tenant-quality profile in this submarket — average credit score on applications, eviction rate, late-payment / NSF rate, and stable-employment percentage? A property-management company in the area should have these aggregated.
- How much new for-sale + rental construction is in the pipeline within 1–3 miles? Heavy new supply typically softens prices + rents 12–24 months out; constrained supply supports both.
Investment metrics
- 1% rule
- 1.18% ✓
- Cap rate
- 8.88%
- Cash-on-cash
- 9.25%
- DSCR
- 1.41
- GRM
- 7.0
CMA / ARV
- ARV (on-the-fly)
- $177,112
- Comps found
- 12
Show comp detail 12 sales within ~0.75 mi
| Address | Dist | Beds/Ba | Sqft | Sold | Price | $/sf | Match |
|---|---|---|---|---|---|---|---|
| 128 S Gill St | 0.24mi | 3/1.5 | 1,808 (+6%) | 1mo | $179,000 | $99 | 78 |
| 512 Park Drive Dr | 0.25mi | 3/1.5 | 1,773 (+4%) | 5mo | $185,000 | $104 | 77 |
| 121 N Walnut Street St | 0.29mi | 3/3.0 | 1,726 (+1%) | 4mo | $180,500 | $105 | 74 |
| 118 W Buckeye St | 0.11mi | 3/2.0 | 1,581 (-7%) | 8mo | $135,000 | $85 | 74 |
| 502 N Maple Street St | 0.63mi | 3/1.5 | 1,660 (-2%) | 2mo | $175,000 | $105 | 65 |
| 223 N Sycamore Street St | 0.42mi | 3/1.5 | 1,544 (-9%) | 2mo | $100,000 | $65 | 63 |
| 410 N Cedar St | 0.52mi | 3/1.0 | 1,786 (+5%) | 4mo | $140,000 | $78 | 62 |
| 637 W 6th St | 0.68mi | 3/1.5 | 1,700 (-0%) | 8mo | $160,000 | $94 | 61 |
| 308 N Chestnut Street St | 0.40mi | 3/1.0 | 1,900 (+12%) | 0mo | $154,900 | $82 | 60 |
| 907 Southhaven Drive Dr | 0.60mi | 3/2.0 | 1,580 (-7%) | 2mo | $191,500 | $121 | 56 |
| 907 S Main Street St | 0.47mi | 3/2.0 | 1,540 (-10%) | 8mo | $200,000 | $130 | 53 |
| 823 Timberline Rd | 0.51mi | 3/2.0 | 1,484 (-13%) | 6mo | $179,000 | $121 | 48 |
Match score weights: distance 35% · size 25% · config 20% · recency 20%. Top-matched comps best support the ARV.
Projected returns pro-forma
-3.0% appreciation · 3.0% rent growth · sell at horizon
- IRR
- -2.3%
- Equity multiple
- 0.91×
- Total profit
- $-2,424
- Equity at exit
- $14,895
- IRR
- 7.4%
- Equity multiple
- 1.56×
- Total profit
- $15,712
- Equity at exit
- $8,638
Cash invested: $27,972 (down + closing). Projections, not guarantees.
Landlord ↔ Tenant lean methodology
- Overall (STATE)
- 83 Strongly Landlord-Friendly
- State Iowa
- 83 Strongly Landlord-Friendly · R+6
- County
- — inherits STATE
- City
- — inherits STATE
ZIP-level market 52310
- Home prices YoY
- -25.9%
- Active inventory
- 47
- Price-to-rent
- 7.0×
Monthly cashflow live
- Estimated rent
- $1,183 medium interval (Pro) →
- Mortgage (P&I)
- −$524
- Tax from tax record
- −$154 /mo · $1,842/yr
- Insurance
- −$42
- HOA
- −$0
- Vacancy / Maint / Mgmt
- −$248
- Net cashflow
- $216
Break-even live
Sensitivity live
| Price | -10% $272 | -5% $244 | +0% $216 | +5% $187 | +10% $159 |
|---|---|---|---|---|---|
| Rent | -10% $122 | -5% $169 | +0% $216 | +5% $262 | +10% $309 |
| Rate | -1.0pp $266 | -0.5pp $241 | base $216 | +0.5pp $190 | +1.0pp $163 |
UW: 25.0% down · 7.5% · 30yr · 1.5% tax · 5.0% vac · 8.0% maint · 8.0% mgmt
Financing live
Cash to close
- Down payment
- $24,975
- Closing costs
- $2,997
- Reserves months
- —
- Total cash needed
- —
Loan-product check · same deal, 3 products live
Conventional
25% down · 7.5% · 30yr
- Down + closing
- —
- Monthly P&I
- —
- Monthly cashflow
- —
- DSCR
- —
- Eligible?
- —
Personal DTI + credit; lowest rate.
DSCR
20% down · 8.5% · 30yr
- Down + closing
- —
- Monthly P&I
- —
- Monthly cashflow
- —
- DSCR
- —
- Eligible?
- —
No personal income docs; deal must DSCR.
Hard money
10% down · 12.0% · 12mo
- Down + closing
- —
- Monthly P&I
- —
- Monthly cashflow
- —
- DSCR
- —
- Eligible?
- —
Short-term bridge; refi at stabilization.
Listing history 3 events
-
2026-06-09status $99,900 Pending 1 DOM
-
2026-06-09remarks 693-char remark
-
2026-06-09$99,900 Active 1 DOM
ⓘ Source: listings_history table (triggers on properties + properties_extension) + one-shot
backfill from property_details.listing_events for pre-trigger history.
Tax reassessment forecast IA · Partial reset (capped growth)
- Current annual tax
- $1,842 · $154/mo
- Projected year-2 tax
- $1,842 · $154/mo
- Expected delta
- $0/yr ($0/mo · 0.0%)
ⓘ Screening estimate from a state-policy table — verify with the county assessor before closing.
Climate risk First Street
- Flood 1/10 Low FEMA zone X (unshaded) · 0% chance over 30 yrs
- Wildfire 4/10 Moderate
- Heat 3/10 Moderate 7 d/yr ≥103°F today · 15 d/yr by 30 yrs out
- Wind 2/10 Low
- Air quality 2/10 Low 1 unhealthy d/yr today · 1 by 30 yrs out
Nearby sold comps map
Loading sold comps map…
Walkable amenities ~0.75 mi
Loading nearby amenities…
Taxation est. · year 1
- Rental income
- $14,196
- − Mortgage interest
- −$5,596
- − Property taxes
- −$1,842
- − Insurance
- −$500
- − Repairs & maintenance
- −$1,136
- − Management
- −$1,136
- − Depreciation
- −$2,906
- Taxable income
- $1,081
- Est. tax owed @ 24.0%
- −$259
- After-tax cash flow
- $2,327/yr
For passive investors: Depreciation is non-cash, so a rental often shows a tax loss while cash-flowing — sheltering income. Rental losses are passive: they offset passive income freely, and up to $25,000/yr can offset ordinary (W-2) income if you actively participate and your MAGI is under $100k (phasing out to $0 by $150k); unused losses carry forward. On sale, claimed depreciation is recaptured at up to 25%, and gains may owe capital-gains tax (a 1031 exchange can defer both). Figures are a year-1 estimate at your 24.0% rate — not tax advice; consult a CPA.
Schools (NCES district)
- District
- Monticello Community School District
- NCES district ID
- 1919650
- Math proficiency
- 68% ▼ -3.00%
- Reading proficiency
- 73% ▬ 0.00%
- Median HH income
- $52,768
- Composite
- 60.03/100
- National rank
- #872
- State rank
- #131 of 289 in IA
Livability — Monticello
- Score
- 78/100
- State rank
- #149
- US rank
- #2739
Category grades
Schools grade is shown separately in the Schools card above.
Census & demographics
- Census place
- Monticello, IA
- Population (ZIP)
- 6,384
Population outlook (Jones County) Hauer SSP2
- Today (2025)
- 20,023 people
- By 2030
- 19,702 · -1.6%
- By 2040
- 19,007 · -5.1%
- By 2050
- 18,396 · -8.1%
- By 2075
- 17,955 · -10.3%
- By 2100
- 17,448 · -12.9%
Race, ethnicity, and origin ACS 2023
- Neighborhood character
- Predominantly White (93%)
- Race & ethnicity
- White 93% Two or more races 5% Hispanic / Latino 3% Black 1%
- Common ancestry
- Iranian 1% Lithuanian 1% Portuguese 1%
- Foreign-born
- 0% · Canada
- Languages at home
- 96% English-only · Spanish 3% Other Asian/Pacific 1%
Political lean MEDSL · Jones
- 2024 margin
- Strong R (+26.3) · D 36.0% · R 62.3% · Other 1.7%
- 2008→2024 swing
- -36.7pp toward R · 2008: 10.4pp · 2024: -26.3pp
- All cycles
- 2024: R+26.3 2020: R+21.5 2016: R+19.4 2012: D+7.7 2008: D+10.4
Not yet ingested
- Civics
- —
Market trends
- HPI YoY
- ▼ -68.44%
- Current HPI
- 196.1405
- Rent YoY
- —
- Metro
- —
- State GDP YoY
- ▲ 2.48%
- F500 in state
- 4
Industry mix (Fortune 500 HQ in IA)
| Industry | F500 HQs | Revenue |
|---|---|---|
| Financial Services | 1 | $16B |
|
||
| Retail / Convenience | 1 | $15B |
|
||
Price history
+35.2% since first listed4 events — show timeline
- 2026-06-05 Listed $99,900 NEIRBR as distributed by MLS GRID
- 2016-03-18 Sold (Public Records) $72,500 Public Records
- 2016-03-18 Sold (MLS) $72,500 NEIRBR as distributed by MLS GRID
- 2016-01-15 Listed $73,900 NEIRBR as distributed by MLS GRID
Property tax history
+4.5%/yrLatest (2025): $1,842 · +4.5% YoY. Source: county tax records.
Cash-flow waterfall
monthlySold comps — $/sqft
last 12 mo · ≤1 miLoading sold comps…