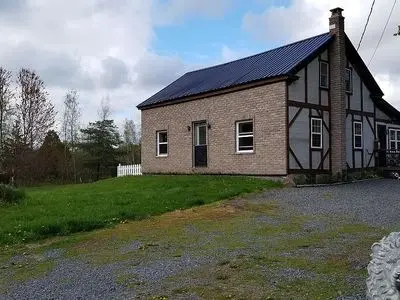
284 W Parishville Rd · Hannawa Falls, NY
Flood risk 1/10 · Minimal
- FEMA flood zone
- —
- Chance of flooding over 30 yrs
- 0.0%
- Est. flood insurance / yr
- —
Fire risk 3/10 · Minor
- Est. fire insurance / yr
- $691 – $1,283
Heat risk 1/10 · Minimal
- Hot days now (above 92°F)
- 7 days/yr
- Hot days in 30 yrs
- 15 days/yr
Wind risk 1/10 · Minimal
- Chance of severe wind over 30 yrs
- —
Air-quality risk 1/10 · Minimal
- Unhealthy air days now
- 0 days/yr
- Unhealthy air days in 30 yrs
- 0 days/yr
Risk factors via First Street. Map © Google.
Why this score? — see what drove the C- grade
The composite is a weighted blend of 9 inputs, each scored 0–100. Each bar is that input's sub-score; the figure is the points it added to the 100-point composite (weight × sub-score).
- Cash flow +15.0/30.0
- Appreciation +10.0/10.0
- ARV discount +7.5/15.0
- Schools +5.0/10.0
- DSCR +4.6/10.0
- Livability +3.4/5.0
- 1% rule +3.2/10.0
- Rent growth +2.5/5.0
- Condition / age +2.5/5.0
$160,000
🖨 Deal sheet 📄 Offer letter ✓ Due diligence
Listing remarks MLS
This old home has GREAT bones (stunning hand hewn beams), and potential galore! It’s already framed out and waiting for you to make this a wonderful home, or an amazing hunting camp! Out back you’ll find a meadow, small birch forest, open hardwoods, a babbling brook, and a series of white tail deer highways! Come check it out today!
Key facts
- Large acreage
- Waterfront
- Built 1850
Tags
Neighborhood map
What this means for you Summary
Snapshot
- This is a 3-bed/1.0-bath single-family listed at $160k.
Deal economics
- At list price, monthly cash flow is $50 ($601/yr) — positive.
- The deal already cash-flows at list — no discount required.
- To meet the 1% rule (rent ≥ 1% of price), the offer needs to be $131k (17.8% below list).
- Recommended offer: $131k (17.8% below list) — sets the bar for 1% rule.
Location & tenants
- Location reads 68/100 on livability (#537 in NY) — a middle-class / working-renter tenant base. Strengths: employment A+, housing A+, crime A; Watch: health & safety C-, schools F, amenities F.
- Parishville-Hopkinton Central School District (rural): math 65% / reading 51% proficiency, ranked #326 of 755 in NY (top 43%) — acceptable for families but not a draw, mixed tenant base, ~2y average lease.
- Market conditions: 117 active listings in the ZIP; 215 units permitted in St. Lawrence County in 2024 (0 in 5+ unit buildings).
Forward outlook
- In year one you build about $17k of equity ($1k loan paydown + $16k appreciation (10.0% local appreciation)).
- St. Lawrence County population projected at -14% by 2050 — secular population decline; favor cash flow + early exit over multi-decade hold.
- At projected returns (10.0% appreciation + 3.0% rent growth), your $45k cash investment doubles in ~3 years — after that, you're playing with house money.
- By year 3, paydown + projected appreciation supports a ~$43k cash-out refi (75% LTV) — recoverable capital for the next deal without selling this one.
Negotiation context
- It's been on market 26 days — a 2% lower offer ($158k) is reasonable based on typical stale-listing flexibility.
- 2 sale attempts since 6y ago with the ask held roughly flat each time — persistent listings suggest the price (not the market) is what's stuck; bring a comps-based counter.
- Current owner paid $40k; list at $160k implies a 300% gain — meaningful room to come down on a strong offer.
Risks & watch-outs
- Watch-outs: built in 1850 — expect roof / HVAC / electrical / plumbing capex.
Questions for the listing agent
- Built in 1850 — when were the roof, HVAC, electrical panel, plumbing, and water heater last replaced?
- Is there a deadline driving the sale (1031 exchange, divorce, estate, relocation)? That informs how much negotiation room exists.
- Schools are F-rated, which usually means shorter tenancies and higher turnover. Who's the typical renter profile here, and what's been the actual vacancy rate?
- What's the average days-on-market for RENTAL listings here right now (not sales)? A rising rental-DOM trend means longer vacancies and softer asking-rent achievability than the comps imply.
- What's the recent tenant-quality profile in this submarket — average credit score on applications, eviction rate, late-payment / NSF rate, and stable-employment percentage? A property-management company in the area should have these aggregated.
- How much new for-sale + rental construction is in the pipeline within 1–3 miles? Heavy new supply typically softens prices + rents 12–24 months out; constrained supply supports both.
Investment metrics
- 1% rule
- 0.82% ✗
- Cap rate
- 6.67%
- Cash-on-cash
- 1.34%
- DSCR
- 1.06
- GRM
- 10.1
CMA / ARV
No comps found within radius.
Projected returns pro-forma
10.0% appreciation · 3.0% rent growth · sell at horizon
- IRR
- 25.2%
- Equity multiple
- 3.02×
- Total profit
- $90,279
- Equity at exit
- $144,141
- IRR
- 22.2%
- Equity multiple
- 6.88×
- Total profit
- $263,244
- Equity at exit
- $310,845
Cash invested: $44,800 (down + closing). Projections, not guarantees.
Landlord ↔ Tenant lean methodology
- Overall (STATE)
- 15 Strongly Tenant-Friendly
- State New York
- 15 Strongly Tenant-Friendly · D+10
- County
- — inherits STATE
- City
- — inherits STATE
ZIP-level market 13676
- Home prices YoY
- 17.7%
- Active inventory
- 117
- Price-to-rent
- 10.1×
Monthly cashflow live
- Estimated rent
- $1,315 medium interval (Pro) →
- Mortgage (P&I)
- −$839
- Tax from tax record
- −$83 /mo · $995/yr
- Insurance
- −$67
- HOA
- −$0
- Vacancy / Maint / Mgmt
- −$276
- Net cashflow
- $50
Break-even live
UW: 25.0% down · 7.5% · 30yr · 1.5% tax · 5.0% vac · 8.0% maint · 8.0% mgmt
Financing live
Cash to close
- Down payment
- $40,000
- Closing costs
- $4,800
- Reserves months
- —
- Total cash needed
- —
Loan-product check · same deal, 3 products live
Conventional
25% down · 7.5% · 30yr
- Down + closing
- —
- Monthly P&I
- —
- Monthly cashflow
- —
- DSCR
- —
- Eligible?
- —
Personal DTI + credit; lowest rate.
DSCR
20% down · 8.5% · 30yr
- Down + closing
- —
- Monthly P&I
- —
- Monthly cashflow
- —
- DSCR
- —
- Eligible?
- —
No personal income docs; deal must DSCR.
Hard money
10% down · 12.0% · 12mo
- Down + closing
- —
- Monthly P&I
- —
- Monthly cashflow
- —
- DSCR
- —
- Eligible?
- —
Short-term bridge; refi at stabilization.
Listing history 17 events
-
2026-06-18days on market $160,000 Active 26 DOM
-
2026-06-17days on market $160,000 Active 25 DOM
-
2026-06-16days on market $160,000 Active 24 DOM
-
2026-06-15days on market $160,000 Active 23 DOM
-
2026-06-13days on market $160,000 Active 21 DOM
-
2026-06-12days on market $160,000 Active 20 DOM
-
2026-06-09days on market $160,000 Active 17 DOM
-
2026-06-08days on market $160,000 Active 16 DOM
-
2026-06-07days on market $160,000 Active 15 DOM
-
2026-06-07days on market $160,000 Active 14 DOM
-
2026-06-04days on market $160,000 Active 11 DOM
-
2026-06-02days on market $160,000 Active 10 DOM
-
2026-06-01days on market $160,000 Active 9 DOM
-
2026-05-31days on market $160,000 Active 8 DOM
-
2026-05-23$160,000 Active
-
2020-10-14soldstatus $40,000 346-char remark
Show marketing remark (346 chars)
This old home has GREAT bones (stunning hand hewn beams), and potential galore! It’s already framed out and waiting for you to make this a wonderful home, or an amazing hunting camp! Out back you’ll find a meadow, small birch forest, open hardwoods, a babbling brook, and a series of white tail deer highways! Come check it out today!
-
2020-08-15$39,000 346-char remark
Show marketing remark (346 chars)
This old home has GREAT bones (stunning hand hewn beams), and potential galore! It’s already framed out and waiting for you to make this a wonderful home, or an amazing hunting camp! Out back you’ll find a meadow, small birch forest, open hardwoods, a babbling brook, and a series of white tail deer highways! Come check it out today!
ⓘ Source: listings_history table (triggers on properties + properties_extension) + one-shot
backfill from property_details.listing_events for pre-trigger history.
Tax reassessment forecast NY · Partial reset (capped growth)
- Current annual tax
- $995 · $83/mo
- Projected year-2 tax
- $1,850 · $154/mo
- Expected delta
- +$854/yr (+$71/mo · 85.8%)
ⓘ Screening estimate from a state-policy table — verify with the county assessor before closing.
Climate risk First Street
- Flood 1/10 Low 0% chance over 30 yrs
- Wildfire 3/10 Moderate
- Heat 1/10 Low 7 d/yr ≥92°F today · 15 d/yr by 30 yrs out
- Wind 1/10 Low
- Air quality 1/10 Low 0 unhealthy d/yr today · 0 by 30 yrs out
Nearby sold comps map
Loading sold comps map…
Walkable amenities ~0.75 mi
Loading nearby amenities…
Taxation est. · year 1
- Rental income
- $15,779
- − Mortgage interest
- −$8,962
- − Property taxes
- −$995
- − Insurance
- −$800
- − Repairs & maintenance
- −$1,262
- − Management
- −$1,262
- − Depreciation
- −$4,655
- Taxable loss
- −$2,158
- Est. tax savings @ 24.0%
- +$518
- After-tax cash flow
- $1,119/yr
For passive investors: Depreciation is non-cash, so a rental often shows a tax loss while cash-flowing — sheltering income. Rental losses are passive: they offset passive income freely, and up to $25,000/yr can offset ordinary (W-2) income if you actively participate and your MAGI is under $100k (phasing out to $0 by $150k); unused losses carry forward. On sale, claimed depreciation is recaptured at up to 25%, and gains may owe capital-gains tax (a 1031 exchange can defer both). Figures are a year-1 estimate at your 24.0% rate — not tax advice; consult a CPA.
Schools (NCES district)
- District
- Parishville-Hopkinton Central School District
- NCES district ID
- 3622440
- Math proficiency
- 65% ▲ 10.00%
- Reading proficiency
- 51% ▬ 0.00%
- Median HH income
- $43,130
- Composite
- 50.48/100
- National rank
- #3989
- State rank
- #326 of 755 in NY
Livability — Hannawa Falls
- Score
- 68/100
- State rank
- #537
- US rank
- #9683
Category grades
Schools grade is shown separately in the Schools card above.
Census & demographics
- City population
- 159
- Population (ZIP)
- 13,408
Population outlook (St. Lawrence County) Hauer SSP2
- Today (2025)
- 110,027 people
- By 2030
- 107,455 · -2.3%
- By 2040
- 100,492 · -8.7%
- By 2050
- 94,254 · -14.3%
- By 2075
- 80,175 · -27.1%
- By 2100
- 63,140 · -42.6%
Race, ethnicity, and origin ACS 2023
- Neighborhood character
- Predominantly White (90%)
- Race & ethnicity
- White 90% Two or more races 4% Asian 3% Hispanic / Latino 2% Black 2%
- Common ancestry
- Lithuanian 6% Romanian 4% Iranian 2%
- Foreign-born
- 7% · Canada, China
- Languages at home
- 94% English-only · Spanish 2% Other Indo-European 1% French/Haitian/Cajun 1%
Political lean MEDSL · St. Lawrence
- 2024 margin
- R (+18.0) · D 41.0% · R 59.0%
- 2008→2024 swing
- -34.3pp toward R · 2008: 16.3pp · 2024: -18.0pp
- All cycles
- 2024: R+18.0 2020: R+11.7 2016: R+10.8 2012: D+16.6 2008: D+16.3
Not yet ingested
- Civics
- —
Market trends
- HPI YoY
- ▲ 48.01%
- Current HPI
- 318.7704
- Rent YoY
- —
- Metro
- —
- State GDP YoY
- ▲ 2.60%
- F500 in state
- 92
Industry mix (Fortune 500 HQ in NY)
| Industry | F500 HQs | Revenue |
|---|---|---|
| Financial Services | 10 | $950B |
|
||
| Consumer Goods | 9 | $162B |
|
||
| Insurance | 4 | $225B |
|
||
| Telecommunications | 2 | $144B |
|
||
| Pharmaceuticals | 2 | $112B |
|
||
| Media / Entertainment | 2 | $69B |
|
||
Price history
+310.3% since first listed3 events — show timeline
- 2026-05-23 Listed $160,000 FSBO.com
- 2020-10-14 Sold (MLS) $40,000 SLCMLS
- 2020-08-15 Listed $39,000 SLCMLS
Property tax history
-5.1%/yrLatest (2025): $995 · +2.1% YoY. Source: county tax records.
Cash-flow waterfall
monthlySold comps — $/sqft
last 12 mo · ≤1 miLoading sold comps…