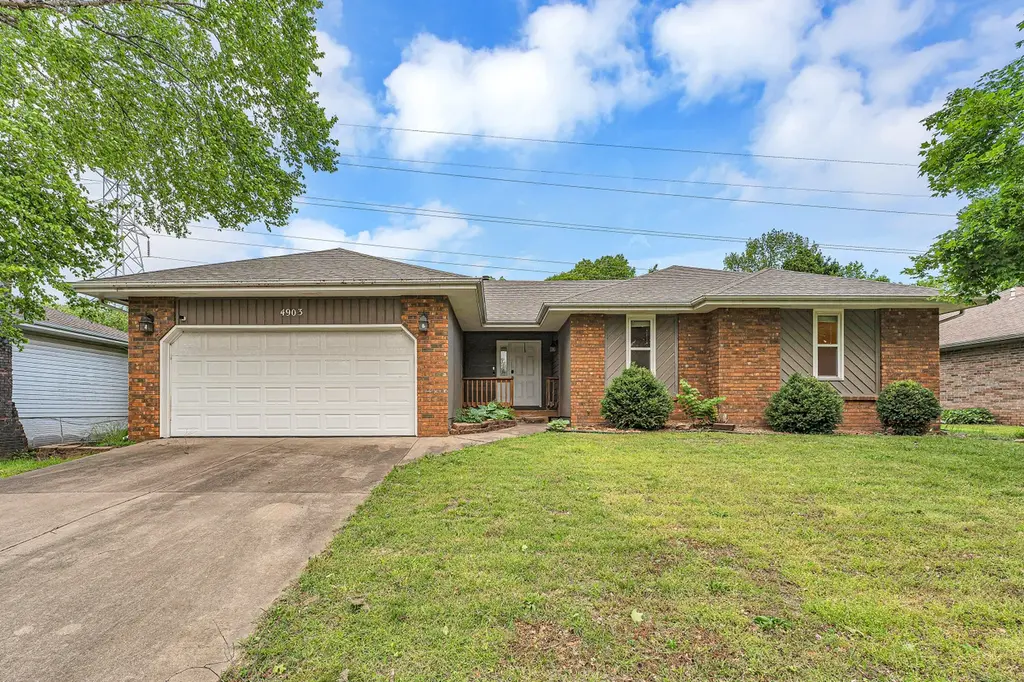
4903 S Glenn Ave · Springfield, MO
Flood risk 1/10 · Minimal
- FEMA flood zone
- X (unshaded)
- Chance of flooding over 30 yrs
- 0.0%
- Est. flood insurance / yr
- $507 – $1,088
Fire risk 2/10 · Minimal
- Est. fire insurance / yr
- $1,054 – $1,958
Heat risk 5/10 · Moderate
- Hot days now (above 105°F)
- 7 days/yr
- Hot days in 30 yrs
- 18 days/yr
Wind risk 2/10 · Minimal
- Chance of severe wind over 30 yrs
- 0.0%
Air-quality risk 1/10 · Minimal
- Unhealthy air days now
- 0 days/yr
- Unhealthy air days in 30 yrs
- 0 days/yr
Risk factors via First Street. Map © Google.
Why this score? — see what drove the C- grade
The composite is a weighted blend of 9 inputs, each scored 0–100. Each bar is that input's sub-score; the figure is the points it added to the 100-point composite (weight × sub-score).
- Cash flow +15.6/30.0
- ARV discount +15.0/15.0
- DSCR +4.8/10.0
- Livability +3.8/5.0
- 1% rule +3.2/10.0
- Schools +3.2/10.0
- Rent growth +3.1/5.0
- Condition / age +2.5/5.0
- Appreciation +0.0/10.0
$269,900
🖨 Deal sheet 📄 Offer letter ✓ Due diligence
Listing remarks MLS
Complete Remodel with clean lines and lots of up-scale! New granite in kitchen and bath, new stainless appliances and all sell with the home. New titled step-in shower, new paint, new carpet, new cabinets, new tile, new gutters & down spouts, new energy efficient windows. Even the AC compressor is new. Every bedroom has a large closet! Hot tub also sells with the home. Don''t miss this is on a very large lot!
Key facts
- 54 acre lot
- Home security system
- Newer garage door
Tags
Property features AI
Exterior
- Parking: Attached garage facing front; 2-car garage
- Security: Security system
- Utilities: Public water; Septic tank
- Home design: Single family residence; One level
- Construction: Frame construction; Composition roof; Built area above grade: 1,591
- Exterior features: Patio; Privacy fencing; Shed(s)
Interior
- Kitchen: Electric oven; Free-standing electric oven; Microwave; Refrigerator; Granite counters
- Bedrooms: Bedrooms not specified
- Flooring: Carpet; Tile; Hardwood
- Bathrooms: 2 full bathrooms
- Heating & cooling: Central air conditioning; Natural gas heating; Forced-air heating
- Interior features: Granite counters; Insulated double-pane windows; Fireplace in the living room; Water purifier
- Laundry & utility: Washer; Dryer
Neighborhood map
What this means for you Summary
Snapshot
- This is a 3-bed/2.0-bath single-family listed at $270k.
Deal economics
- At list price, monthly cash flow is $112 ($1k/yr) — positive.
- The deal already cash-flows at list — no discount required.
- To meet the 1% rule (rent ≥ 1% of price), the offer needs to be $222k (17.7% below list).
- Recommended offer: $222k (17.7% below list) — sets the bar for 1% rule.
- Cap rate 6.8% vs local median 4.6% in Springfield — top-decile yield for the area; either an underpriced asset or a hidden risk that comps aren't pricing in. Stress-test before assuming the spread holds.
Location & tenants
- Location reads 75/100 on livability (#57 in MO, #4,121 nationally) — a middle-class / working-renter tenant base. Strengths: commute A+, cost of living A+, housing A+; Watch: crime F, employment F.
- Springfield R-XII (urban): math 32% / reading 46% proficiency, ranked #174 of 324 in MO (top 54%) — families likely to look elsewhere, expect single-tenant / working-renter base with shorter leases.
- Zoned schools: Cherokee Middle (math 50% / reading 62%, grade B-, #40 of 391 statewide, top 10%, 758 students, 27% FRL); Kickapoo High (math 39% / reading 66%, grade C-, #89 of 521 statewide, top 17%, 1,881 students, 26% FRL) — zoned schools average 27% FRL vs 46% district-wide (20 pts lower); this property's tenant base skews higher-income than the district average.
- Zoned-school proficiency averages 54% at this address vs 39% district-wide (+15 pts) — the actual schools serving this property are materially stronger than the Springfield R-XII average implies; a family-tenant draw the district grade alone would hide.
- Market conditions: Rents rising (+2.5%/yr); 250 active listings in the ZIP; 4 comparable units currently listed for rent nearby; rentals leasing fast (median 14d on market — plan ~1-2 weeks tenant-placement turnaround); solid renter incomes; 1,302 units permitted in Greene County in 2024 (250 in 5+ unit buildings).
Forward outlook
- Local home prices are declining (-3.0%/yr); year-one equity from $2k of loan paydown is wiped out by about $8k of value loss. Plan a longer hold.
- Greene County population projected at +25% by 2050 — long-run rental-demand tailwind backs the buy-and-hold thesis.
Negotiation context
- It's been on market 19 days — a 2% lower offer ($266k) is reasonable based on typical stale-listing flexibility.
- 2 sale attempts since 12y ago with the ask held roughly flat each time — persistent listings suggest the price (not the market) is what's stuck; bring a comps-based counter.
Risks & watch-outs
- Climate carrying-cost: extreme-heat days projected 7→18/yr by 2055 (HVAC capex compounding) — expect insurance premiums to compound above CPI over the hold.
Questions for the listing agent
- Is there a deadline driving the sale (1031 exchange, divorce, estate, relocation)? That informs how much negotiation room exists.
- Crime grade is F in this area — have there been break-ins, vandalism, or insurance claims at this property in the last 3 years? What carrier currently insures it and at what premium?
- What's the average days-on-market for RENTAL listings here right now (not sales)? A rising rental-DOM trend means longer vacancies and softer asking-rent achievability than the comps imply.
- What's the recent tenant-quality profile in this submarket — average credit score on applications, eviction rate, late-payment / NSF rate, and stable-employment percentage? A property-management company in the area should have these aggregated.
- How much new for-sale + rental construction is in the pipeline within 1–3 miles? Heavy new supply typically softens prices + rents 12–24 months out; constrained supply supports both.
Investment metrics
- 1% rule
- 0.82% ✗
- Cap rate
- 6.79%
- Cash-on-cash
- 1.78%
- DSCR
- 1.08
- GRM
- 10.1
CMA / ARV
- ARV (median comp)
- $410,288
- List price
- $269,900
- Delta
- -34.22%
- Verdict
- UNDERPRICED
- Comps
- 20 within 1.0 mi
Show comp detail 12 sales within ~0.75 mi
| Address | Dist | Beds/Ba | Sqft | Sold | Price | $/sf | Match |
|---|---|---|---|---|---|---|---|
| 3031 W Marty St | 0.20mi | 3/2.0 | 1,710 (+8%) | 8mo | $379,995 | $222 | 72 |
| 5114 S Forest Ct | 0.59mi | 3/2.0 | 1,640 (+3%) | 1mo | $324,900 | $198 | 67 |
| 2398 W Allen Dr | 0.57mi | 3/2.5 | 1,575 (-1%) | 5mo | $284,900 | $181 | 65 |
| 3005 W Teton Dr | 0.17mi | 3/2.0 | 1,825 (+15%) | 6mo | $399,995 | $219 | 62 |
| 4932 S Aaron Ave | 0.25mi | 3/2.0 | 1,815 (+14%) | 5mo | $419,900 | $231 | 61 |
| 3119 W Melbourne St | 0.73mi | 3/2.0 | 1,520 (-4%) | 5mo | $299,900 | $197 | 54 |
| 2764 W Vincent St | 0.40mi | 4/2.5 (+1) | 1,756 (+10%) | 4mo | $245,600 | $140 | 53 |
| 2672 W Village Ter | 0.52mi | 3/2.0 | 1,370 (-14%) | 2mo | $229,900 | $168 | 51 |
| 3045 W Darby St | 0.57mi | 3/2.0 | 1,368 (-14%) | 2mo | $230,000 | $168 | 48 |
| 3004 W Knob Hill St | 0.75mi | 3/2.0 | 1,486 (-7%) | 7mo | $215,000 | $145 | 48 |
| 2759 W Buena Vista St | 0.56mi | 4/2.0 (+1) | 1,774 (+12%) | 2mo | $234,900 | $132 | 48 |
| 4941 S James Ave | 0.54mi | 3/2.0 | 1,372 (-14%) | 6mo | $224,900 | $164 | 47 |
Match score weights: distance 35% · size 25% · config 20% · recency 20%. Top-matched comps best support the ARV.
Projected returns pro-forma
-3.0% appreciation · 2.53% rent growth · sell at horizon
- IRR
- -14.0%
- Equity multiple
- 0.50×
- Total profit
- $-37,726
- Equity at exit
- $40,243
- IRR
- -5.9%
- Equity multiple
- 0.63×
- Total profit
- $-28,304
- Equity at exit
- $23,336
Cash invested: $75,572 (down + closing). Projections, not guarantees.
Landlord ↔ Tenant lean methodology
- Overall (STATE)
- 81 Strongly Landlord-Friendly
- State Missouri
- 81 Strongly Landlord-Friendly · R+10
- County
- — inherits STATE
- City
- — inherits STATE
ZIP-level market 65810
- Home prices YoY
- -28.8%
- Rents YoY
- 2.5%
- Active inventory
- 250
- Price-to-rent
- 10.1×
Monthly cashflow live
- Estimated rent
- $2,221 medium interval (Pro) →
- Mortgage (P&I)
- −$1,415
- Tax from tax record
- −$114 /mo · $1,370/yr
- Insurance
- −$112
- HOA
- −$0
- Vacancy / Maint / Mgmt
- −$466
- Net cashflow
- $112
Break-even live
UW: 25.0% down · 7.5% · 30yr · 1.5% tax · 5.0% vac · 8.0% maint · 8.0% mgmt
Financing live
Cash to close
- Down payment
- $67,475
- Closing costs
- $8,097
- Reserves months
- —
- Total cash needed
- —
Loan-product check · same deal, 3 products live
Conventional
25% down · 7.5% · 30yr
- Down + closing
- —
- Monthly P&I
- —
- Monthly cashflow
- —
- DSCR
- —
- Eligible?
- —
Personal DTI + credit; lowest rate.
DSCR
20% down · 8.5% · 30yr
- Down + closing
- —
- Monthly P&I
- —
- Monthly cashflow
- —
- DSCR
- —
- Eligible?
- —
No personal income docs; deal must DSCR.
Hard money
10% down · 12.0% · 12mo
- Down + closing
- —
- Monthly P&I
- —
- Monthly cashflow
- —
- DSCR
- —
- Eligible?
- —
Short-term bridge; refi at stabilization.
Rent comps 4 comps
| Address | Beds | Baths | Sqft | Rent | $/sqft | DOM | Units | Dist |
|---|---|---|---|---|---|---|---|---|
| 2556 W Cardinal St Springfield, MO | 4.0 | 2.0 | 2009 | $2,295 | $1.14 | 13d | 1 | 0.72mi |
| 2183 W Arlington St Springfield, MO | 3.0 | 2.0 | 1850 | $1,995 | $1.08 | 23d | 1 | 0.79mi |
| 5773 Trailside Cir W Springfield, MO | 2.0–3.0 | 2.0–2.5 | 1688 | $3,195 | $1.89 | 13d | 4 | 1.23mi |
| 4159 S El Salvador Ave Springfield, MO | 2.0 | 2.0 | 1129 | $1,095 | $0.97 | 13d | 1 | 1.28mi |
Listing history 8 events
-
2026-05-18status Pending 710-char remark
-
2026-04-29$269,900 Active 710-char remark
-
2014-05-23soldstatus
-
2014-05-21soldstatus 418-char remark
Show marketing remark (418 chars)
Complete Remodel with clean lines and lots of up-scale! New granite in kitchen and bath, new stainless appliances and all sell with the home. New titled step-in shower, new paint, new carpet, new cabinets, new tile, new gutters & down spouts, new energy efficient windows. Even the AC compressor is new. Every bedroom has a large closet! Hot tub also sells with the home. Don''t miss this is on a very large lot!
-
2014-01-20$142,400 418-char remark
Show marketing remark (418 chars)
Complete Remodel with clean lines and lots of up-scale! New granite in kitchen and bath, new stainless appliances and all sell with the home. New titled step-in shower, new paint, new carpet, new cabinets, new tile, new gutters & down spouts, new energy efficient windows. Even the AC compressor is new. Every bedroom has a large closet! Hot tub also sells with the home. Don''t miss this is on a very large lot!
-
2013-04-03soldstatus
-
2005-08-10soldstatus
-
2001-07-17soldstatus
ⓘ Source: listings_history table (triggers on properties + properties_extension) + one-shot
backfill from property_details.listing_events for pre-trigger history.
Tax reassessment forecast MO · Resets to sale price
- Current annual tax
- $1,370 · $114/mo
- Projected year-2 tax
- $2,618 · $218/mo
- Expected delta
- +$1,248/yr (+$104/mo · 91.1%)
ⓘ Screening estimate from a state-policy table — verify with the county assessor before closing.
Climate risk First Street
- Flood 1/10 Low FEMA zone X (unshaded) · 0% chance over 30 yrs
- Wildfire 2/10 Low
- Heat 5/10 Major 7 d/yr ≥105°F today · 18 d/yr by 30 yrs out
- Wind 2/10 Low 0% chance of damaging wind over 30 yrs
- Air quality 1/10 Low 0 unhealthy d/yr today · 0 by 30 yrs out
Nearby sold comps map
Loading sold comps map…
Walkable amenities ~0.75 mi
Loading nearby amenities…
Taxation est. · year 1
- Rental income
- $26,649
- − Mortgage interest
- −$15,119
- − Property taxes
- −$1,370
- − Insurance
- −$1,350
- − Repairs & maintenance
- −$2,132
- − Management
- −$2,132
- − Depreciation
- −$7,852
- Taxable loss
- −$3,305
- Est. tax savings @ 24.0%
- +$793
- After-tax cash flow
- $2,142/yr
For passive investors: Depreciation is non-cash, so a rental often shows a tax loss while cash-flowing — sheltering income. Rental losses are passive: they offset passive income freely, and up to $25,000/yr can offset ordinary (W-2) income if you actively participate and your MAGI is under $100k (phasing out to $0 by $150k); unused losses carry forward. On sale, claimed depreciation is recaptured at up to 25%, and gains may owe capital-gains tax (a 1031 exchange can defer both). Figures are a year-1 estimate at your 24.0% rate — not tax advice; consult a CPA.
Schools (NCES district)
- District
- Springfield R-XII
- NCES district ID
- 2928860
- Math proficiency
- 32% ▼ -2.00%
- Reading proficiency
- 46% ▼ -3.00%
- Median HH income
- $37,886
- Composite
- 32.45/100
- National rank
- #5717
- State rank
- #174 of 324 in MO
Livability — Springfield
- Score
- 75/100
- State rank
- #57
- US rank
- #4121
Category grades
Schools grade is shown separately in the Schools card above.
Census & demographics
- County
- Greene County · 244,327 people
- City population
- 223,044
- Metro
- Springfield, MO
- Population (ZIP)
- 22,137
- Household income
- $95,160
- Rent vs Own
- Severe rent burden
- 437.0
Population outlook (Greene County) Hauer SSP2
- Today (2025)
- 319,054 people
- By 2030
- 335,135 · +5.0%
- By 2040
- 366,186 · +14.8%
- By 2050
- 397,431 · +24.6%
- By 2075
- 477,035 · +49.5%
- By 2100
- 520,828 · +63.2%
Race, ethnicity, and origin ACS 2023
- Neighborhood character
- Predominantly White (89%)
- Race & ethnicity
- White 89% Two or more races 4% Hispanic / Latino 3% Asian 3% Black 2%
- Common ancestry
- Italian 4% Lithuanian 3% Portuguese 3%
- Foreign-born
- 4% · Vietnam, China, Canada
- Languages at home
- 95% English-only · Other Indo-European 1% Spanish 1% Chinese 1%
Political lean MEDSL · Greene
- 2024 margin
- Strong R (+20.8) · D 38.9% · R 59.7% · Other 1.4%
- 2008→2024 swing
- -5.0pp toward R · 2008: -15.8pp · 2024: -20.8pp
- All cycles
- 2024: R+20.8 2020: R+20.1 2016: R+27.4 2012: R+24.4 2008: R+15.8
Not yet ingested
- Civics
- —
Market trends
- HPI YoY
- ▼ -78.67%
- Current HPI
- 194.8736
- Rent YoY
- ▲ 2.53%
- Metro
- Springfield, MO
- State GDP YoY
- ▲ 1.84%
- F500 in state
- 20
Industry mix (Fortune 500 HQ in MO)
| Industry | F500 HQs | Revenue |
|---|---|---|
| Healthcare | 1 | $163B |
|
||
| Insurance | 1 | $21B |
|
||
| Industrial Technology | 1 | $17B |
|
||
| Retail | 1 | $16B |
|
||
| Industrial Distribution | 1 | $10B |
|
||
| Utilities | 1 | $9B |
|
||
Price history
+89.5% since first listed9 events — show timeline
- 2026-06-18 Sold (MLS) — SOMO
- 2026-05-18 Pending — SOMO
- 2026-04-29 Listed $269,900 SOMO
- 2014-05-23 Sold (Public Records) — Public Records
- 2014-05-21 Sold (MLS) — SOMO
- 2014-01-20 Listed $142,400 SOMO
- 2013-04-03 Sold (Public Records) — Public Records
- 2005-08-10 Sold (Public Records) — Public Records
- 2001-07-17 Sold (Public Records) — Public Records
Property tax history
+2.8%/yrLatest (2025): $1,370 · +8.6% YoY. Source: county tax records.
Cash-flow waterfall
monthlySold comps — $/sqft
last 12 mo · ≤1 miLoading sold comps…